| Param | Original file | Final file |
|---|---|---|
| Filename | modeM0/AS1A04_099T01_9000002204_14921cztM0_level2.evt | modeM0/AS1A04_099T01_9000002204_14921cztM0_level2_quad_clean.evt |
| Size (bytes) | 433,483,200 | 85,780,800 |
| Size | 413.4 MB | 81.8 MB |
| Events in quadrant A | 3,147,181 | 554,396 |
| Events in quadrant B | 3,271,386 | 561,548 |
| Events in quadrant C | 3,246,532 | 527,481 |
| Events in quadrant D | 3,040,401 | 520,138 |
| Mode SS | |||
|---|---|---|---|
| Quadrant | BADHDUFLAG | Total packets | Discarded packets |
| A | 0 | 126 | 0 |
| B | 0 | 126 | 0 |
| C | 0 | 126 | 0 |
| D | 0 | 126 | 0 |
| Mode M0 | |||
|---|---|---|---|
| Quadrant | BADHDUFLAG | Total packets | Discarded packets |
| A | 0 | 13050 | 3 |
| B | 0 | 13456 | 2 |
| C | 0 | 13342 | 2 |
| D | 0 | 13006 | 2 |
| Mode M9 | |||
|---|---|---|---|
| Quadrant | BADHDUFLAG | Total packets | Discarded packets |
| A | 0 | 14 | 0 |
| B | 0 | 14 | 0 |
| C | 0 | 14 | 0 |
| D | 0 | 15 | 0 |
| Quadrant | Total seconds | Saturated seconds | Saturation percentage |
|---|---|---|---|
| A | 6221 | 43 | 0.691207% |
| B | 6221 | 61 | 0.980550% |
| C | 6221 | 46 | 0.739431% |
| D | 6221 | 30 | 0.482238% |
Noise dominated data is calculated using 1-second bins in cleaned event files. If a bin has >2000 counts, and if more than 50% of those come from <1% of pixels, then it is considered to be noise-dominated and hence unusable.
| Quadrant | # 1 sec bins | Bins with >0 counts | Bins with >2000 counts | High rate bins dominated by noise | Noise dominated (total time) | Noise dominated (detector-on time) | Marked lightcurve |
|---|---|---|---|---|---|---|---|
| A | 7437 | 6224 | 0 | 0 | 0.00% | 0.00% |  |
| B | 7437 | 6224 | 11 | 11 | 0.15% | 0.18% | 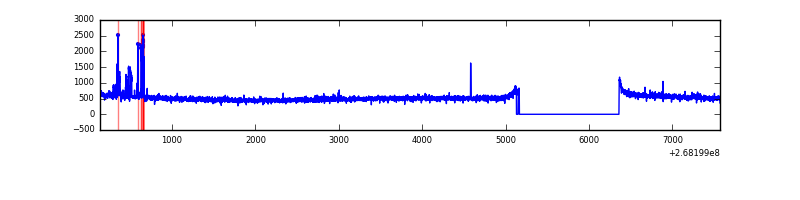 |
| C | 7437 | 6224 | 19 | 19 | 0.26% | 0.31% | 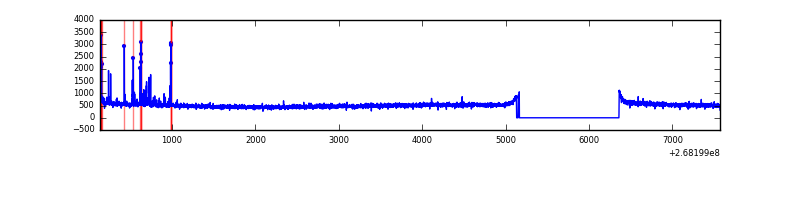 |
| D | 7437 | 6224 | 5 | 5 | 0.07% | 0.08% | 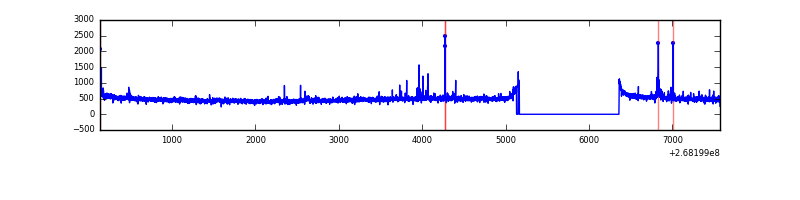 |
Top three noisy pixels from each quadrant. If the there are fewer than three noisy pixels in the level2.evt file, extra rows are filled as -1
| Pixel properties | Quadrant properties | ||||||
|---|---|---|---|---|---|---|---|
| Quadrant | DetID | PixID | Counts | Sigma | Mean | Median | Sigma |
| A | 0 | 226 | 7398 | 40.18 | 817 | 803 | 164.1 |
| A | 12 | 194 | 5783 | 30.34 | 817 | 803 | 164.1 |
| A | 12 | 189 | 5688 | 29.76 | 817 | 803 | 164.1 |
| B | 10 | 16 | 96593 | 620.73 | 810 | 793 | 154.3 |
| B | 12 | 111 | 18612 | 115.46 | 810 | 793 | 154.3 |
| B | 11 | 111 | 15783 | 97.13 | 810 | 793 | 154.3 |
| C | 3 | 233 | 126467 | 710.02 | 773 | 780 | 177.0 |
| C | 9 | 236 | 103619 | 580.95 | 773 | 780 | 177.0 |
| C | 13 | 61 | 5525 | 26.8 | 773 | 780 | 177.0 |
| D | 7 | 223 | 33199 | 175.41 | 776 | 758 | 184.9 |
| D | 4 | 95 | 32692 | 172.67 | 776 | 758 | 184.9 |
| D | 13 | 249 | 21678 | 113.11 | 776 | 758 | 184.9 |
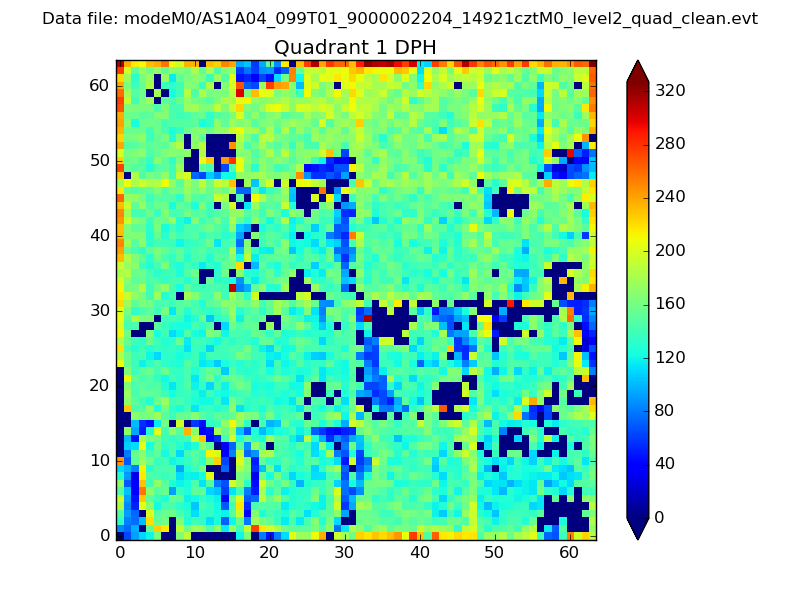
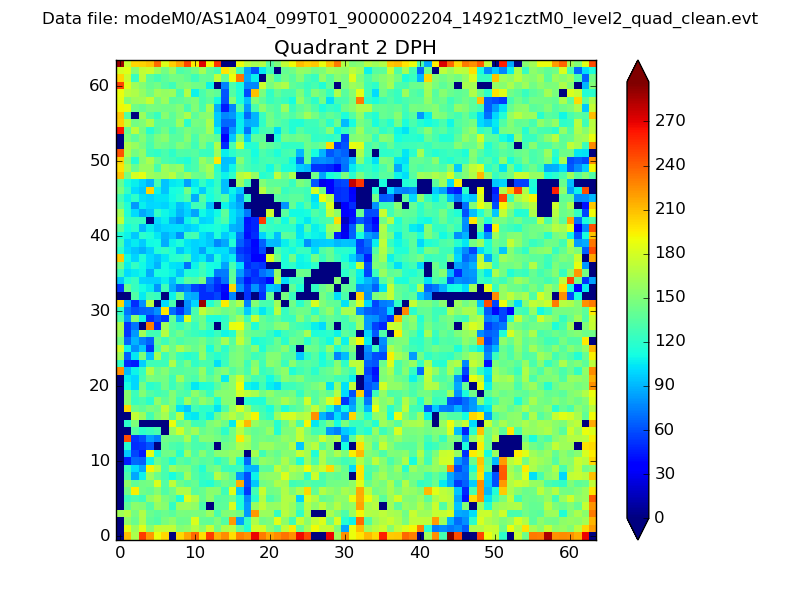
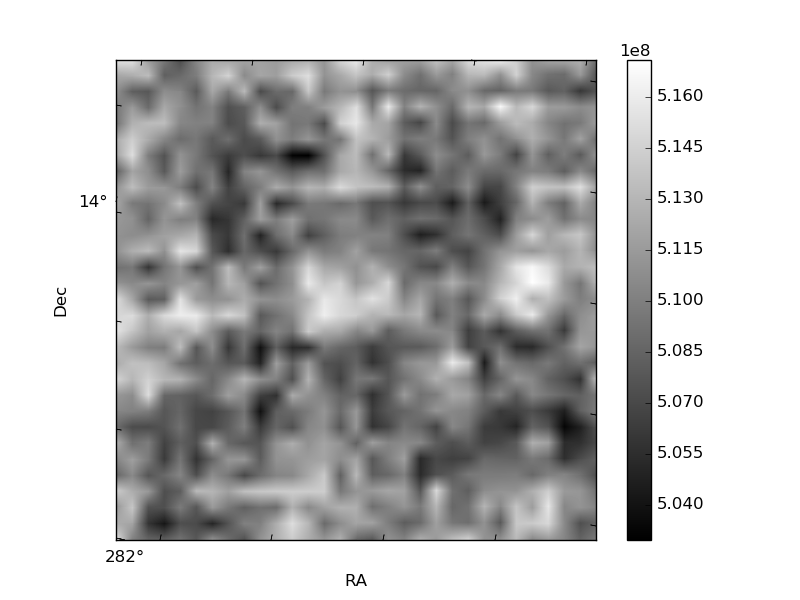
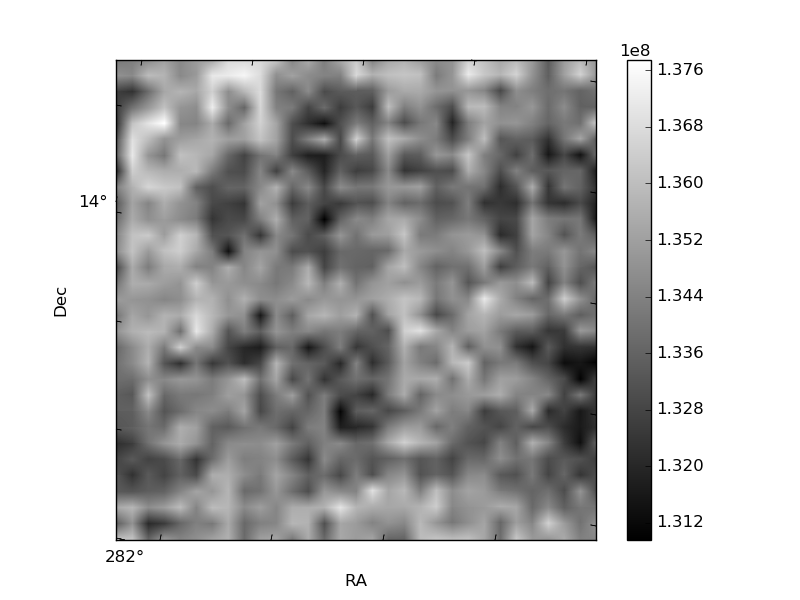
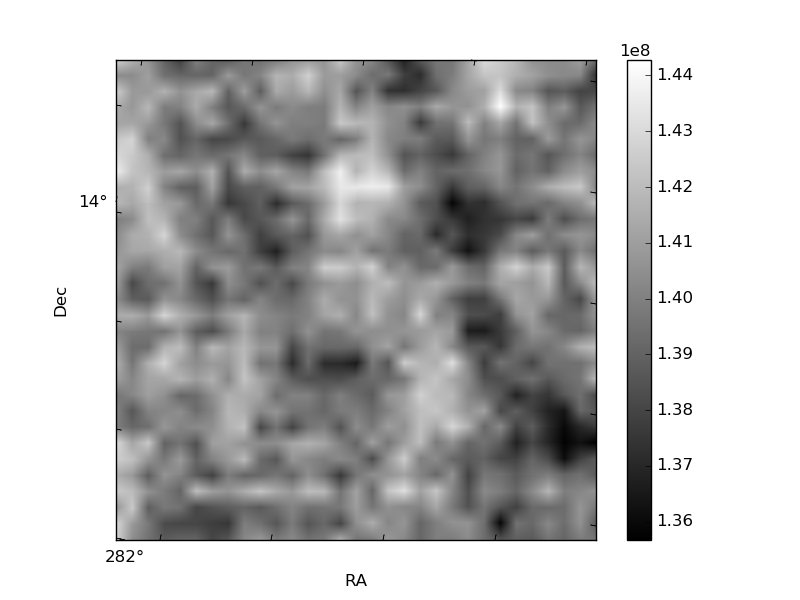
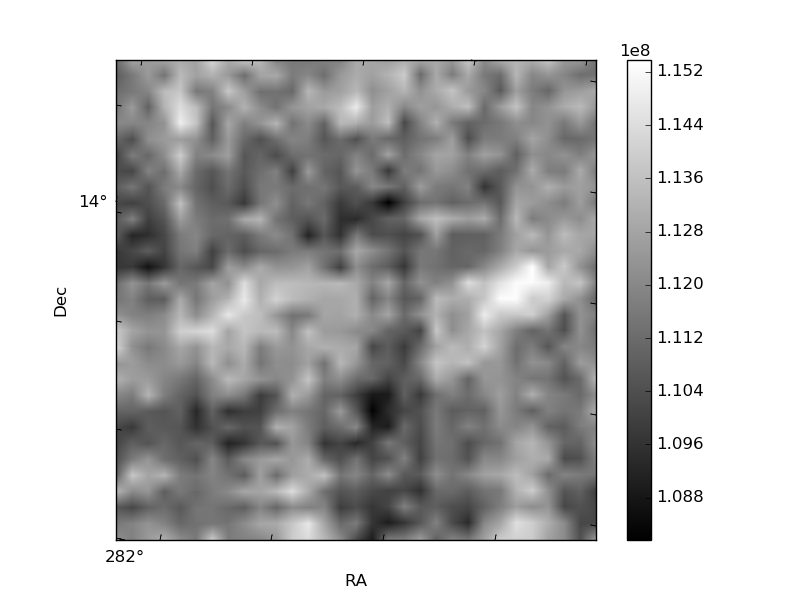
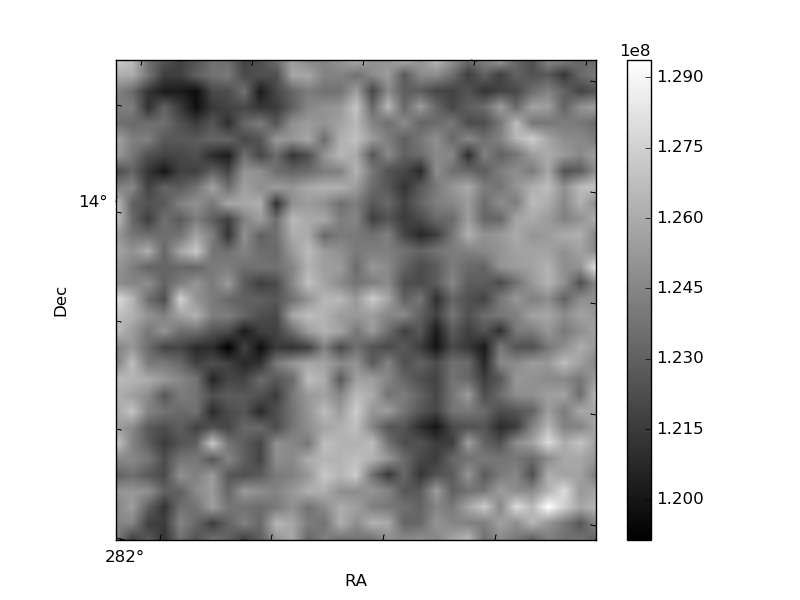
Histogram calculated using DETX and DETY for each event in the final _common_clean file
| Quadrant A | 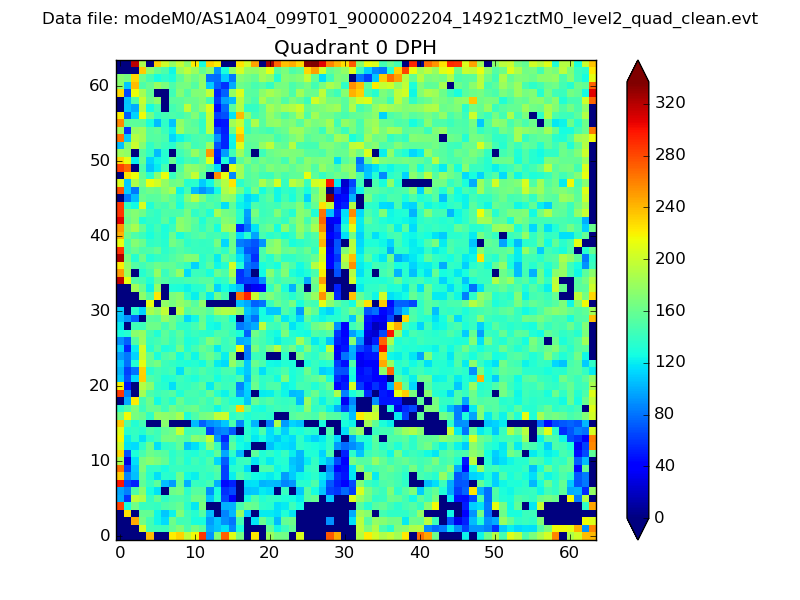 |
 |
Quadrant B |
|---|---|---|---|
| Quadrant D | 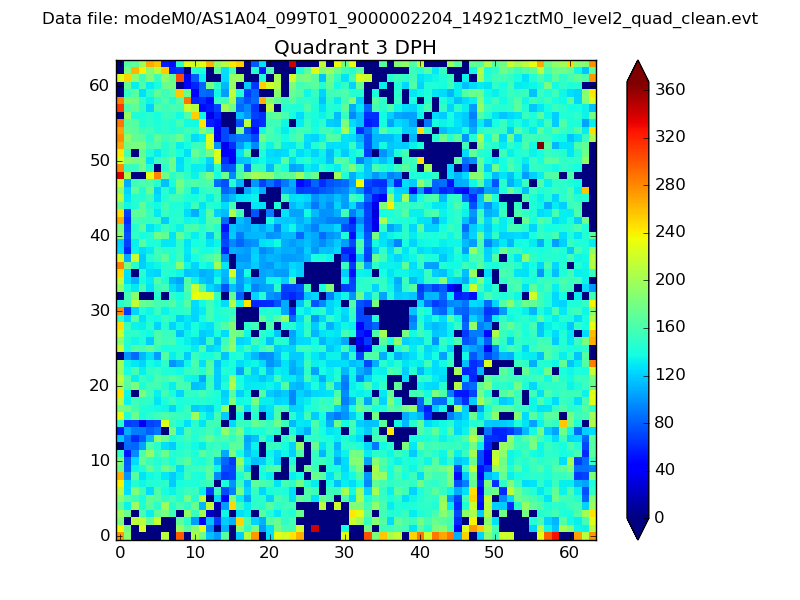 |
 |
Quadrant C |
| Plot type | Count rate plots | Images |
|---|---|---|
| Comparison with Poisson distribution Blue bars denote a histogram of data divided into 1 sec bins. Red curve is a Poisson curve with rate = median count rate of data. |
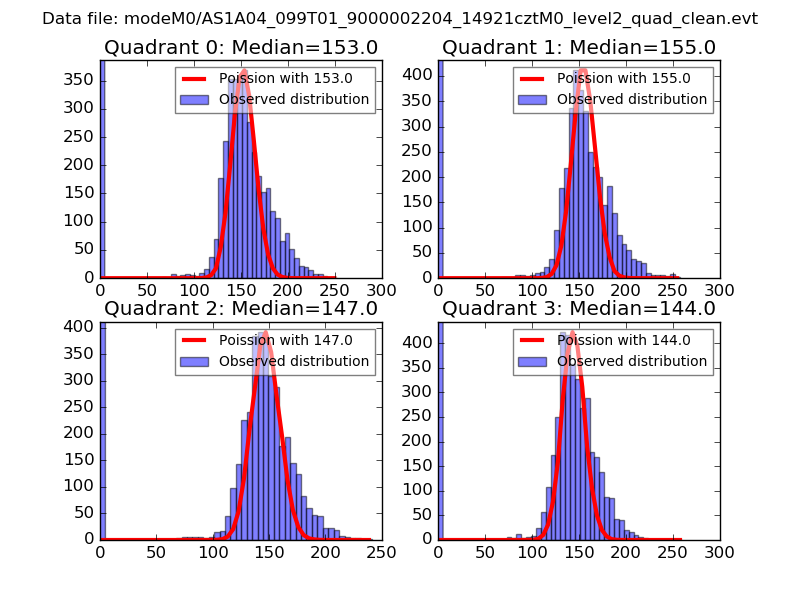 |
 |
| Quadrant-wise count rates Data is divided into 100 sec bins |
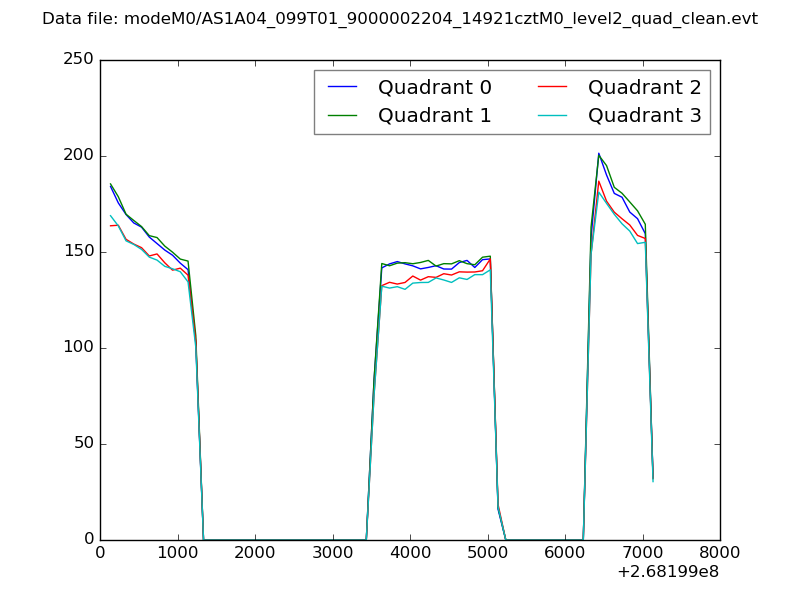 |
|
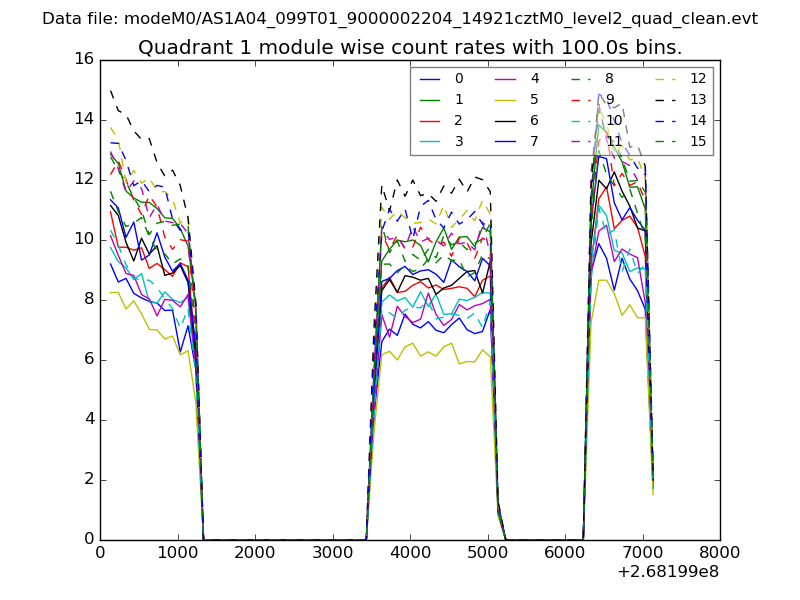
| Module-wise count rates for Quadrant A Data is divided into 100 sec bins |
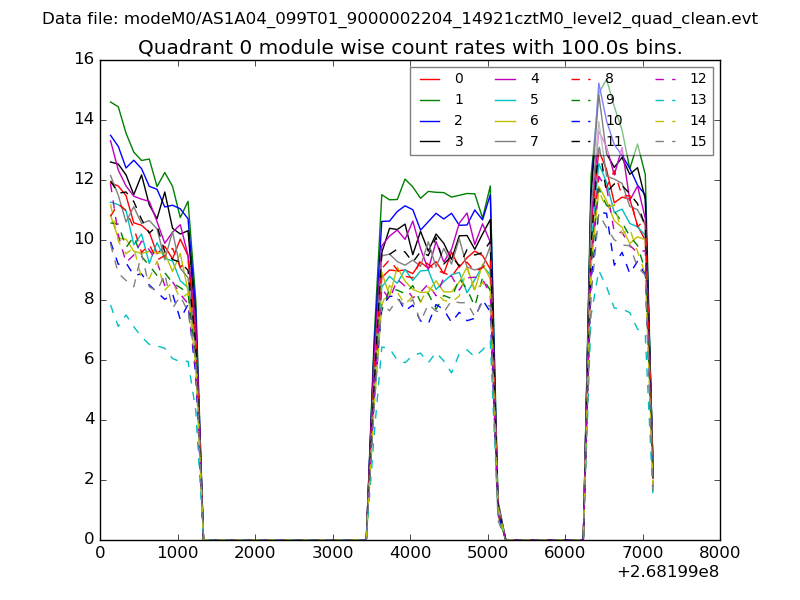 |
 |
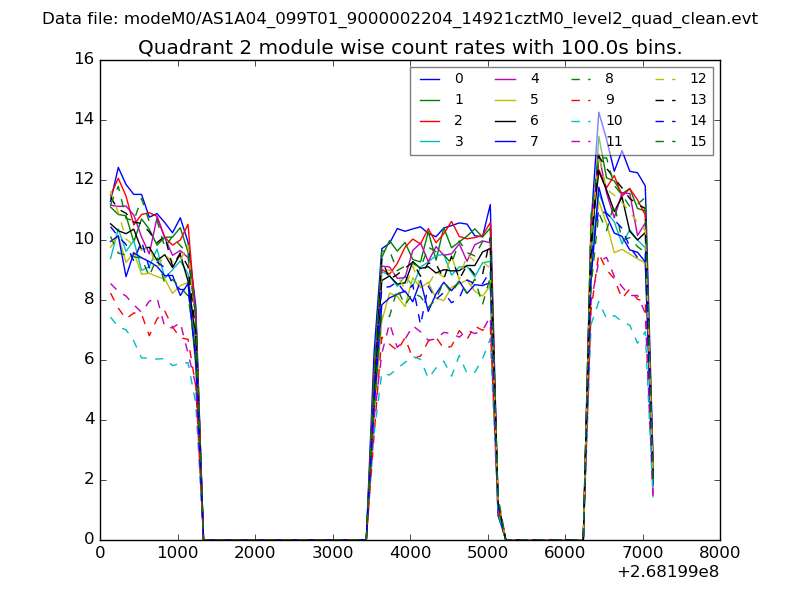
| Module-wise count rates for Quadrant B Data is divided into 100 sec bins |
 |
 |
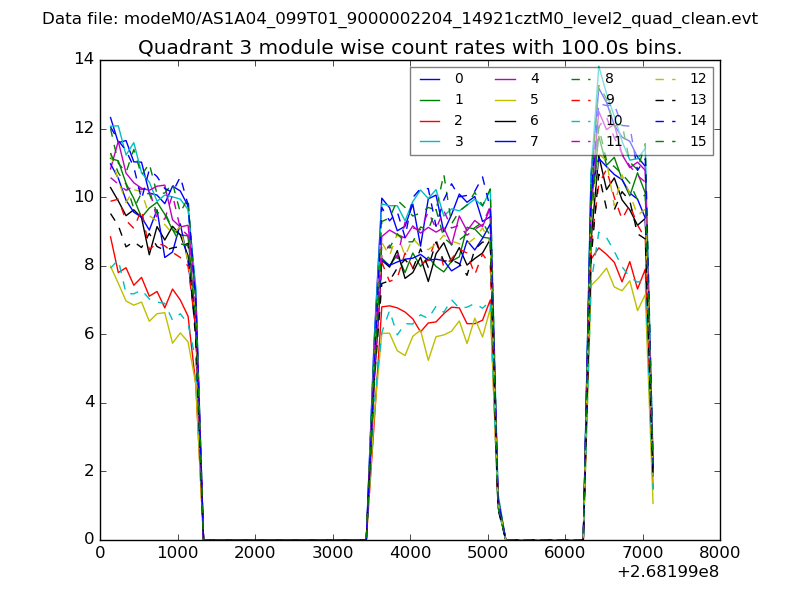
| Module-wise count rates for Quadrant C Data is divided into 100 sec bins |
 |
 |
| Module-wise count rates for Quadrant D Data is divided into 100 sec bins |
 |
 |
| Parameter | Plot |
|---|---|
| CZT HV Monitor | 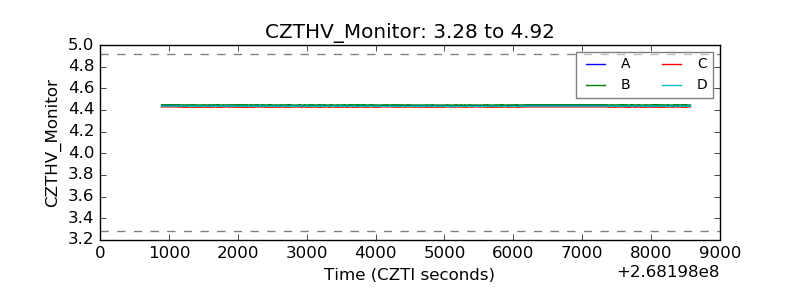 |
| D_VDD |  |
| Temperature 1 | 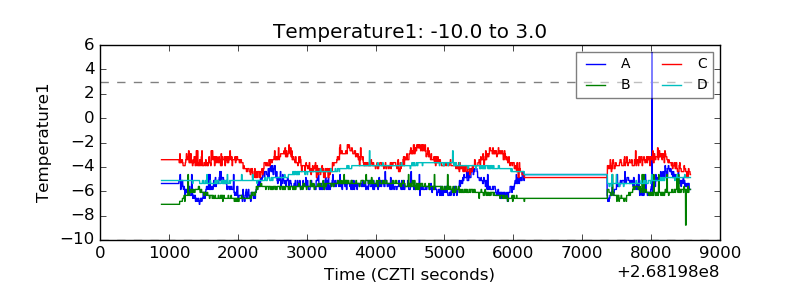 |
| Veto HV Monitor | 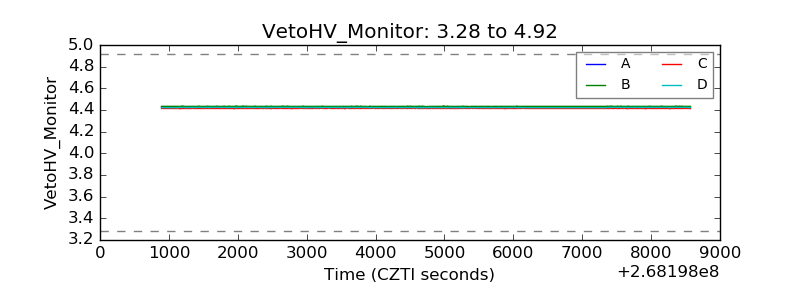 |
| Veto LLD | 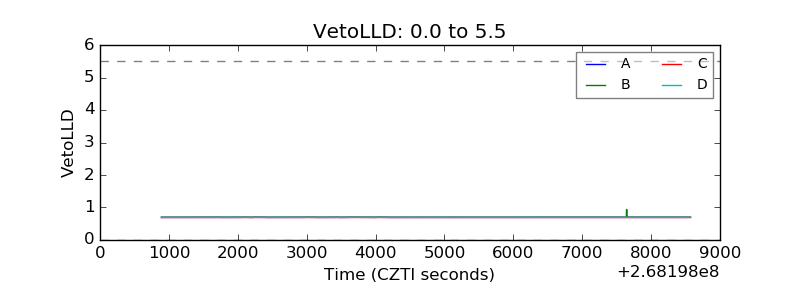 |
| Alpha Counter | 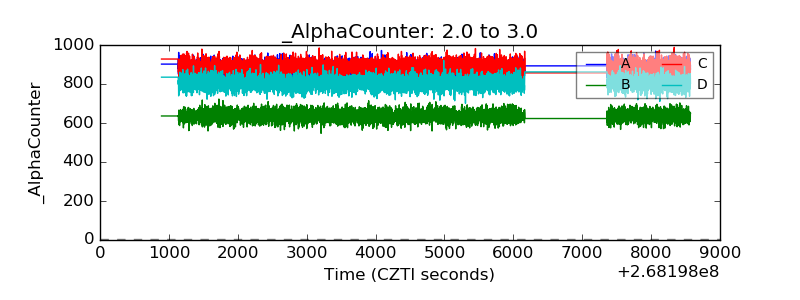 |
| _CPM_Rate | 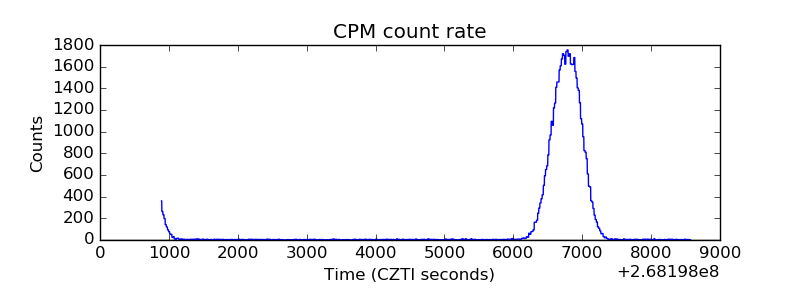 |
| CZT Counter | 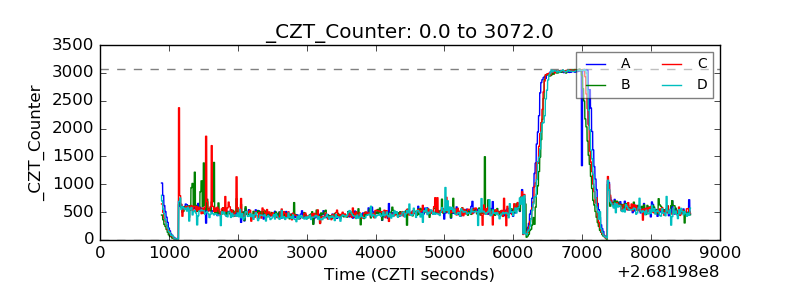 |
| +2.5 Volts monitor |  |
| +5 Volts monitor |  |
| _ROLL_ROT | 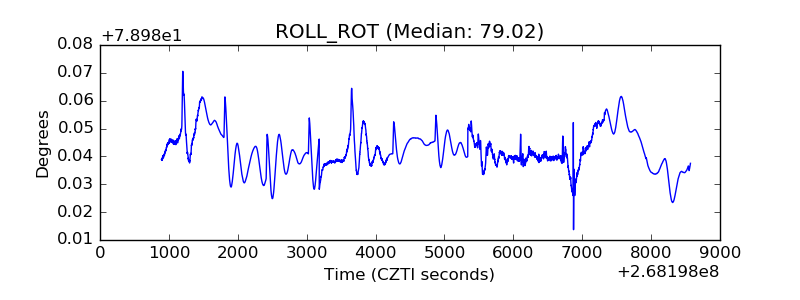 |
| _Roll_DEC | 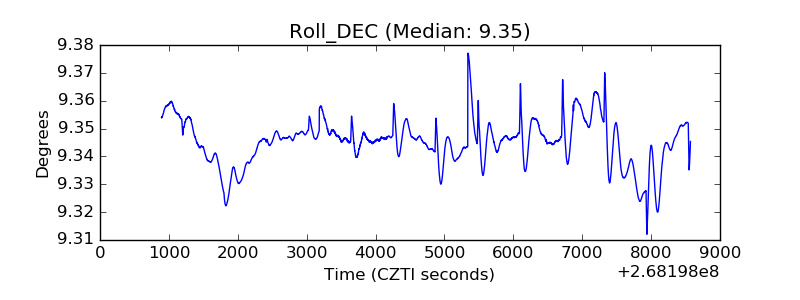 |
| _Roll_RA | 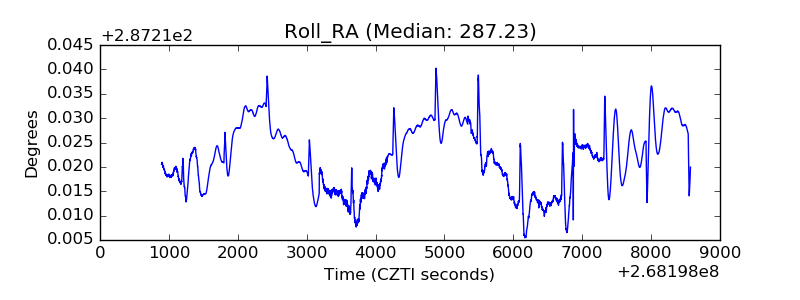 |
| Veto Counter | 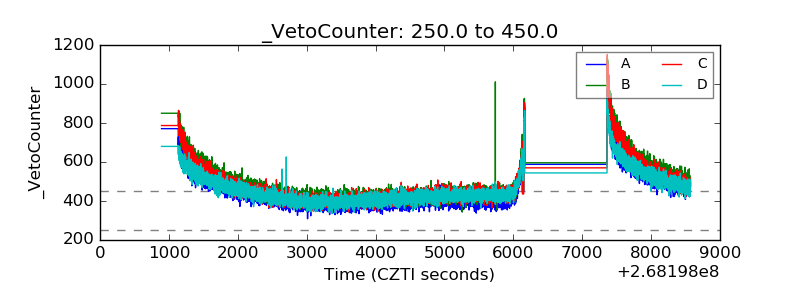 |