| Param | Original file | Final file |
|---|---|---|
| Filename | modeM0/AS1A04_099T01_9000002204_14922cztM0_level2.evt | modeM0/AS1A04_099T01_9000002204_14922cztM0_level2_quad_clean.evt |
| Size (bytes) | 445,458,240 | 78,793,920 |
| Size | 424.8 MB | 75.1 MB |
| Events in quadrant A | 3,288,841 | 500,116 |
| Events in quadrant B | 3,349,297 | 508,068 |
| Events in quadrant C | 3,266,065 | 478,305 |
| Events in quadrant D | 3,165,043 | 466,472 |
| Mode SS | |||
|---|---|---|---|
| Quadrant | BADHDUFLAG | Total packets | Discarded packets |
| A | 0 | 126 | 0 |
| B | 0 | 126 | 0 |
| C | 0 | 126 | 0 |
| D | 0 | 126 | 0 |
| Mode M0 | |||
|---|---|---|---|
| Quadrant | BADHDUFLAG | Total packets | Discarded packets |
| A | 0 | 13343 | 3 |
| B | 0 | 13528 | 2 |
| C | 0 | 13232 | 2 |
| D | 0 | 13188 | 2 |
| Mode M9 | |||
|---|---|---|---|
| Quadrant | BADHDUFLAG | Total packets | Discarded packets |
| A | 0 | 19 | 0 |
| B | 0 | 19 | 0 |
| C | 0 | 19 | 0 |
| D | 0 | 20 | 0 |
| Quadrant | Total seconds | Saturated seconds | Saturation percentage |
|---|---|---|---|
| A | 6205 | 83 | 1.337631% |
| B | 6205 | 78 | 1.257051% |
| C | 6205 | 49 | 0.789686% |
| D | 6205 | 64 | 1.031426% |
Noise dominated data is calculated using 1-second bins in cleaned event files. If a bin has >2000 counts, and if more than 50% of those come from <1% of pixels, then it is considered to be noise-dominated and hence unusable.
| Quadrant | # 1 sec bins | Bins with >0 counts | Bins with >2000 counts | High rate bins dominated by noise | Noise dominated (total time) | Noise dominated (detector-on time) | Marked lightcurve |
|---|---|---|---|---|---|---|---|
| A | 7486 | 6207 | 0 | 0 | 0.00% | 0.00% |  |
| B | 7486 | 6207 | 0 | 0 | 0.00% | 0.00% | 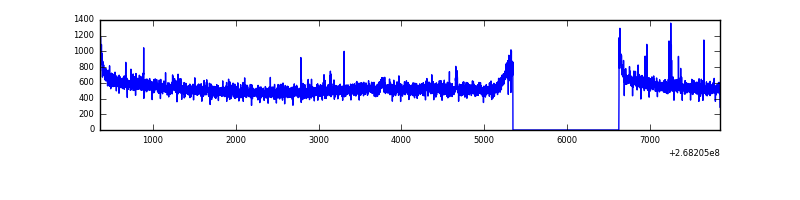 |
| C | 7486 | 6207 | 0 | 0 | 0.00% | 0.00% | 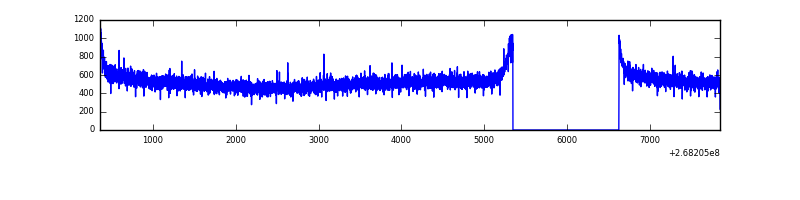 |
| D | 7486 | 6207 | 15 | 15 | 0.20% | 0.24% | 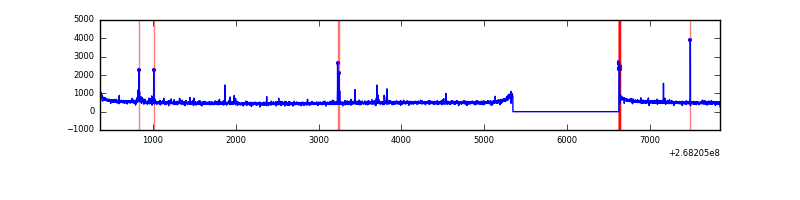 |
Top three noisy pixels from each quadrant. If the there are fewer than three noisy pixels in the level2.evt file, extra rows are filled as -1
| Pixel properties | Quadrant properties | ||||||
|---|---|---|---|---|---|---|---|
| Quadrant | DetID | PixID | Counts | Sigma | Mean | Median | Sigma |
| A | 12 | 189 | 8803 | 47.02 | 853 | 839 | 169.4 |
| A | 0 | 226 | 7722 | 40.64 | 853 | 839 | 169.4 |
| A | 3 | 1 | 6128 | 31.23 | 853 | 839 | 169.4 |
| B | 10 | 16 | 55034 | 338.61 | 842 | 824 | 160.1 |
| B | 12 | 111 | 18884 | 112.81 | 842 | 824 | 160.1 |
| B | 11 | 111 | 16246 | 96.33 | 842 | 824 | 160.1 |
| C | 3 | 233 | 118797 | 639.88 | 806 | 812 | 184.4 |
| C | 13 | 61 | 5815 | 27.13 | 806 | 812 | 184.4 |
| C | 10 | 22 | 5104 | 23.28 | 806 | 812 | 184.4 |
| D | 4 | 95 | 60752 | 311.68 | 807 | 789 | 192.4 |
| D | 7 | 223 | 24410 | 122.78 | 807 | 789 | 192.4 |
| D | 2 | 234 | 18597 | 92.56 | 807 | 789 | 192.4 |
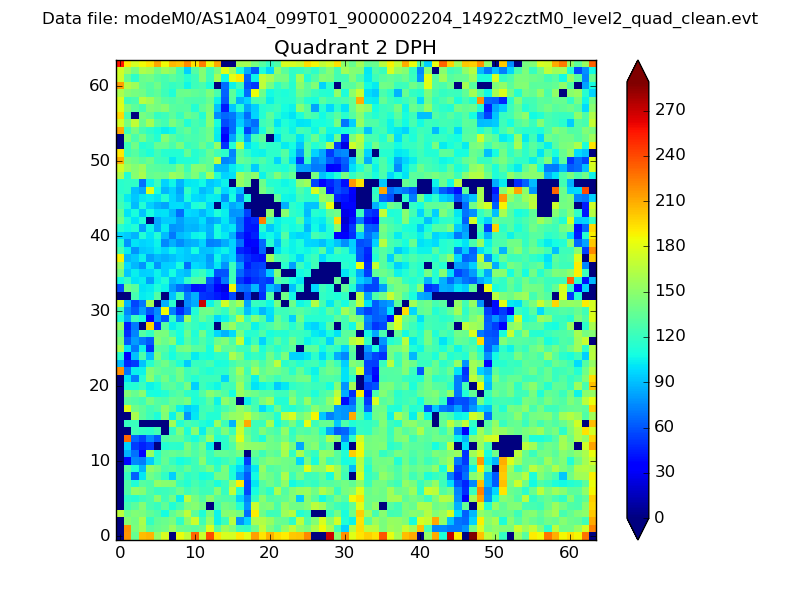
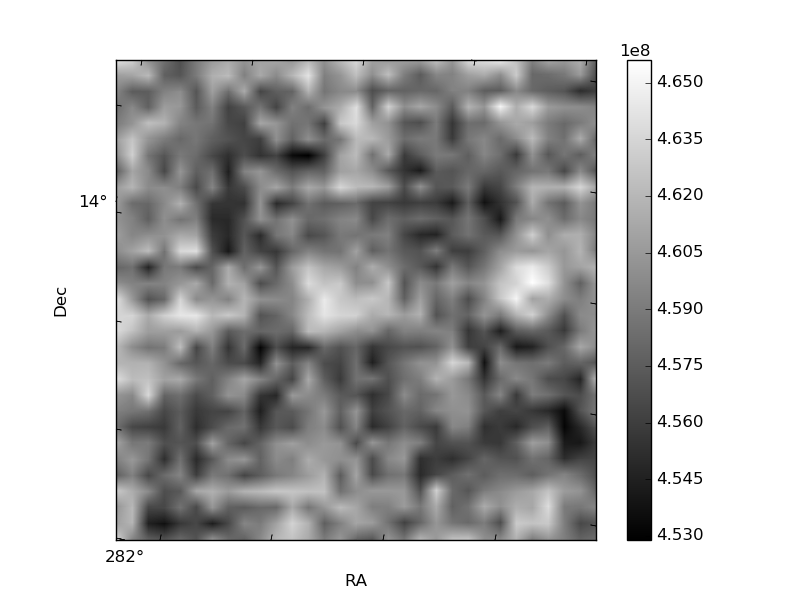
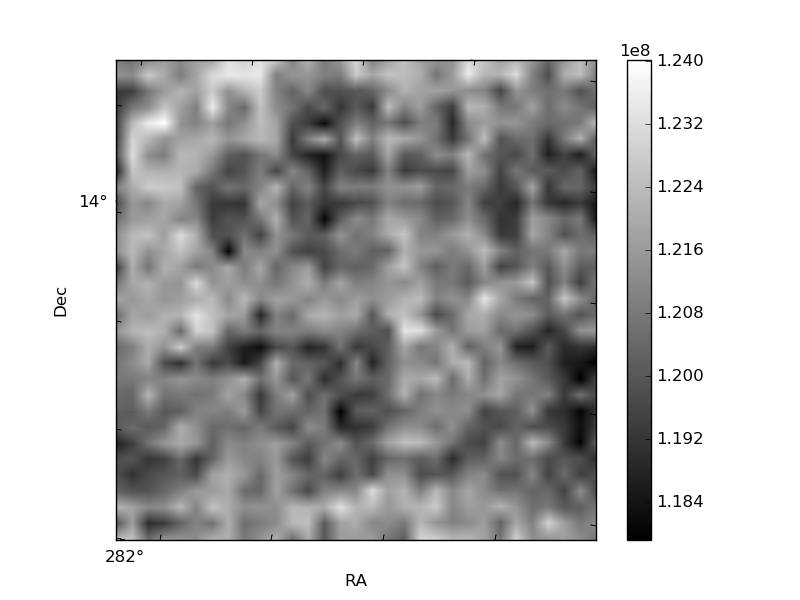
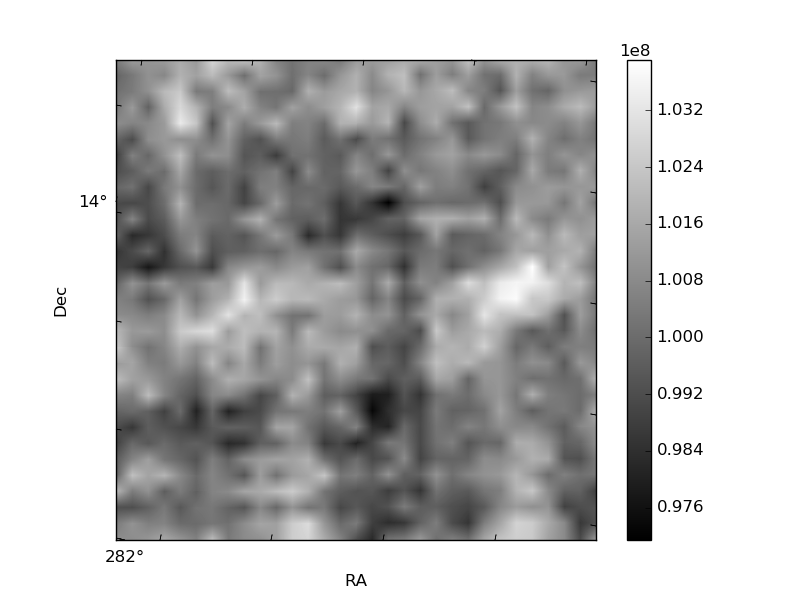
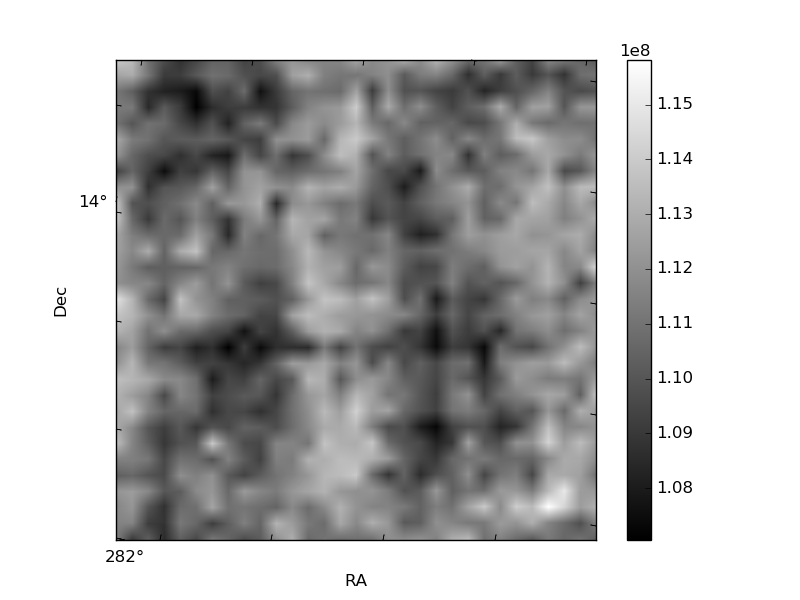
Histogram calculated using DETX and DETY for each event in the final _common_clean file
| Quadrant A | 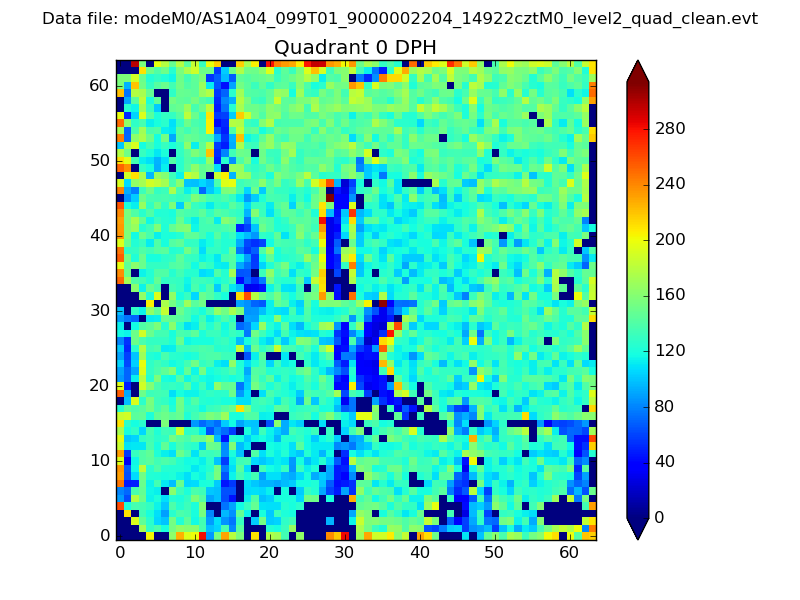 |
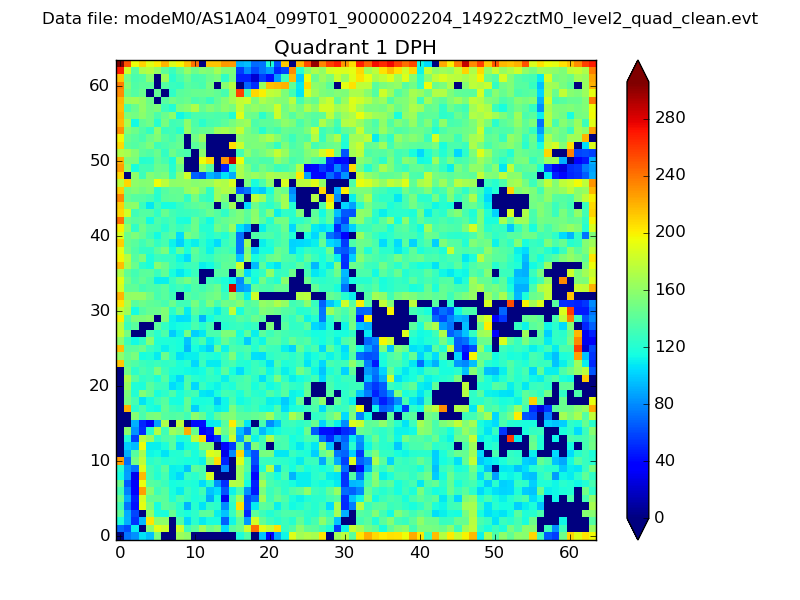 |
Quadrant B |
|---|---|---|---|
| Quadrant D | 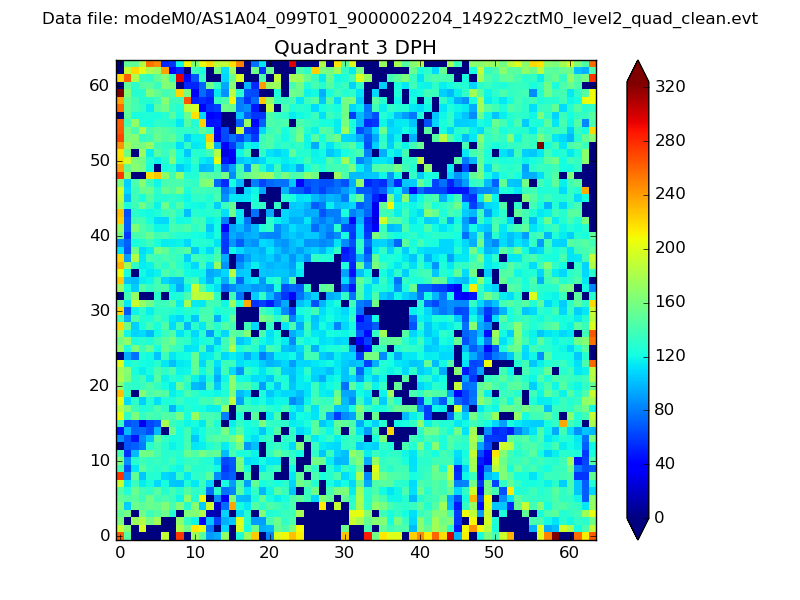 |
 |
Quadrant C |
| Plot type | Count rate plots | Images |
|---|---|---|
| Comparison with Poisson distribution Blue bars denote a histogram of data divided into 1 sec bins. Red curve is a Poisson curve with rate = median count rate of data. |
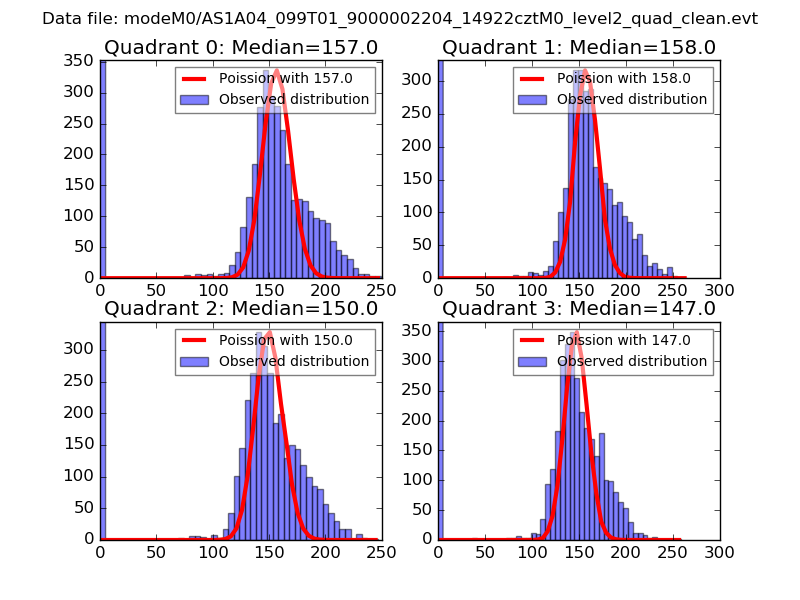 |
 |
| Quadrant-wise count rates Data is divided into 100 sec bins |
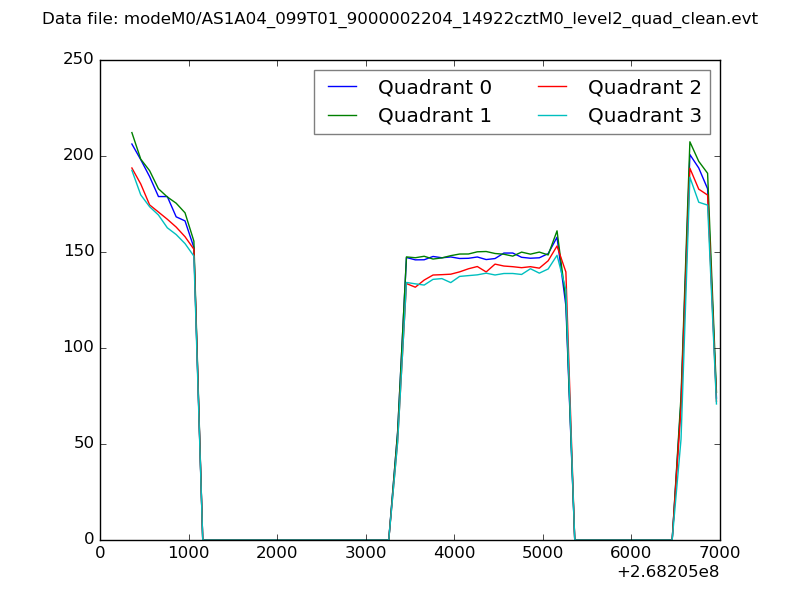 |
|
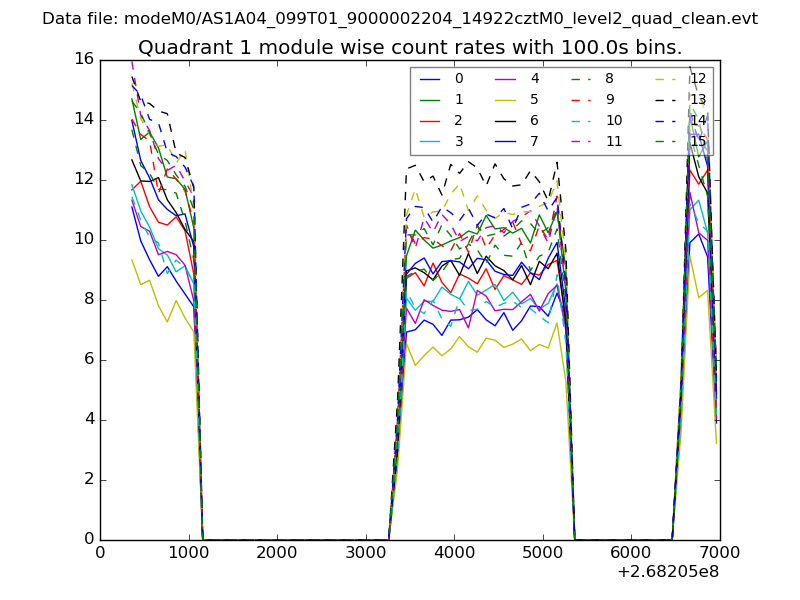
| Module-wise count rates for Quadrant A Data is divided into 100 sec bins |
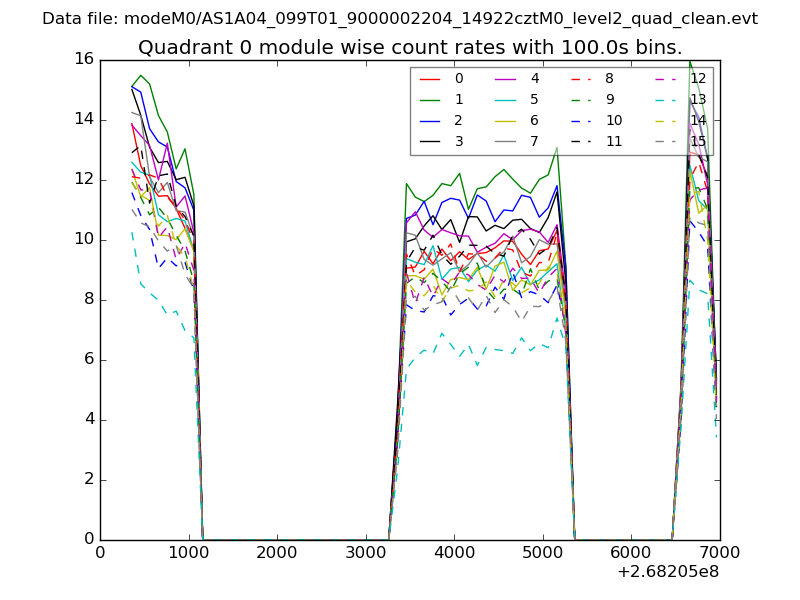 |
 |
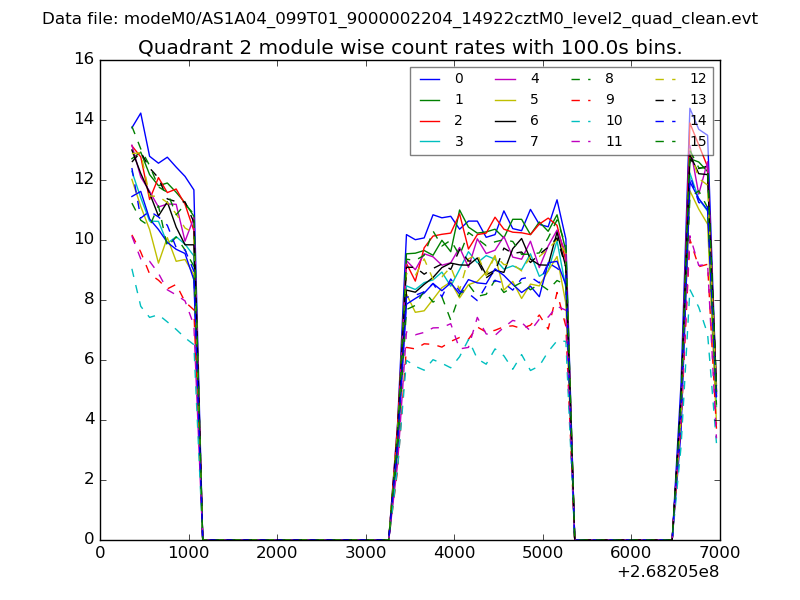
| Module-wise count rates for Quadrant B Data is divided into 100 sec bins |
 |
 |
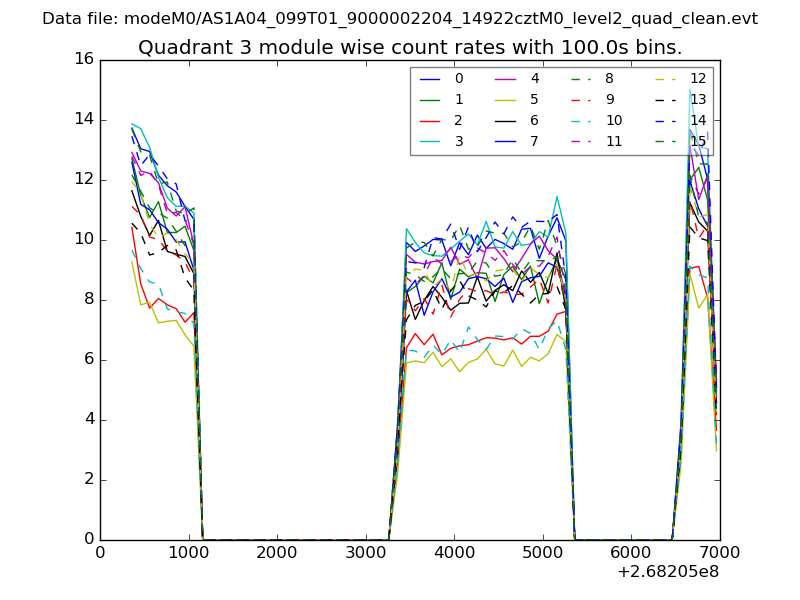
| Module-wise count rates for Quadrant C Data is divided into 100 sec bins |
 |
 |
| Module-wise count rates for Quadrant D Data is divided into 100 sec bins |
 |
 |
| Parameter | Plot |
|---|---|
| CZT HV Monitor | 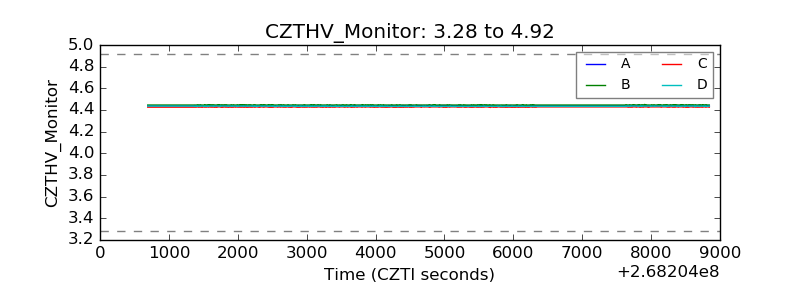 |
| D_VDD | 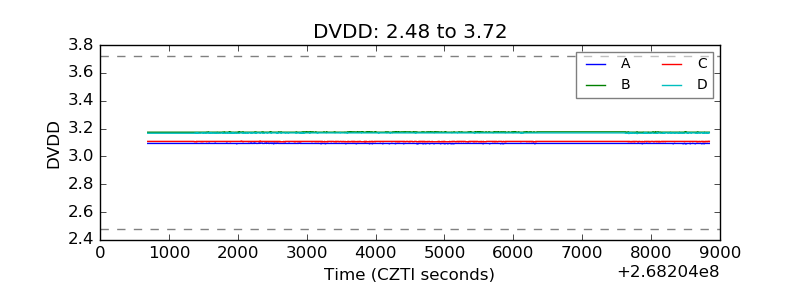 |
| Temperature 1 | 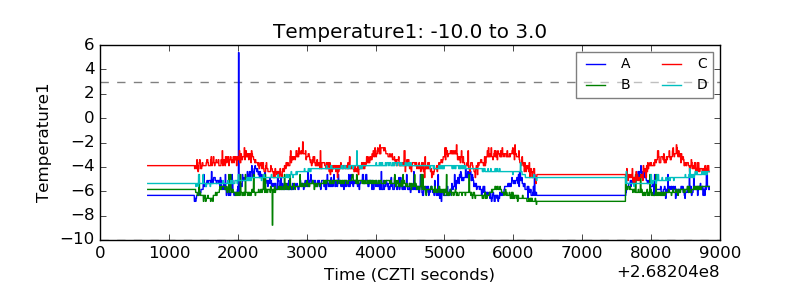 |
| Veto HV Monitor |  |
| Veto LLD | 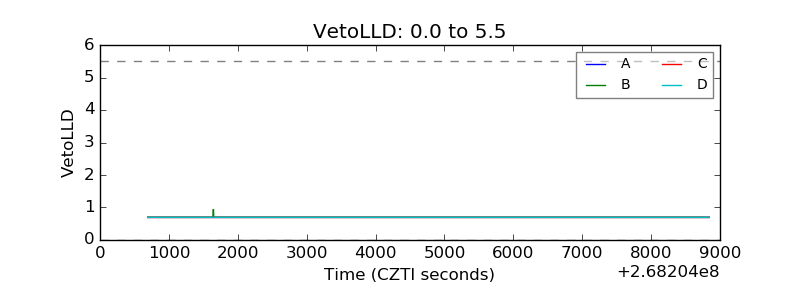 |
| Alpha Counter | 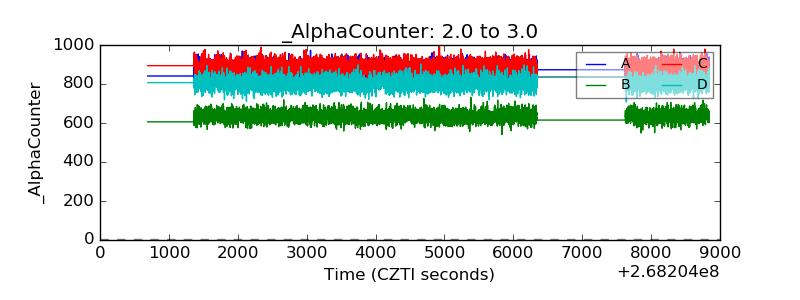 |
| _CPM_Rate | 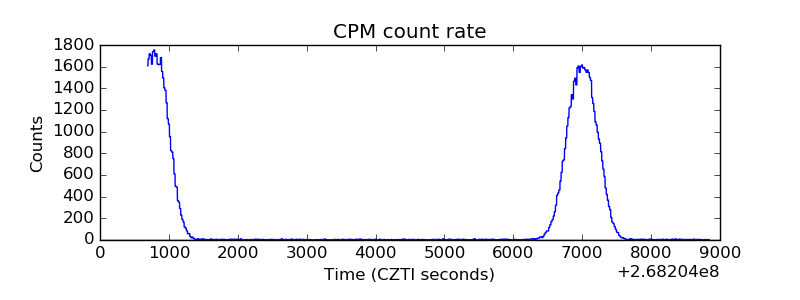 |
| CZT Counter | 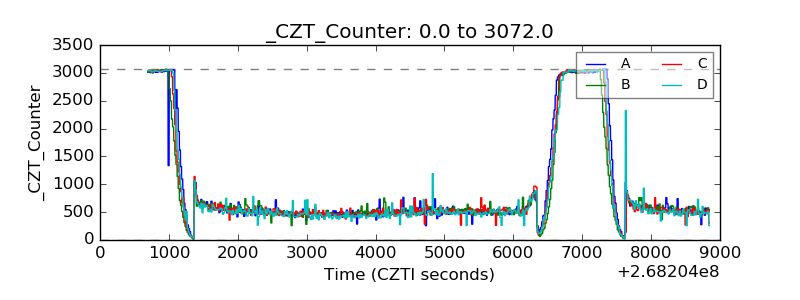 |
| +2.5 Volts monitor |  |
| +5 Volts monitor |  |
| _ROLL_ROT | 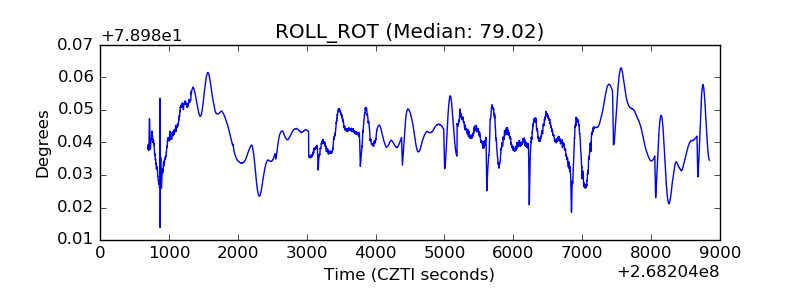 |
| _Roll_DEC | 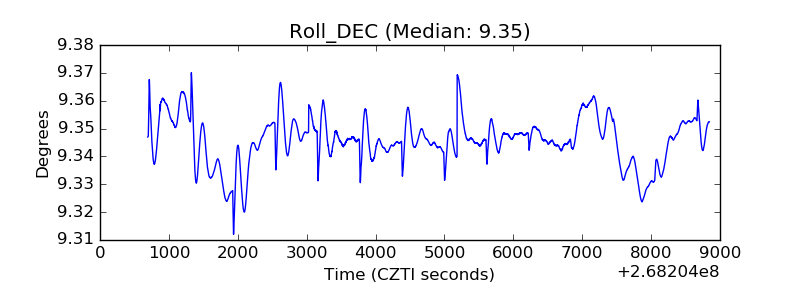 |
| _Roll_RA | 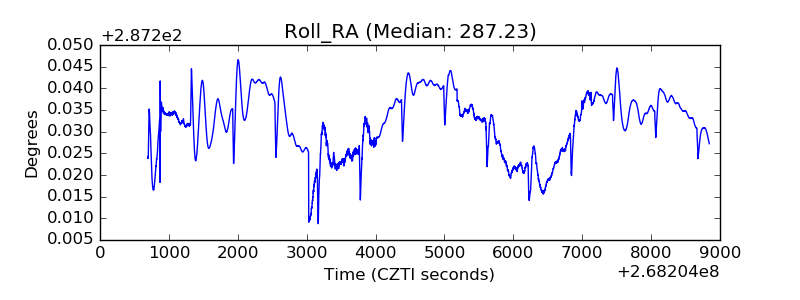 |
| Veto Counter | 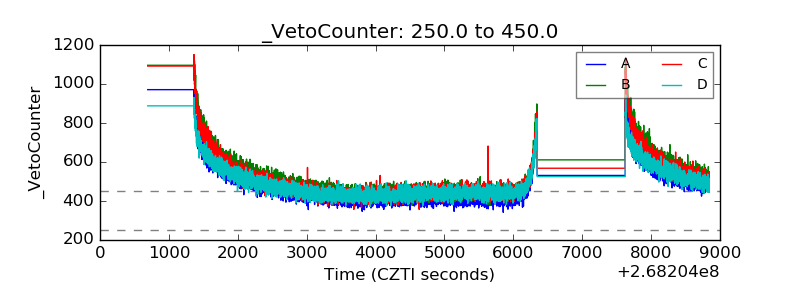 |