| Param | Original file | Final file |
|---|---|---|
| Filename | modeM0/AS1A04_099T01_9000002204_14924cztM0_level2.evt | modeM0/AS1A04_099T01_9000002204_14924cztM0_level2_quad_clean.evt |
| Size (bytes) | 522,109,440 | 66,222,720 |
| Size | 497.9 MB | 63.2 MB |
| Events in quadrant A | 3,245,523 | 406,571 |
| Events in quadrant B | 5,826,683 | 399,497 |
| Events in quadrant C | 3,254,995 | 388,435 |
| Events in quadrant D | 3,069,077 | 382,874 |
| Mode SS | |||
|---|---|---|---|
| Quadrant | BADHDUFLAG | Total packets | Discarded packets |
| A | 0 | 124 | 0 |
| B | 0 | 124 | 0 |
| C | 0 | 124 | 0 |
| D | 0 | 124 | 0 |
| Mode M0 | |||
|---|---|---|---|
| Quadrant | BADHDUFLAG | Total packets | Discarded packets |
| A | 0 | 13064 | 3 |
| B | 0 | 21131 | 2 |
| C | 0 | 13032 | 2 |
| D | 0 | 12884 | 2 |
| Mode M9 | |||
|---|---|---|---|
| Quadrant | BADHDUFLAG | Total packets | Discarded packets |
| A | 0 | 18 | 0 |
| B | 0 | 18 | 0 |
| C | 0 | 18 | 0 |
| D | 0 | 19 | 0 |
| Quadrant | Total seconds | Saturated seconds | Saturation percentage |
|---|---|---|---|
| A | 6127 | 105 | 1.713726% |
| B | 6127 | 1218 | 19.879223% |
| C | 6127 | 80 | 1.305696% |
| D | 6127 | 71 | 1.158805% |
Noise dominated data is calculated using 1-second bins in cleaned event files. If a bin has >2000 counts, and if more than 50% of those come from <1% of pixels, then it is considered to be noise-dominated and hence unusable.
| Quadrant | # 1 sec bins | Bins with >0 counts | Bins with >2000 counts | High rate bins dominated by noise | Noise dominated (total time) | Noise dominated (detector-on time) | Marked lightcurve |
|---|---|---|---|---|---|---|---|
| A | 7368 | 6129 | 0 | 0 | 0.00% | 0.00% |  |
| B | 7368 | 6129 | 899 | 899 | 12.20% | 14.67% |  |
| C | 7368 | 6129 | 0 | 0 | 0.00% | 0.00% | 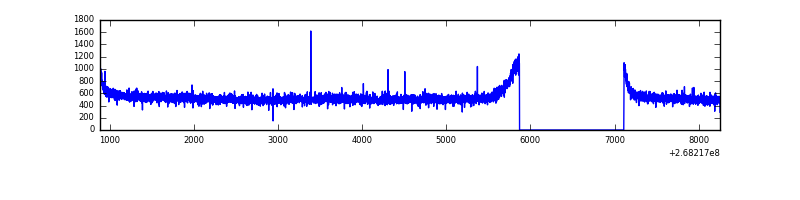 |
| D | 7368 | 6129 | 2 | 2 | 0.03% | 0.03% | 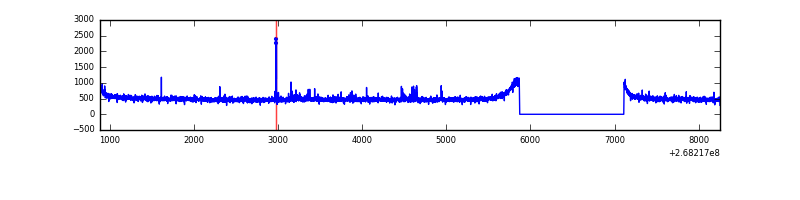 |
Top three noisy pixels from each quadrant. If the there are fewer than three noisy pixels in the level2.evt file, extra rows are filled as -1
| Pixel properties | Quadrant properties | ||||||
|---|---|---|---|---|---|---|---|
| Quadrant | DetID | PixID | Counts | Sigma | Mean | Median | Sigma |
| A | 12 | 189 | 34828 | 203.98 | 836 | 822 | 166.7 |
| A | 0 | 226 | 7437 | 39.68 | 836 | 822 | 166.7 |
| A | 12 | 194 | 5957 | 30.8 | 836 | 822 | 166.7 |
| B | 10 | 16 | 2977394 | 21625.2 | 722 | 704 | 137.6 |
| B | 0 | 229 | 23507 | 165.66 | 722 | 704 | 137.6 |
| B | 12 | 111 | 16461 | 114.47 | 722 | 704 | 137.6 |
| C | 3 | 233 | 151873 | 827.03 | 795 | 804 | 182.7 |
| C | 13 | 61 | 5717 | 26.9 | 795 | 804 | 182.7 |
| C | 10 | 22 | 4157 | 18.36 | 795 | 804 | 182.7 |
| D | 13 | 104 | 22371 | 114.03 | 799 | 781 | 189.3 |
| D | 2 | 234 | 20293 | 103.06 | 799 | 781 | 189.3 |
| D | 13 | 249 | 14346 | 71.65 | 799 | 781 | 189.3 |
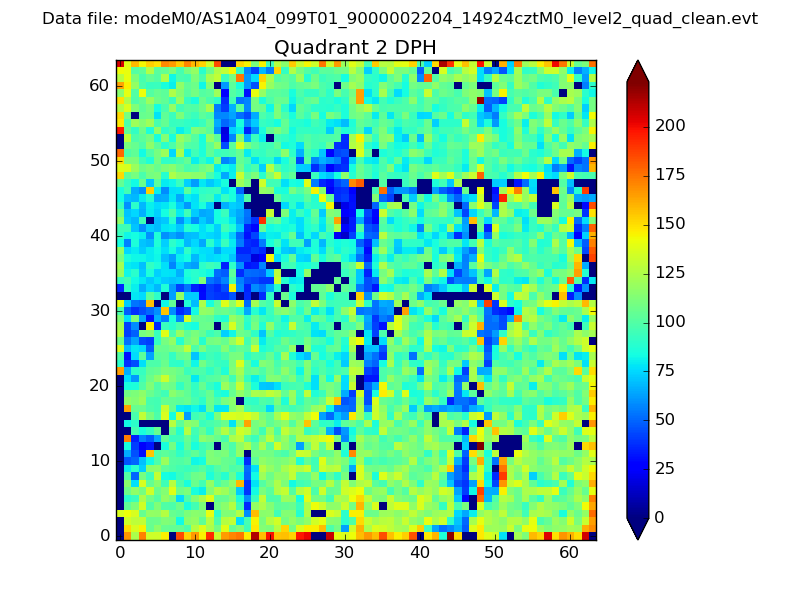
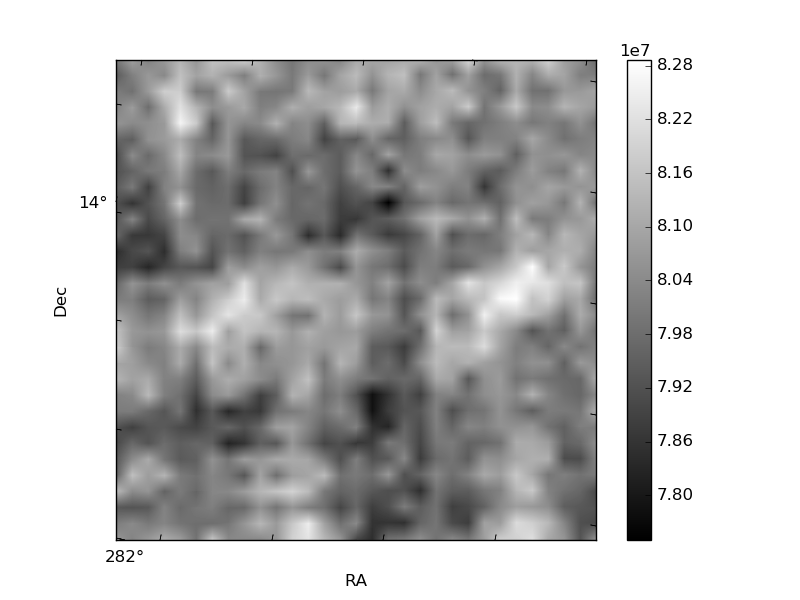
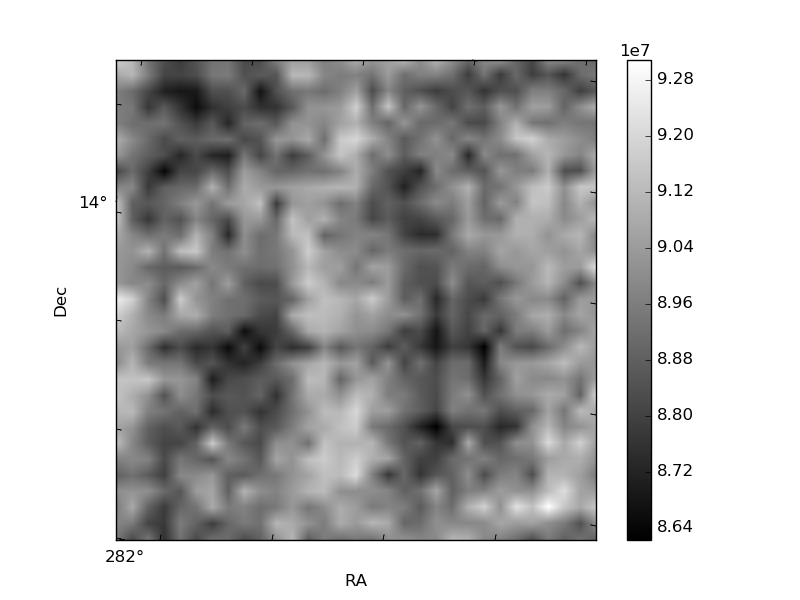
Histogram calculated using DETX and DETY for each event in the final _common_clean file
| Quadrant A | 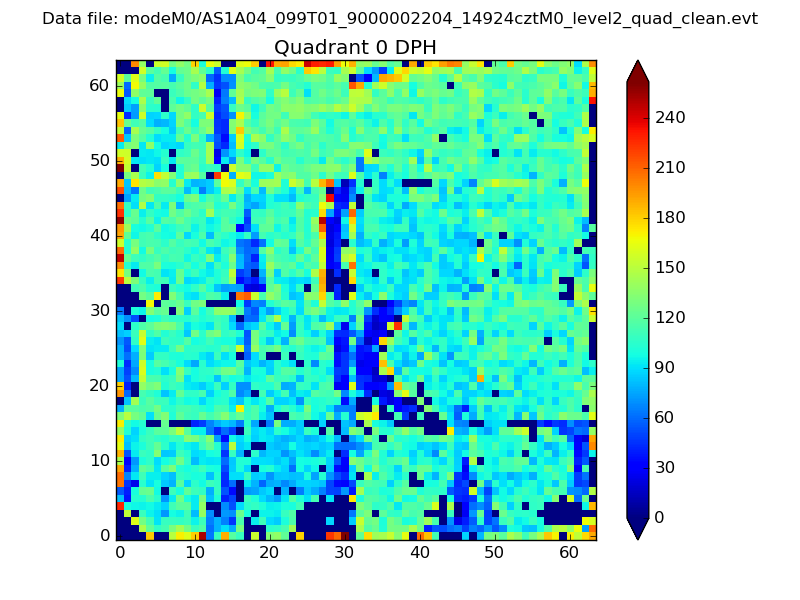 |
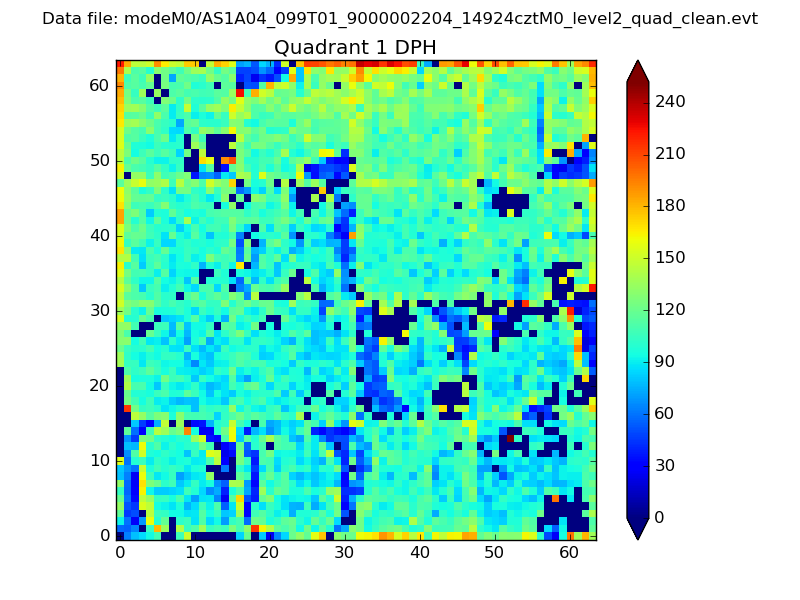 |
Quadrant B |
|---|---|---|---|
| Quadrant D | 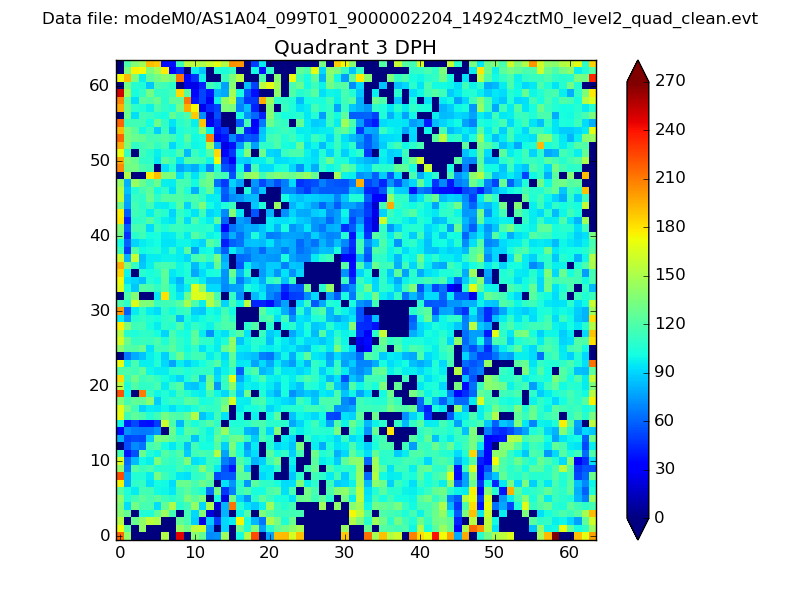 |
 |
Quadrant C |
| Plot type | Count rate plots | Images |
|---|---|---|
| Comparison with Poisson distribution Blue bars denote a histogram of data divided into 1 sec bins. Red curve is a Poisson curve with rate = median count rate of data. |
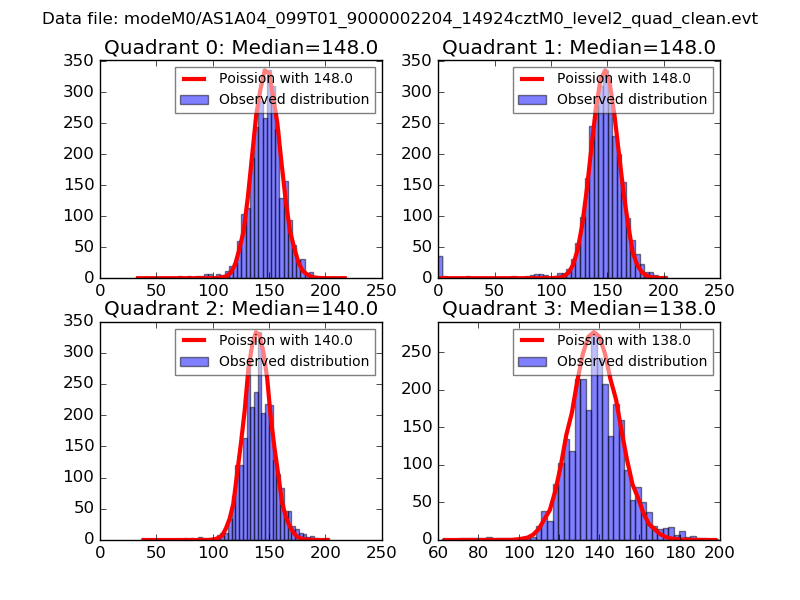 |
 |
| Quadrant-wise count rates Data is divided into 100 sec bins |
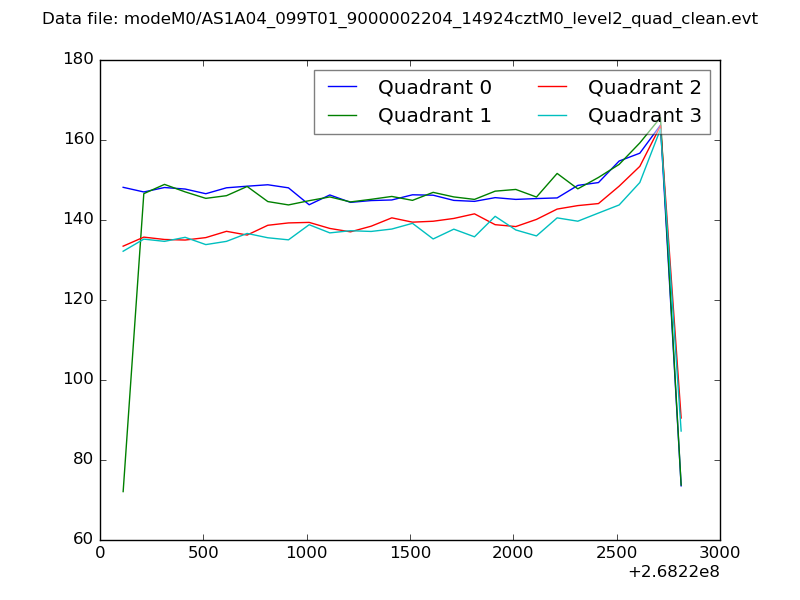 |
|
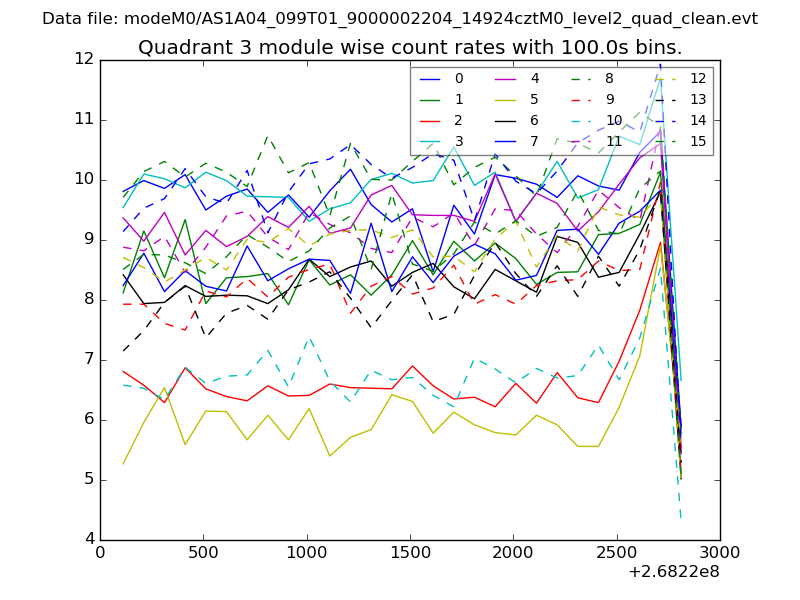
| Module-wise count rates for Quadrant A Data is divided into 100 sec bins |
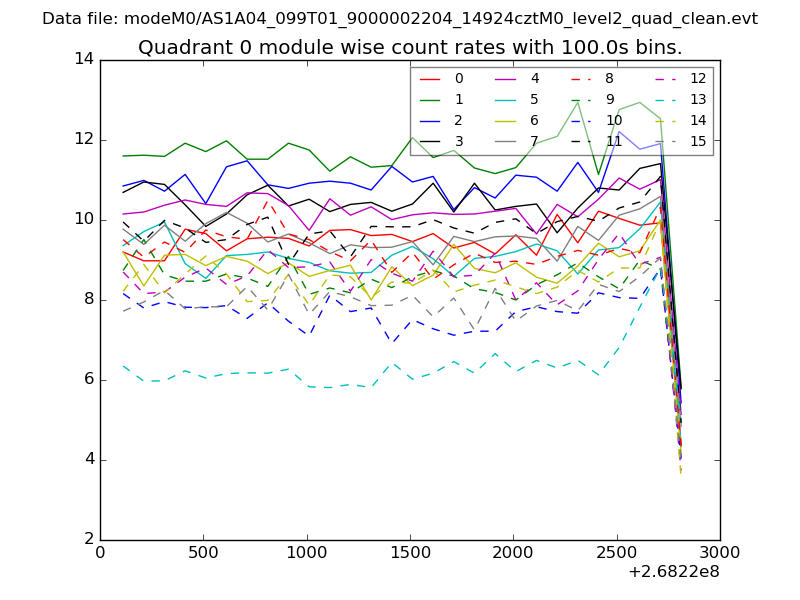 |
 |
| Module-wise count rates for Quadrant B Data is divided into 100 sec bins |
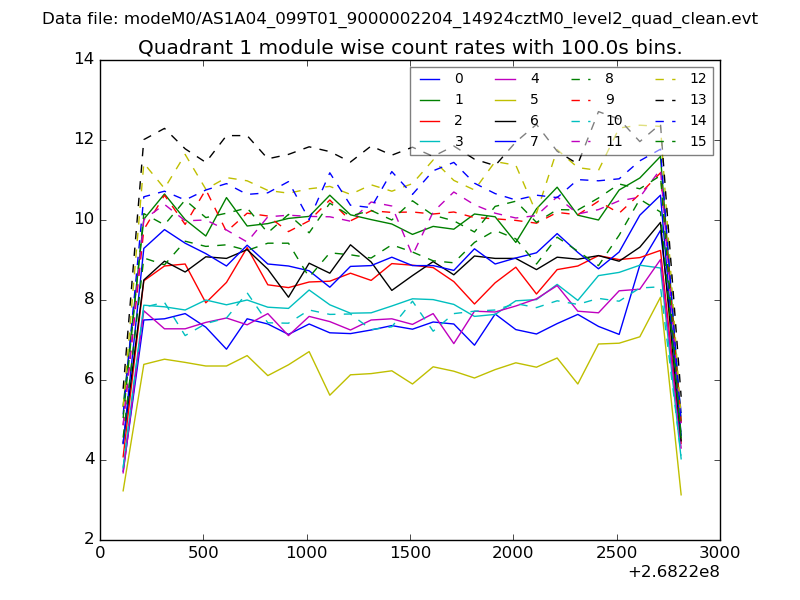 |
 |
| Module-wise count rates for Quadrant C Data is divided into 100 sec bins |
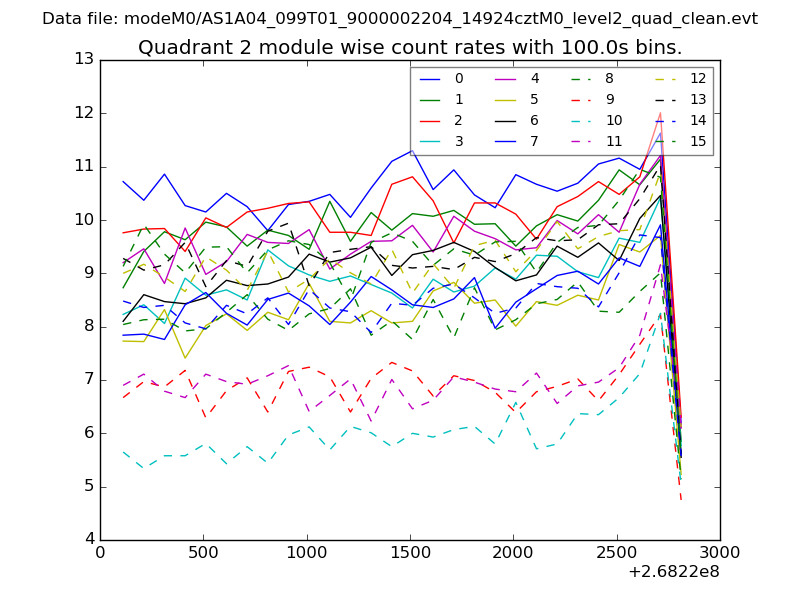 |
 |
| Module-wise count rates for Quadrant D Data is divided into 100 sec bins |
 |
 |
| Parameter | Plot |
|---|---|
| CZT HV Monitor | 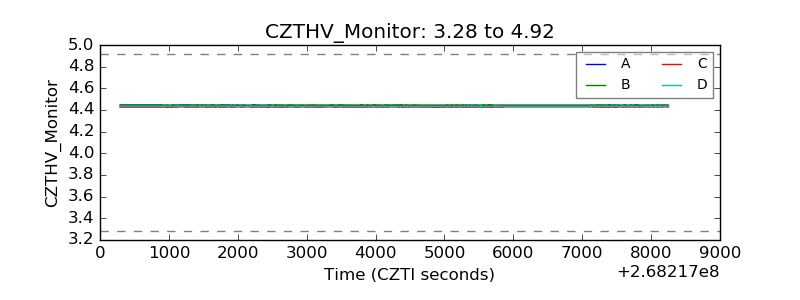 |
| D_VDD | 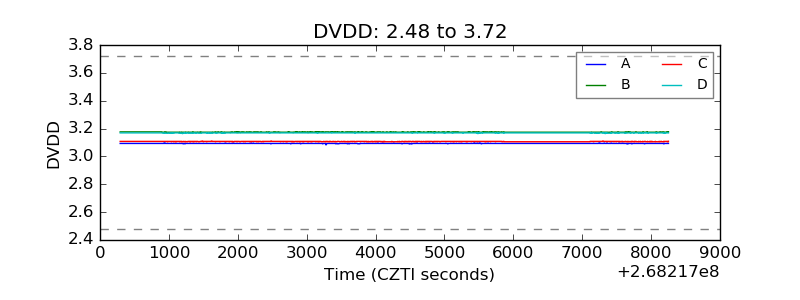 |
| Temperature 1 | 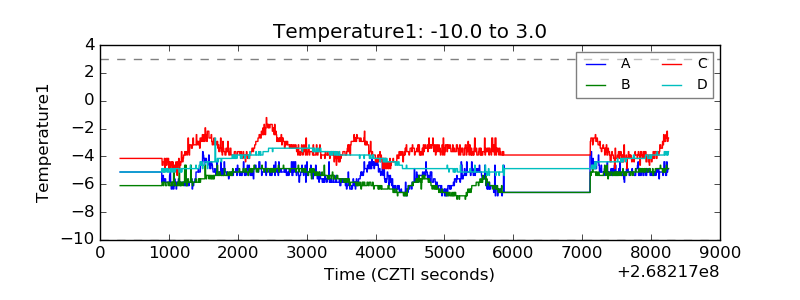 |
| Veto HV Monitor | 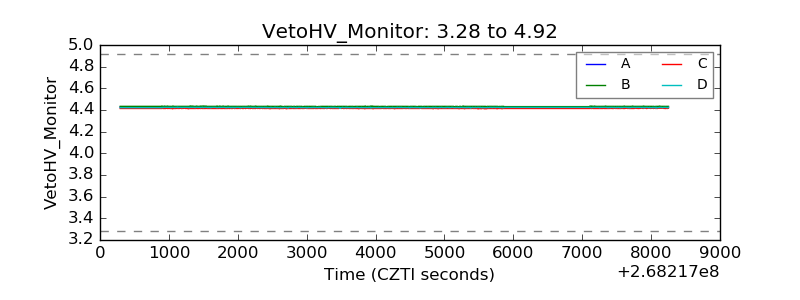 |
| Veto LLD | 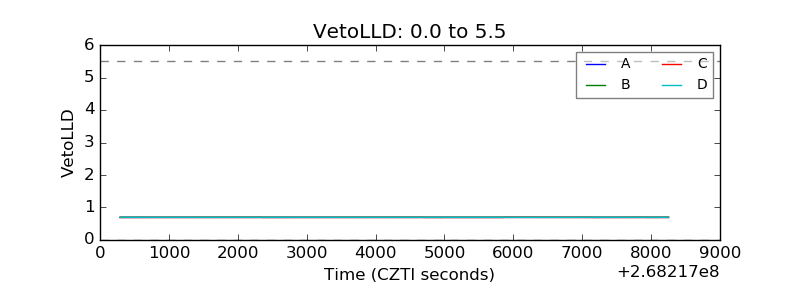 |
| Alpha Counter | 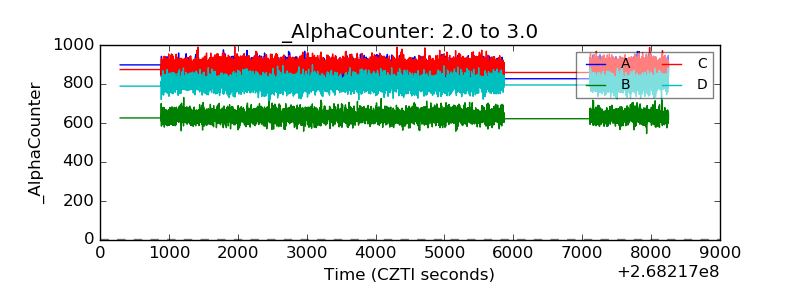 |
| _CPM_Rate | 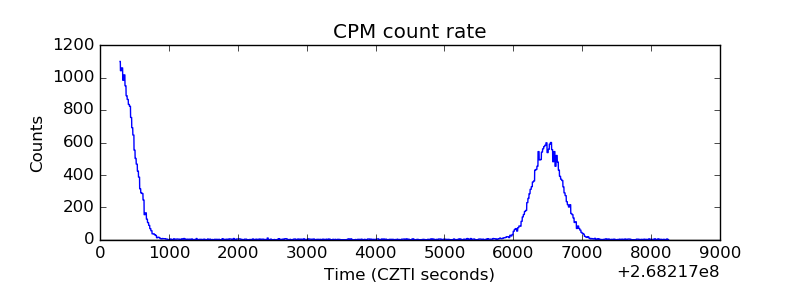 |
| CZT Counter | 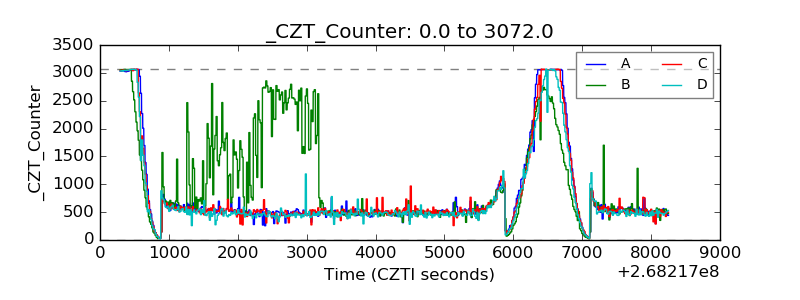 |
| +2.5 Volts monitor |  |
| +5 Volts monitor |  |
| _ROLL_ROT | 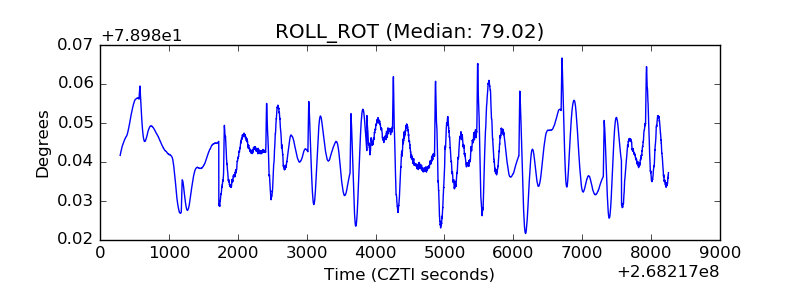 |
| _Roll_DEC | 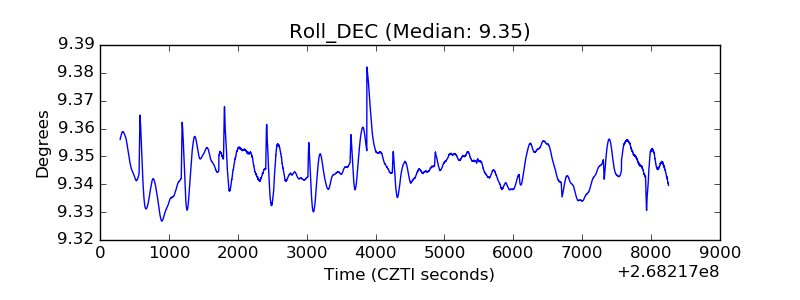 |
| _Roll_RA | 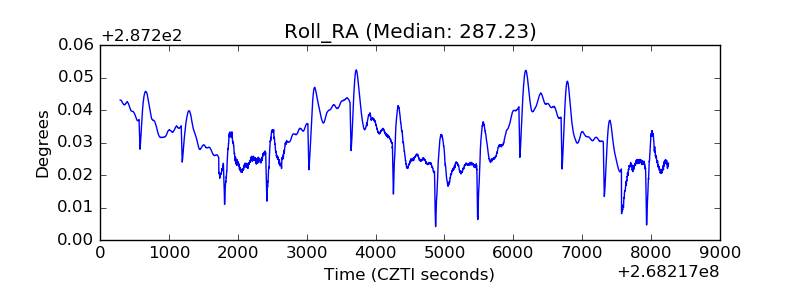 |
| Veto Counter | 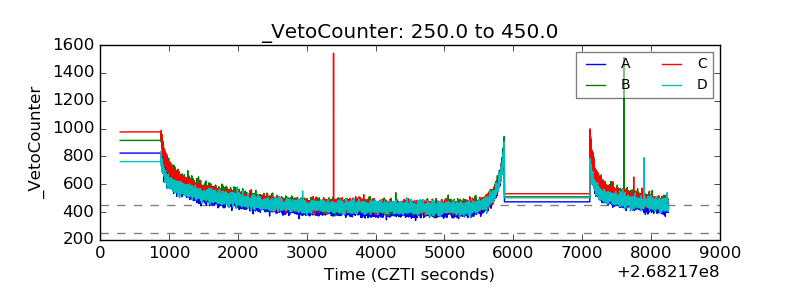 |