| Param | Original file | Final file |
|---|---|---|
| Filename | modeM0/AS1A04_099T01_9000002204_14925cztM0_level2.evt | modeM0/AS1A04_099T01_9000002204_14925cztM0_level2_quad_clean.evt |
| Size (bytes) | 459,449,280 | 77,080,320 |
| Size | 438.2 MB | 73.5 MB |
| Events in quadrant A | 3,392,196 | 479,915 |
| Events in quadrant B | 3,446,646 | 480,822 |
| Events in quadrant C | 3,404,215 | 460,196 |
| Events in quadrant D | 3,225,028 | 455,081 |
| Mode SS | |||
|---|---|---|---|
| Quadrant | BADHDUFLAG | Total packets | Discarded packets |
| A | 0 | 134 | 0 |
| B | 0 | 134 | 0 |
| C | 0 | 134 | 0 |
| D | 0 | 134 | 0 |
| Mode M0 | |||
|---|---|---|---|
| Quadrant | BADHDUFLAG | Total packets | Discarded packets |
| A | 0 | 13884 | 3 |
| B | 0 | 14092 | 2 |
| C | 0 | 13842 | 2 |
| D | 0 | 13837 | 2 |
| Mode M9 | |||
|---|---|---|---|
| Quadrant | BADHDUFLAG | Total packets | Discarded packets |
| A | 0 | 23 | 0 |
| B | 0 | 23 | 0 |
| C | 0 | 23 | 0 |
| D | 0 | 23 | 0 |
| Quadrant | Total seconds | Saturated seconds | Saturation percentage |
|---|---|---|---|
| A | 6570 | 152 | 2.313546% |
| B | 6570 | 188 | 2.861492% |
| C | 6570 | 135 | 2.054795% |
| D | 6570 | 132 | 2.009132% |
Noise dominated data is calculated using 1-second bins in cleaned event files. If a bin has >2000 counts, and if more than 50% of those come from <1% of pixels, then it is considered to be noise-dominated and hence unusable.
| Quadrant | # 1 sec bins | Bins with >0 counts | Bins with >2000 counts | High rate bins dominated by noise | Noise dominated (total time) | Noise dominated (detector-on time) | Marked lightcurve |
|---|---|---|---|---|---|---|---|
| A | 8796 | 6573 | 0 | 0 | 0.00% | 0.00% | 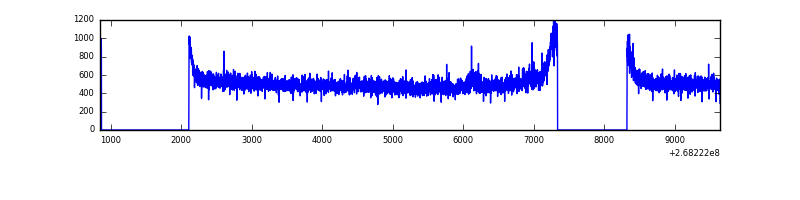 |
| B | 8796 | 6573 | 4 | 4 | 0.05% | 0.06% |  |
| C | 8796 | 6573 | 0 | 0 | 0.00% | 0.00% | 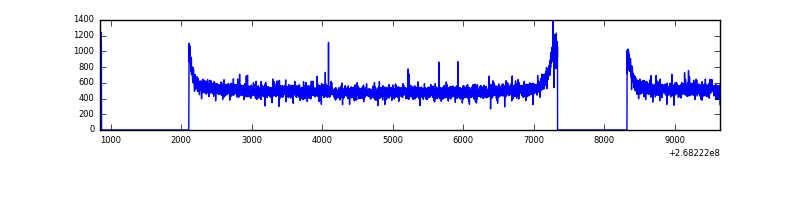 |
| D | 8796 | 6573 | 11 | 11 | 0.13% | 0.17% | 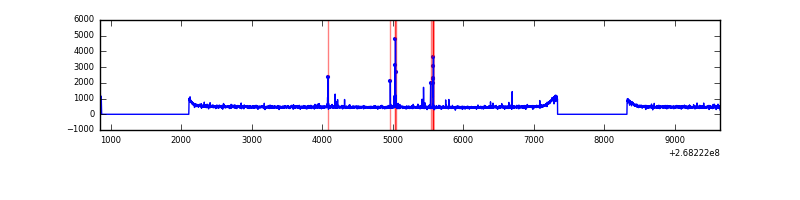 |
Top three noisy pixels from each quadrant. If the there are fewer than three noisy pixels in the level2.evt file, extra rows are filled as -1
| Pixel properties | Quadrant properties | ||||||
|---|---|---|---|---|---|---|---|
| Quadrant | DetID | PixID | Counts | Sigma | Mean | Median | Sigma |
| A | 12 | 189 | 50544 | 286.47 | 867 | 851 | 173.5 |
| A | 0 | 226 | 7636 | 39.11 | 867 | 851 | 173.5 |
| A | 12 | 194 | 6312 | 31.48 | 867 | 851 | 173.5 |
| B | 0 | 229 | 48865 | 291.89 | 854 | 833 | 164.6 |
| B | 0 | 85 | 23361 | 136.9 | 854 | 833 | 164.6 |
| B | 4 | 80 | 21533 | 125.79 | 854 | 833 | 164.6 |
| C | 3 | 233 | 142728 | 735.75 | 830 | 837 | 192.9 |
| C | 7 | 247 | 21172 | 105.44 | 830 | 837 | 192.9 |
| C | 13 | 61 | 5881 | 26.15 | 830 | 837 | 192.9 |
| D | 13 | 249 | 51695 | 255.98 | 834 | 814 | 198.8 |
| D | 13 | 104 | 23060 | 111.92 | 834 | 814 | 198.8 |
| D | 2 | 234 | 20942 | 101.26 | 834 | 814 | 198.8 |
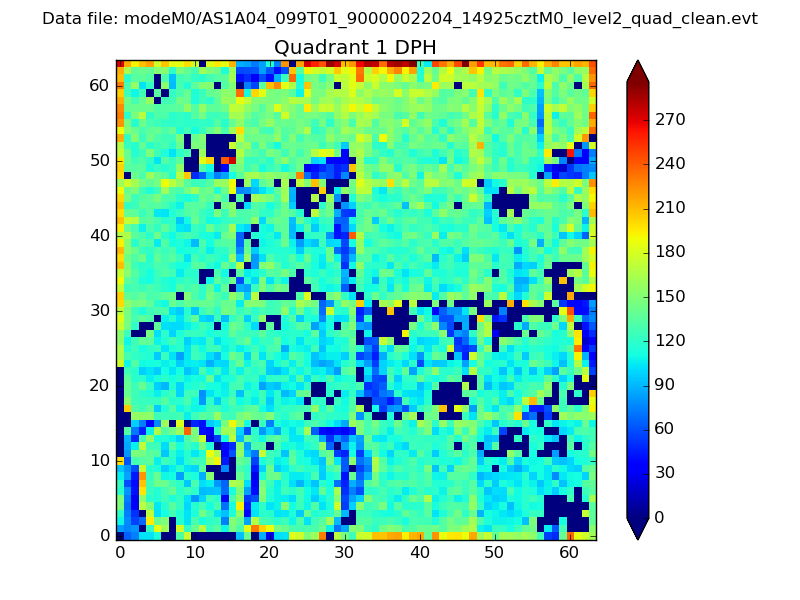
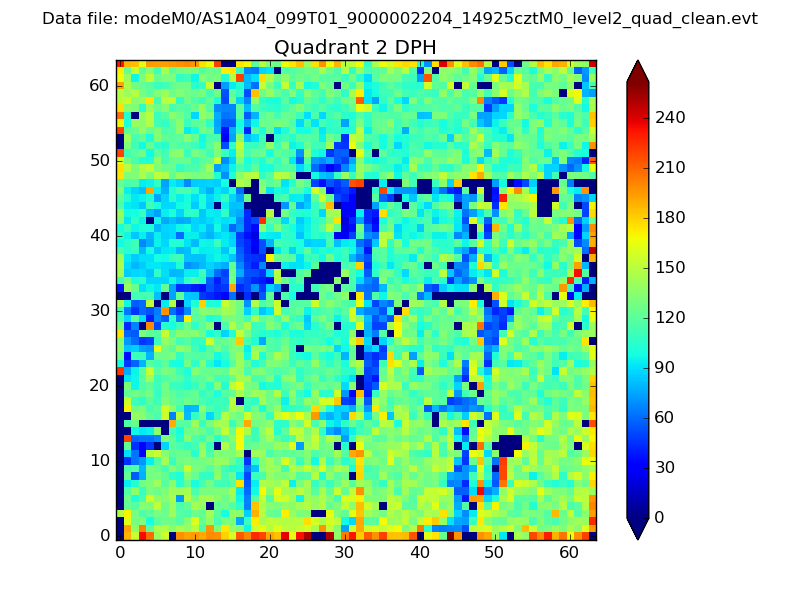
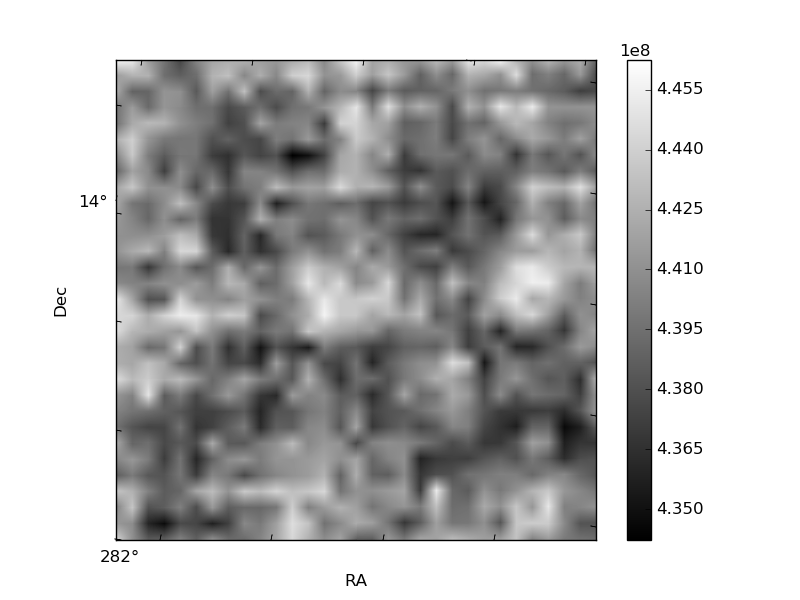
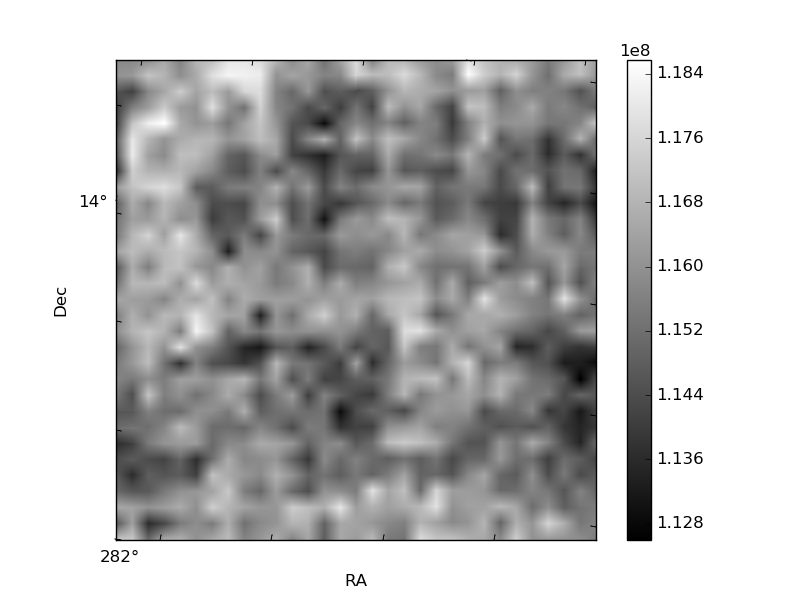
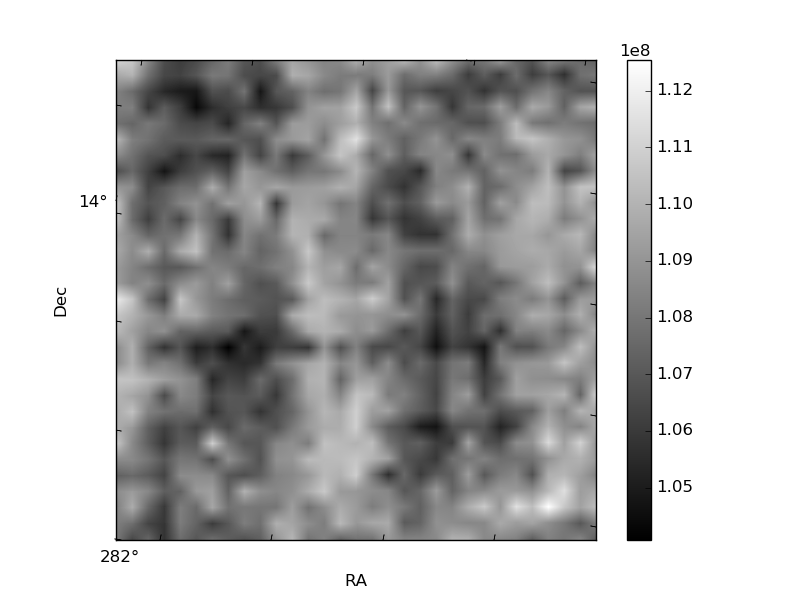
Histogram calculated using DETX and DETY for each event in the final _common_clean file
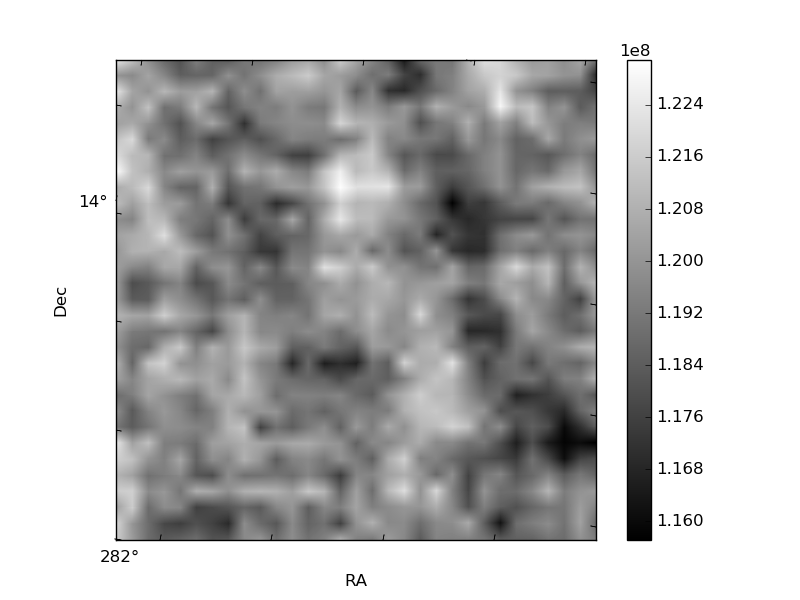
| Quadrant A | 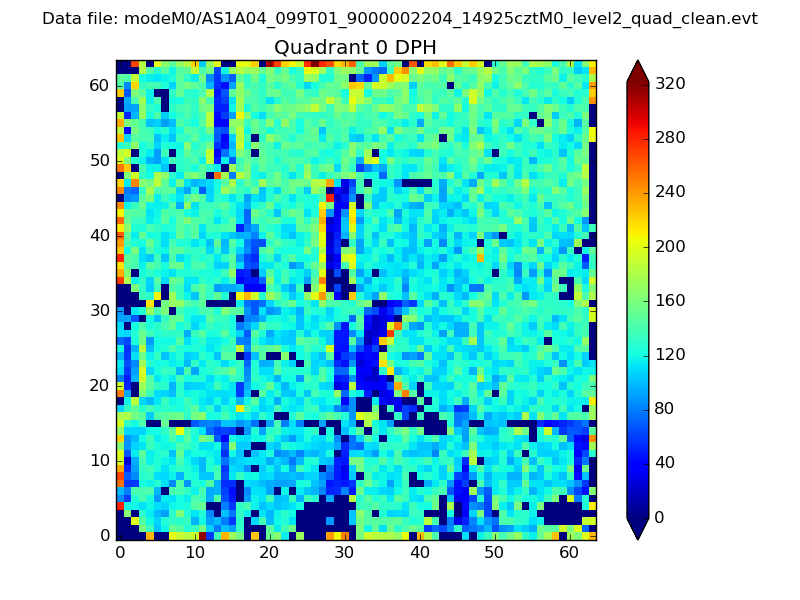 |
 |
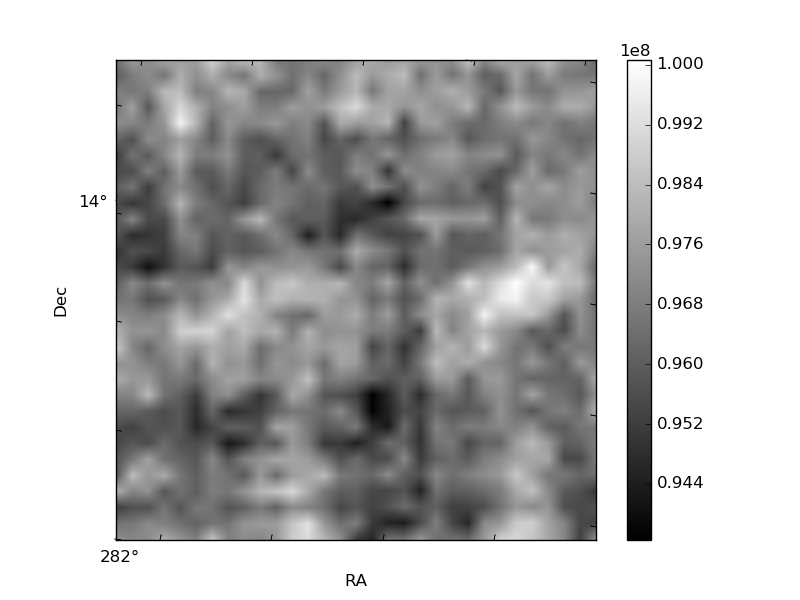
Quadrant B |
|---|---|---|---|
| Quadrant D | 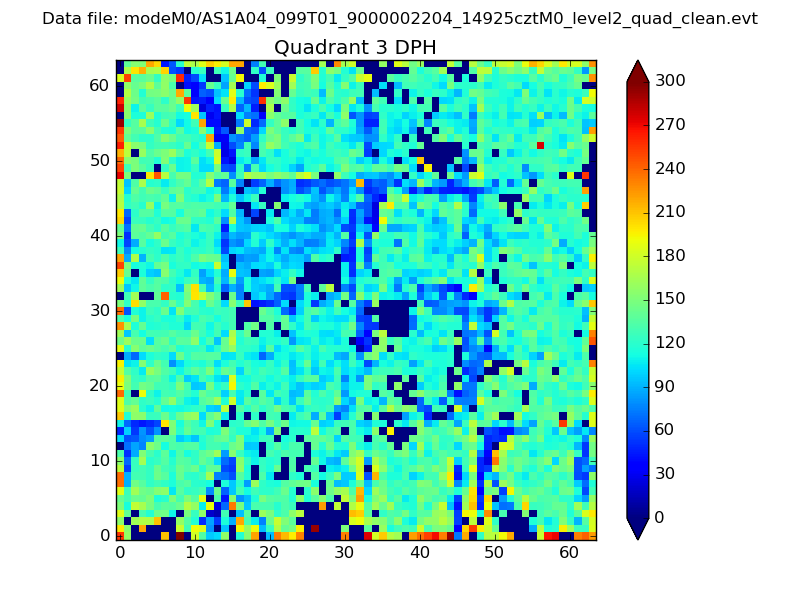 |
 |
Quadrant C |
| Plot type | Count rate plots | Images |
|---|---|---|
| Comparison with Poisson distribution Blue bars denote a histogram of data divided into 1 sec bins. Red curve is a Poisson curve with rate = median count rate of data. |
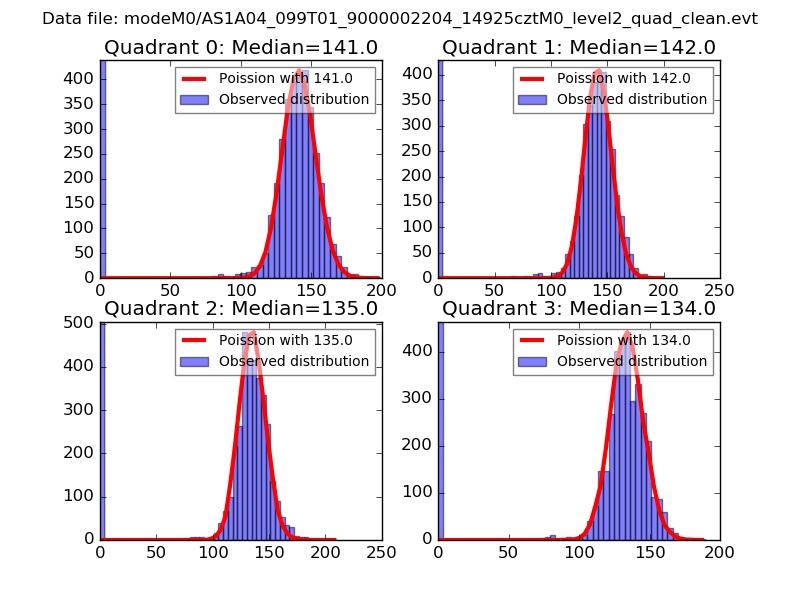 |
 |
| Quadrant-wise count rates Data is divided into 100 sec bins |
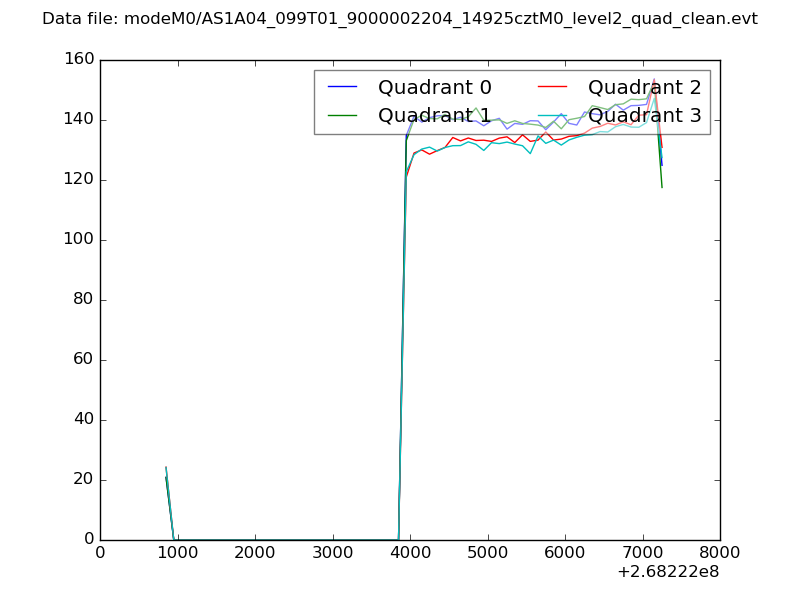 |
|
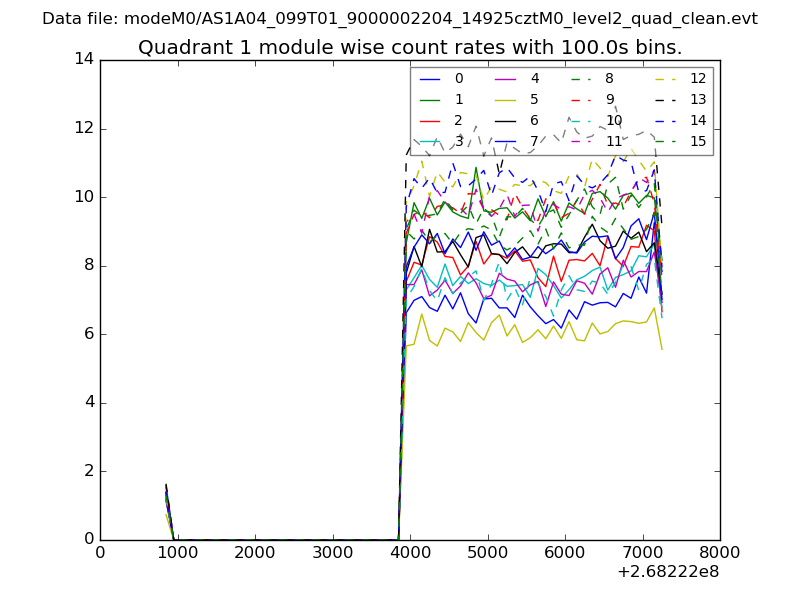
| Module-wise count rates for Quadrant A Data is divided into 100 sec bins |
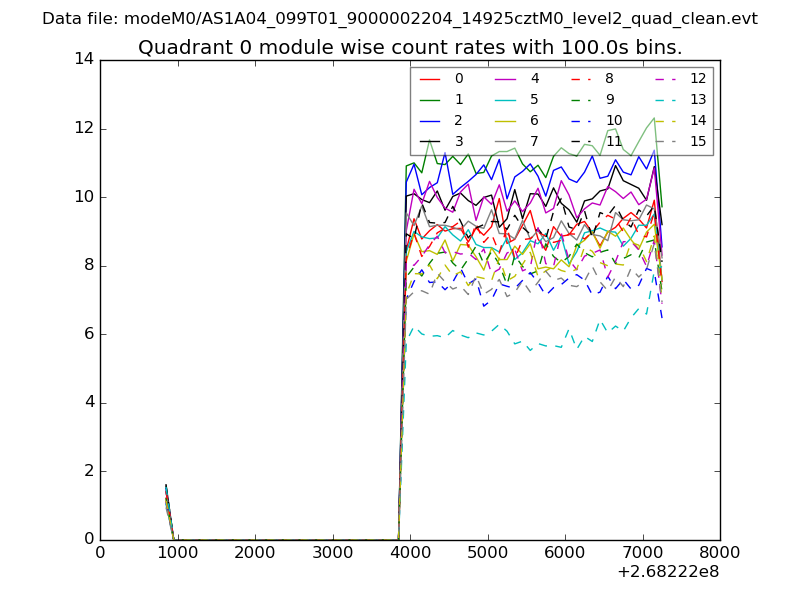 |
 |
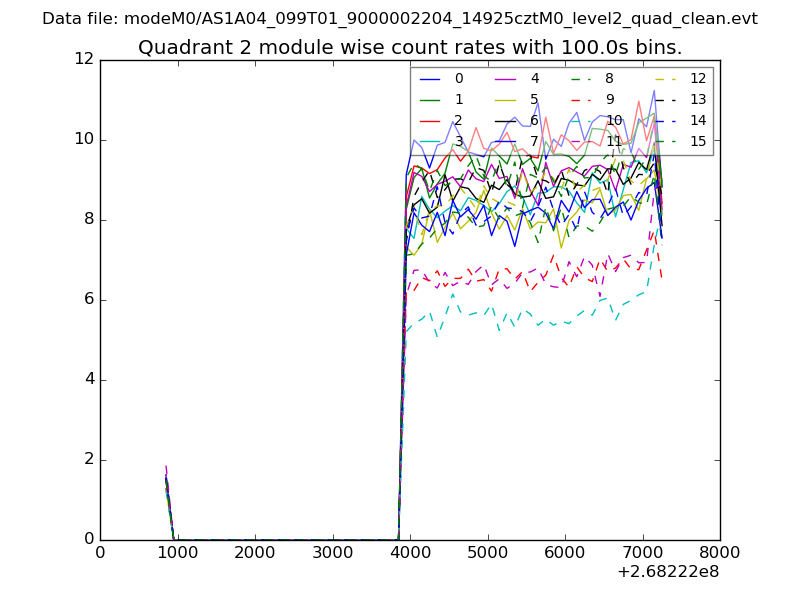
| Module-wise count rates for Quadrant B Data is divided into 100 sec bins |
 |
 |
| Module-wise count rates for Quadrant C Data is divided into 100 sec bins |
 |
 |
| Module-wise count rates for Quadrant D Data is divided into 100 sec bins |
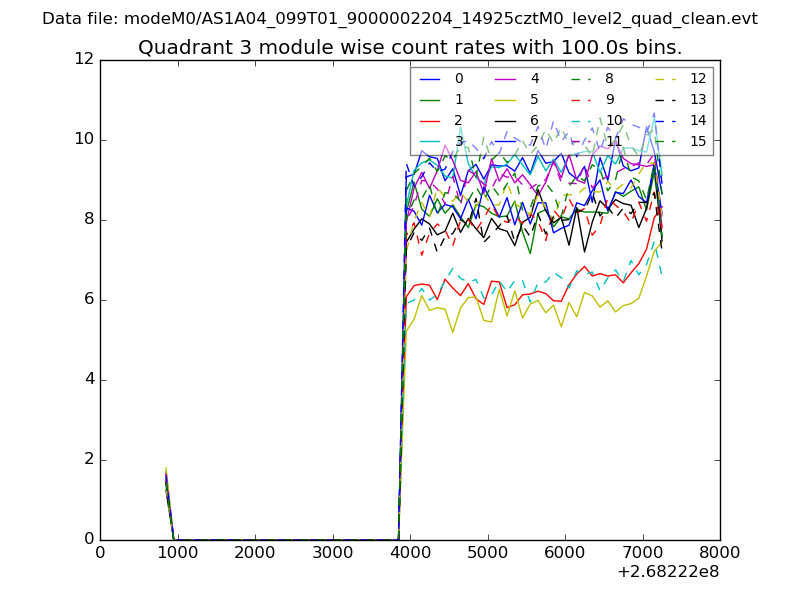 |
 |
| Parameter | Plot |
|---|---|
| CZT HV Monitor | 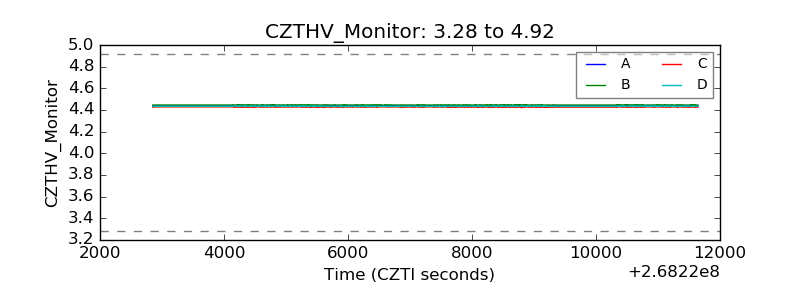 |
| D_VDD | 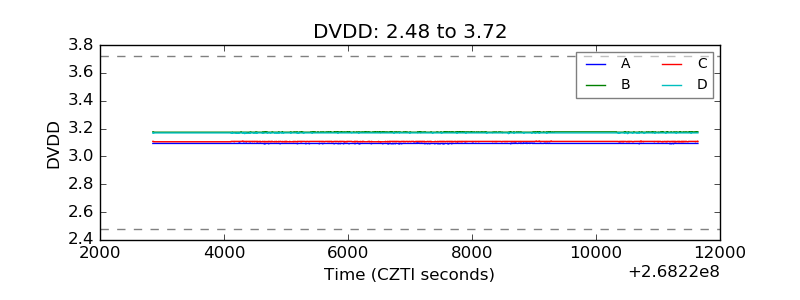 |
| Temperature 1 | 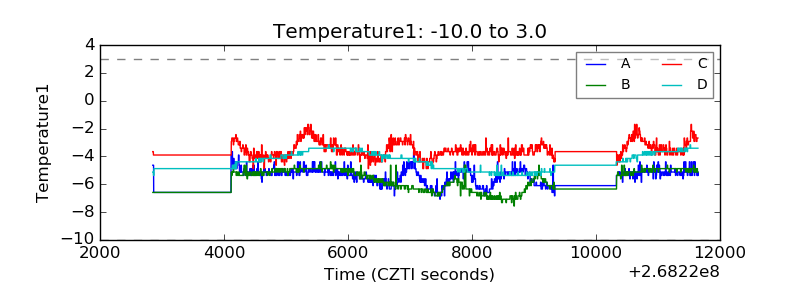 |
| Veto HV Monitor | 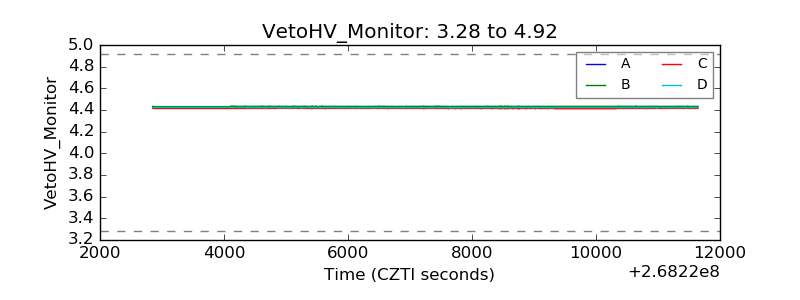 |
| Veto LLD | 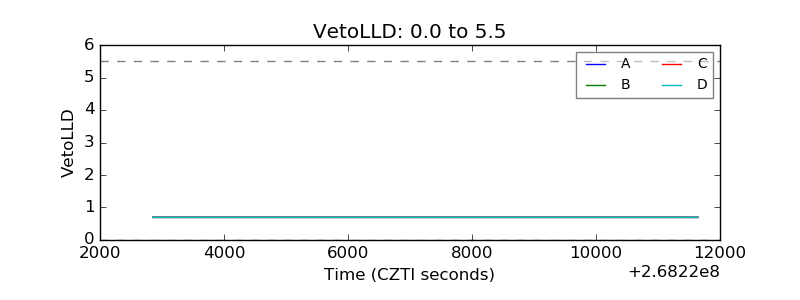 |
| Alpha Counter | 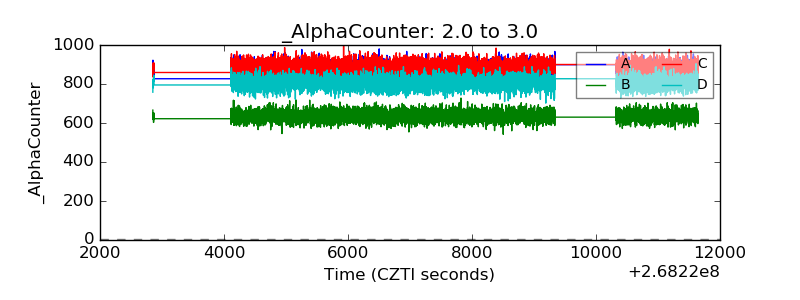 |
| _CPM_Rate | 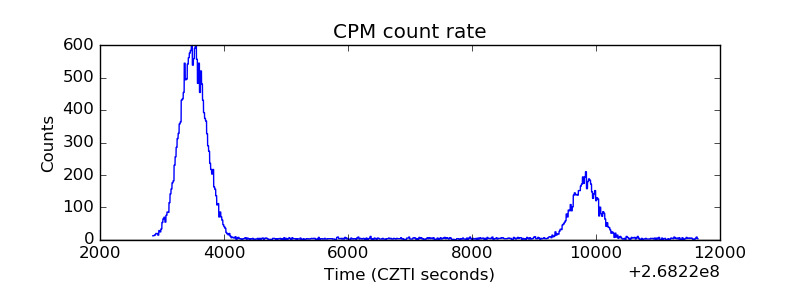 |
| CZT Counter |  |
| +2.5 Volts monitor |  |
| +5 Volts monitor |  |
| _ROLL_ROT | 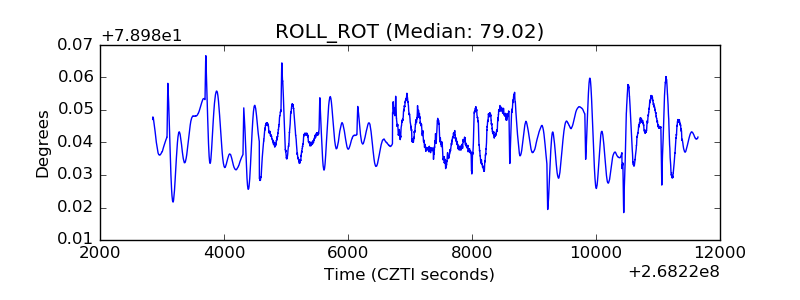 |
| _Roll_DEC | 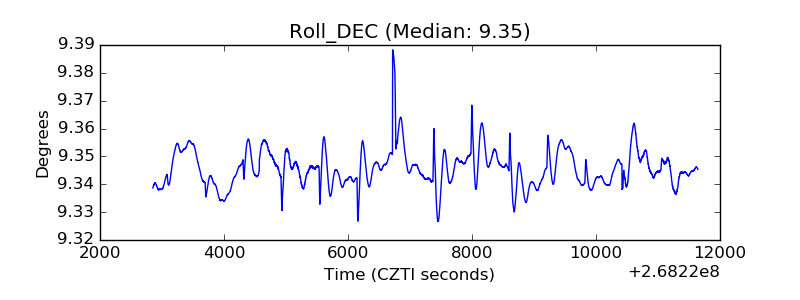 |
| _Roll_RA |  |
| Veto Counter | 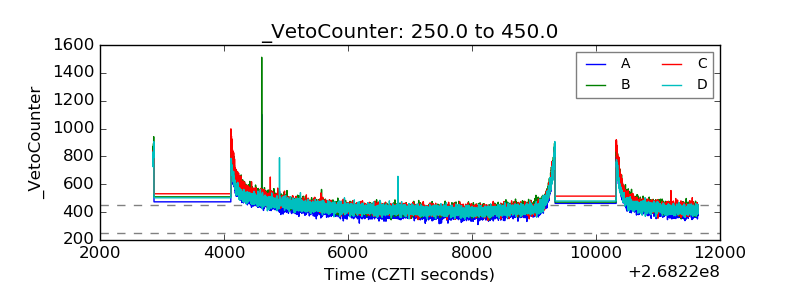 |