| Param | Original file | Final file |
|---|---|---|
| Filename | modeM0/AS1A04_099T01_9000002204_14927cztM0_level2.evt | modeM0/AS1A04_099T01_9000002204_14927cztM0_level2_quad_clean.evt |
| Size (bytes) | 491,662,080 | 87,891,840 |
| Size | 468.9 MB | 83.8 MB |
| Events in quadrant A | 3,614,174 | 552,160 |
| Events in quadrant B | 3,674,968 | 553,586 |
| Events in quadrant C | 3,682,734 | 530,684 |
| Events in quadrant D | 3,427,343 | 522,457 |
| Mode SS | |||
|---|---|---|---|
| Quadrant | BADHDUFLAG | Total packets | Discarded packets |
| A | 0 | 150 | 0 |
| B | 0 | 150 | 0 |
| C | 0 | 150 | 0 |
| D | 0 | 150 | 0 |
| Mode M0 | |||
|---|---|---|---|
| Quadrant | BADHDUFLAG | Total packets | Discarded packets |
| A | 0 | 15194 | 2 |
| B | 0 | 15312 | 2 |
| C | 0 | 15246 | 2 |
| D | 0 | 15086 | 2 |
| Mode M9 | |||
|---|---|---|---|
| Quadrant | BADHDUFLAG | Total packets | Discarded packets |
| A | 0 | 16 | 0 |
| B | 0 | 16 | 0 |
| C | 0 | 16 | 0 |
| D | 0 | 16 | 0 |
| Quadrant | Total seconds | Saturated seconds | Saturation percentage |
|---|---|---|---|
| A | 7214 | 221 | 3.063488% |
| B | 7214 | 265 | 3.673413% |
| C | 7214 | 185 | 2.564458% |
| D | 7214 | 158 | 2.190186% |
Noise dominated data is calculated using 1-second bins in cleaned event files. If a bin has >2000 counts, and if more than 50% of those come from <1% of pixels, then it is considered to be noise-dominated and hence unusable.
| Quadrant | # 1 sec bins | Bins with >0 counts | Bins with >2000 counts | High rate bins dominated by noise | Noise dominated (total time) | Noise dominated (detector-on time) | Marked lightcurve |
|---|---|---|---|---|---|---|---|
| A | 8835 | 7217 | 0 | 0 | 0.00% | 0.00% | 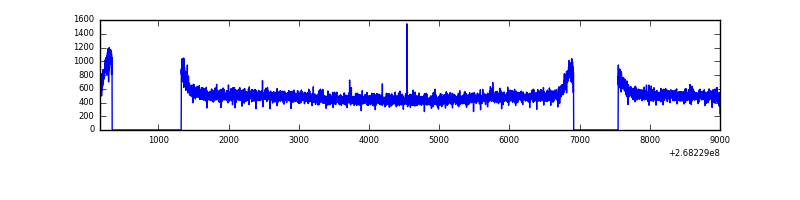 |
| B | 8835 | 7217 | 0 | 0 | 0.00% | 0.00% | 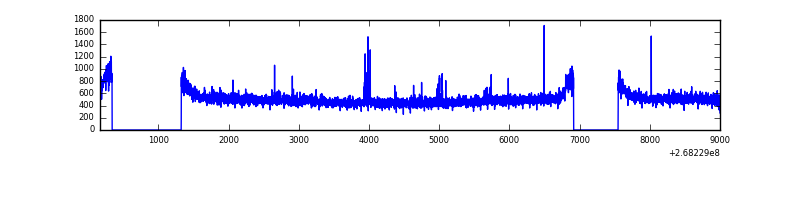 |
| C | 8835 | 7217 | 0 | 0 | 0.00% | 0.00% | 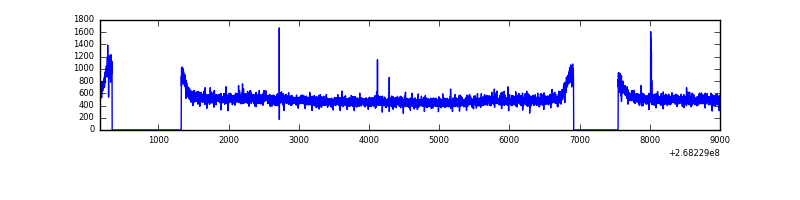 |
| D | 8835 | 7217 | 0 | 0 | 0.00% | 0.00% |  |
Top three noisy pixels from each quadrant. If the there are fewer than three noisy pixels in the level2.evt file, extra rows are filled as -1
| Pixel properties | Quadrant properties | ||||||
|---|---|---|---|---|---|---|---|
| Quadrant | DetID | PixID | Counts | Sigma | Mean | Median | Sigma |
| A | 12 | 189 | 20496 | 103.64 | 931 | 911 | 189.0 |
| A | 0 | 226 | 8134 | 38.22 | 931 | 911 | 189.0 |
| A | 1 | 162 | 6841 | 31.38 | 931 | 911 | 189.0 |
| B | 0 | 229 | 24948 | 134.94 | 919 | 896 | 178.2 |
| B | 12 | 111 | 22150 | 119.24 | 919 | 896 | 178.2 |
| B | 0 | 85 | 20909 | 112.28 | 919 | 896 | 178.2 |
| C | 3 | 233 | 162498 | 779.48 | 894 | 901 | 207.3 |
| C | 7 | 247 | 20420 | 94.15 | 894 | 901 | 207.3 |
| C | 14 | 234 | 11334 | 50.32 | 894 | 901 | 207.3 |
| D | 2 | 234 | 24740 | 110.66 | 900 | 881 | 215.6 |
| D | 13 | 249 | 18925 | 83.69 | 900 | 881 | 215.6 |
| D | 14 | 226 | 8812 | 36.79 | 900 | 881 | 215.6 |
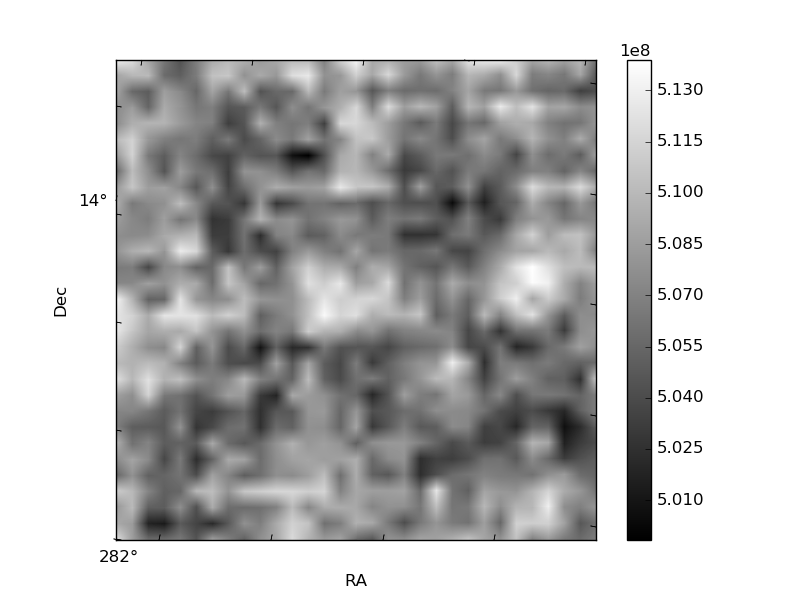
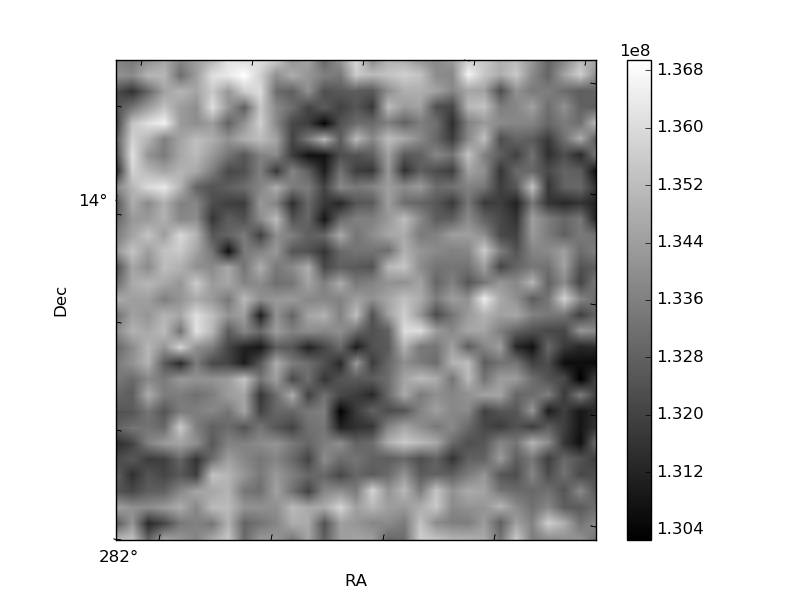
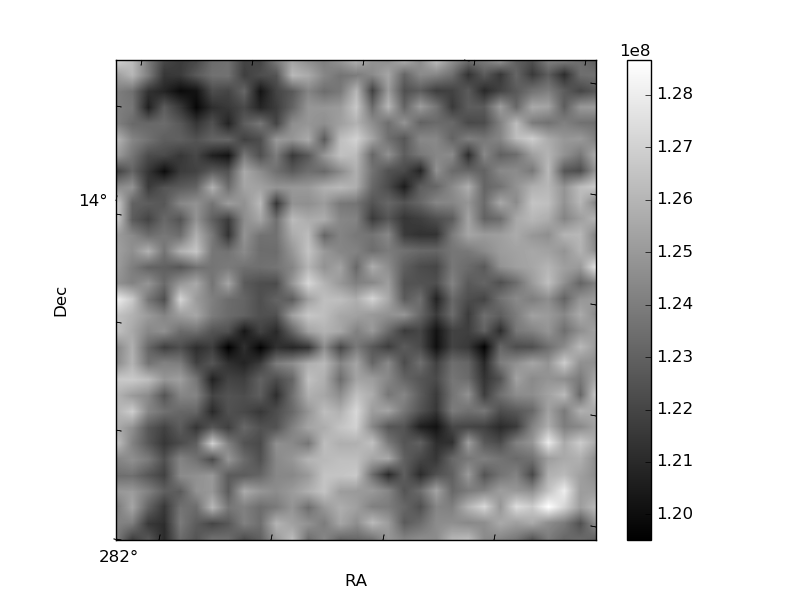
Histogram calculated using DETX and DETY for each event in the final _common_clean file
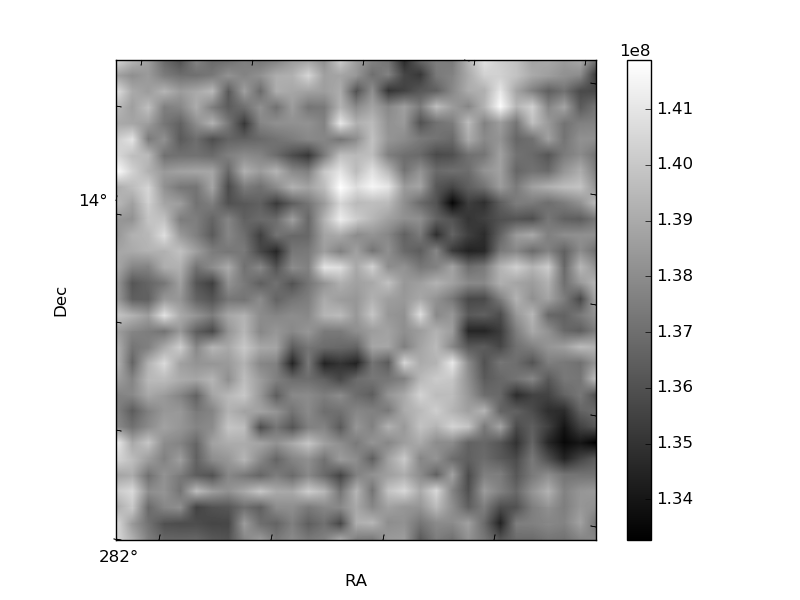
| Quadrant A | 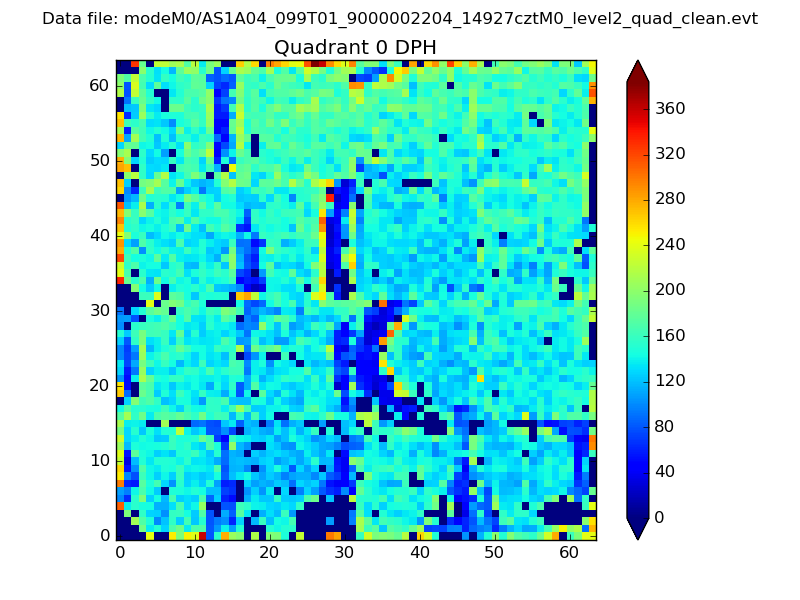 |
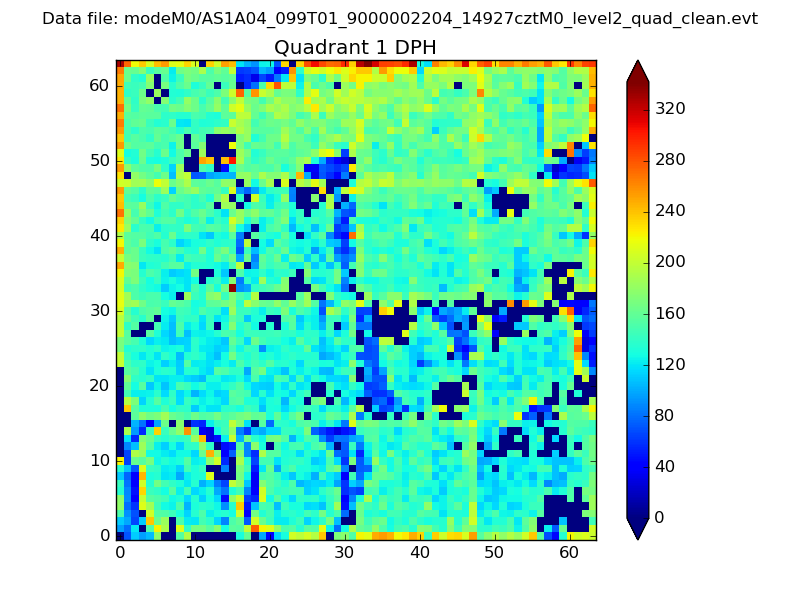 |
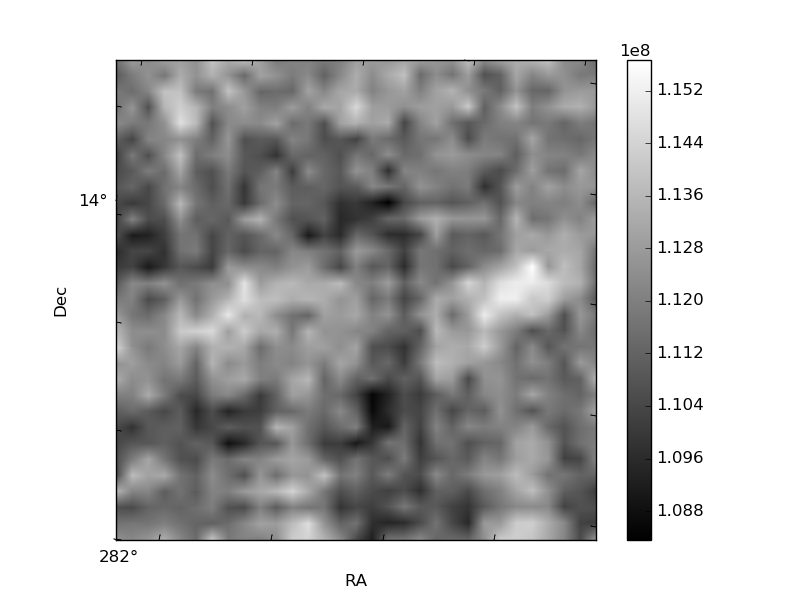
Quadrant B |
|---|---|---|---|
| Quadrant D | 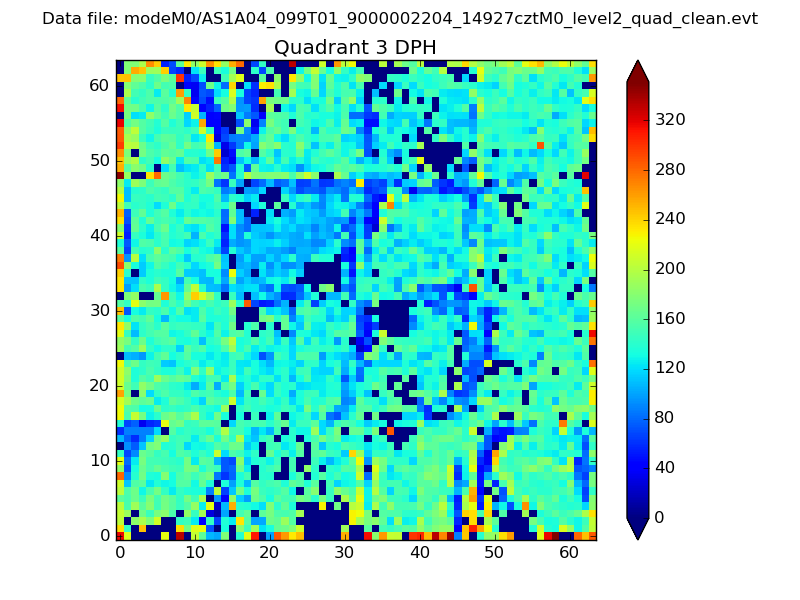 |
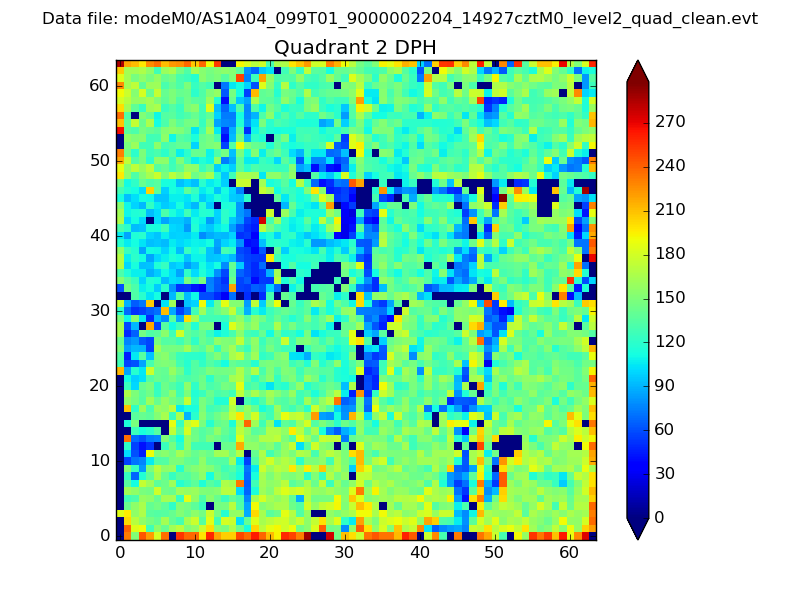 |
Quadrant C |
| Plot type | Count rate plots | Images |
|---|---|---|
| Comparison with Poisson distribution Blue bars denote a histogram of data divided into 1 sec bins. Red curve is a Poisson curve with rate = median count rate of data. |
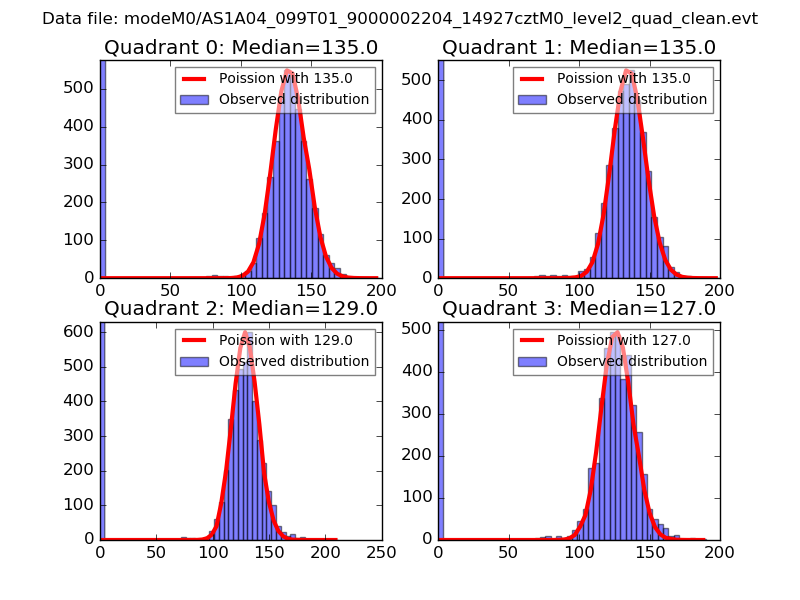 |
 |
| Quadrant-wise count rates Data is divided into 100 sec bins |
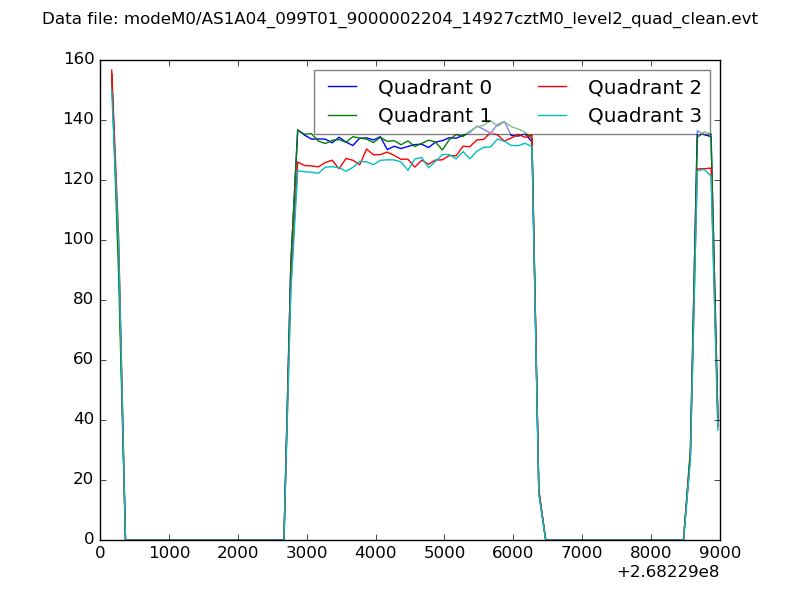 |
|
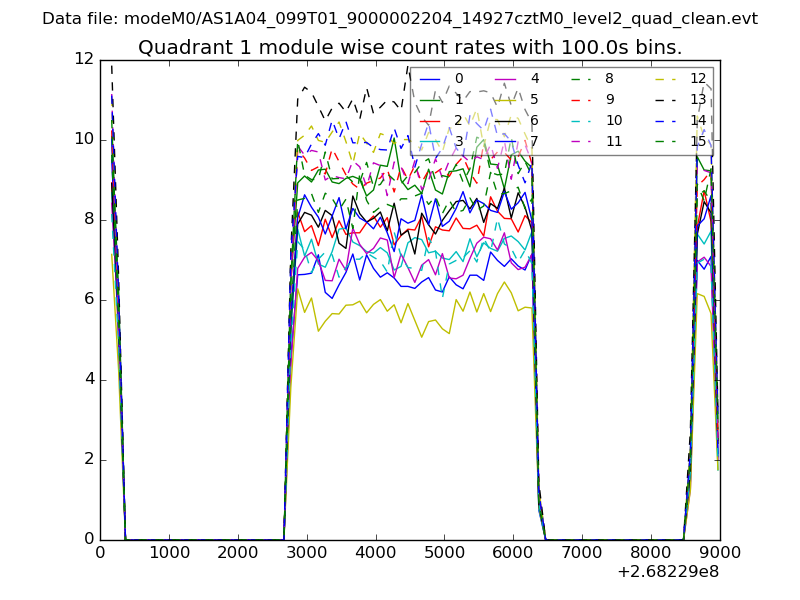
| Module-wise count rates for Quadrant A Data is divided into 100 sec bins |
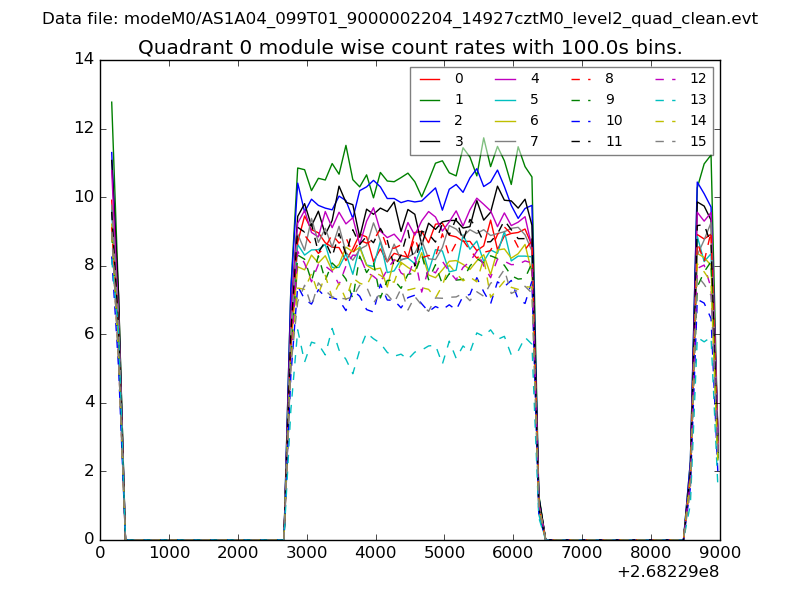 |
 |
| Module-wise count rates for Quadrant B Data is divided into 100 sec bins |
 |
 |
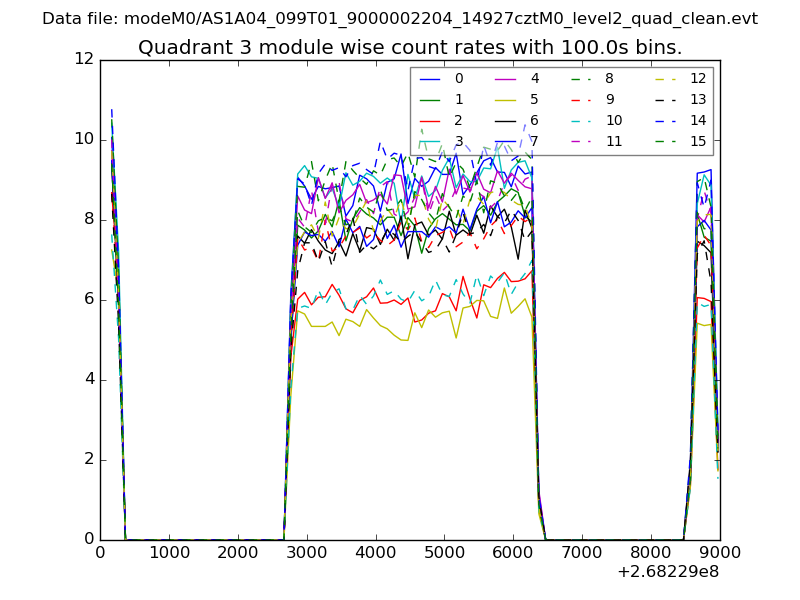
| Module-wise count rates for Quadrant C Data is divided into 100 sec bins |
 |
 |
| Module-wise count rates for Quadrant D Data is divided into 100 sec bins |
 |
 |
| Parameter | Plot |
|---|---|
| CZT HV Monitor | 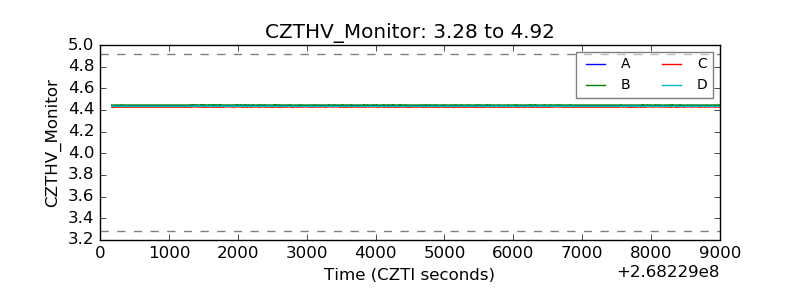 |
| D_VDD |  |
| Temperature 1 | 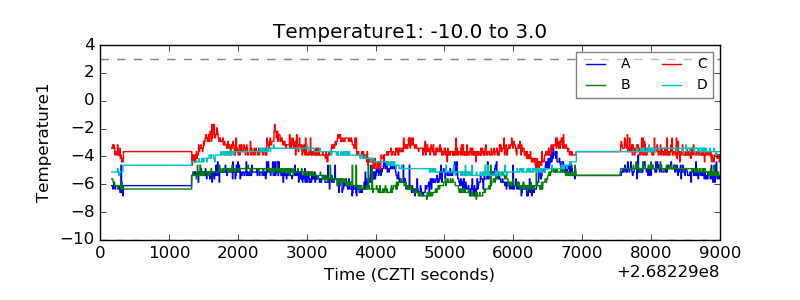 |
| Veto HV Monitor | 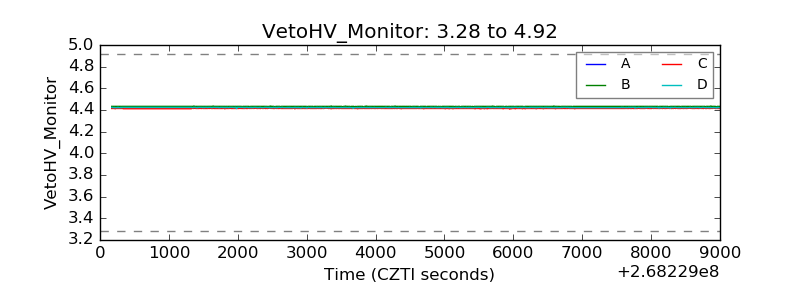 |
| Veto LLD | 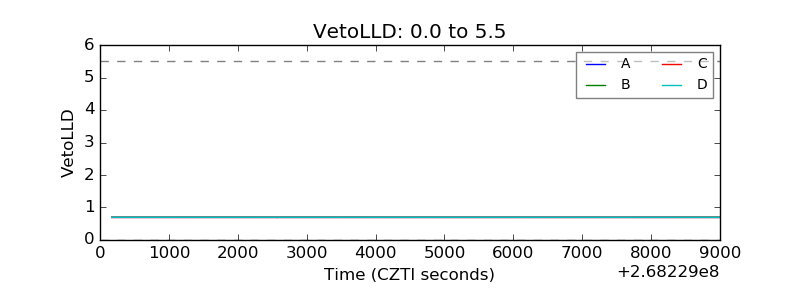 |
| Alpha Counter | 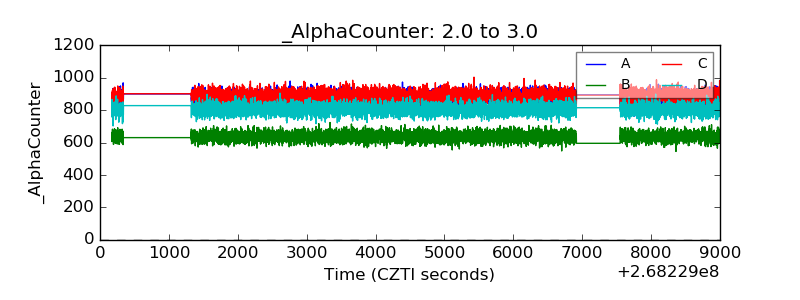 |
| _CPM_Rate | 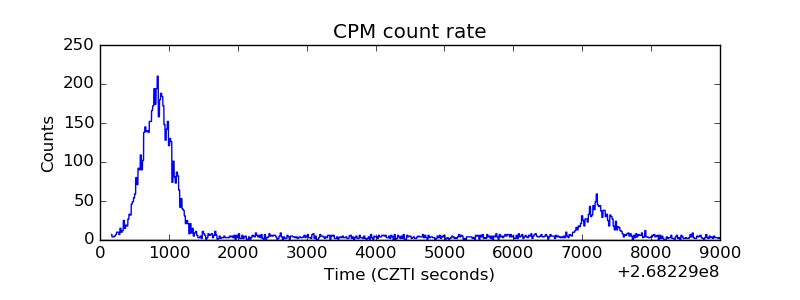 |
| CZT Counter | 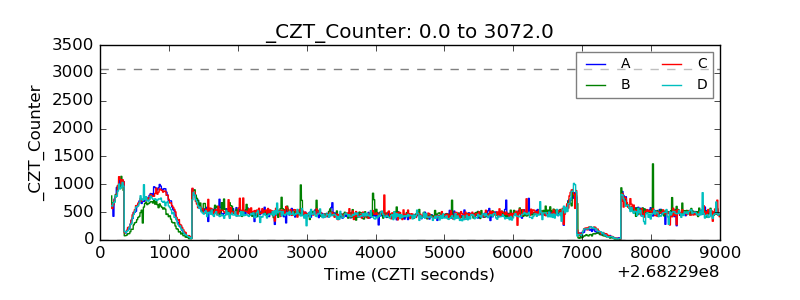 |
| +2.5 Volts monitor |  |
| +5 Volts monitor |  |
| _ROLL_ROT | 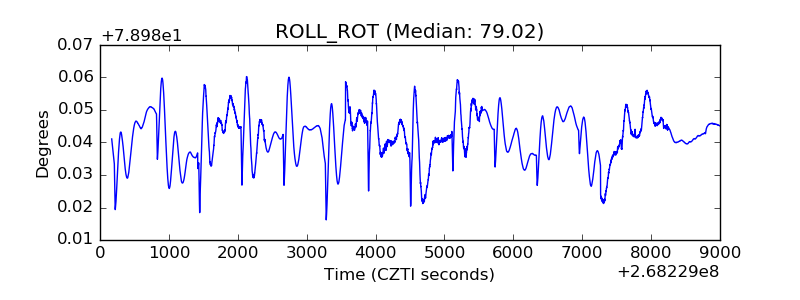 |
| _Roll_DEC | 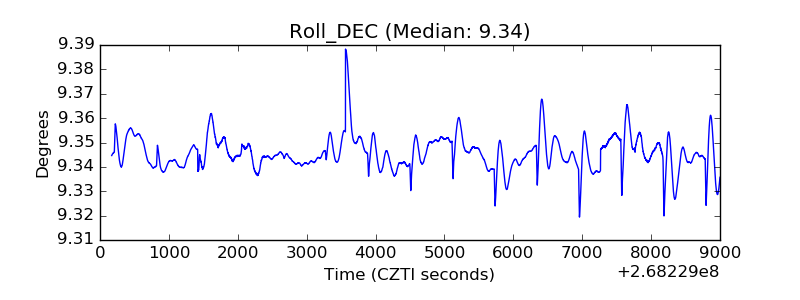 |
| _Roll_RA | 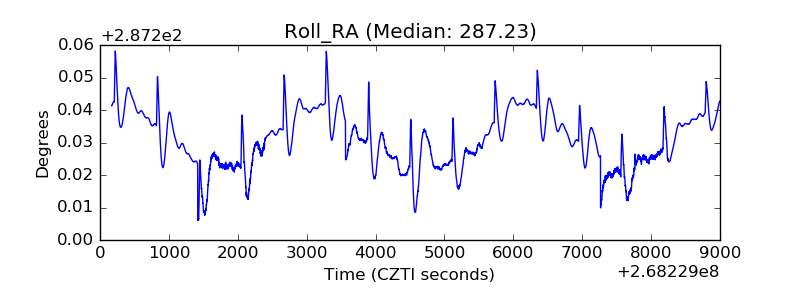 |
| Veto Counter | 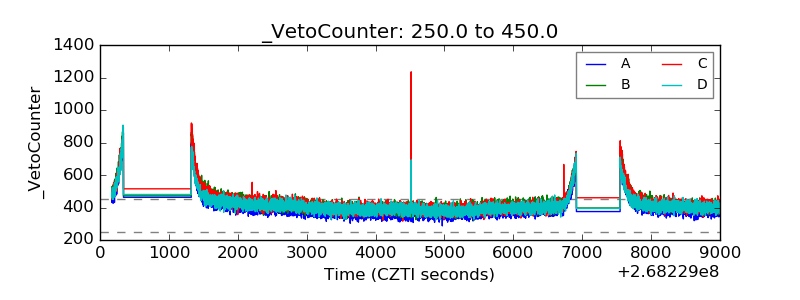 |