| Param | Original file | Final file |
|---|---|---|
| Filename | modeM0/AS1T02_055T01_9000002206cztM0_level2.fits | modeM0/AS1T02_055T01_9000002206cztM0_level2_quad_clean.evt |
| Size (bytes) | 664,237,440 | 662,031,360 |
| Size | 633.5 MB | 631.4 MB |
| Events in quadrant A | 4,103,798 | 4,084,629 |
| Events in quadrant B | 3,788,328 | 3,823,561 |
| Events in quadrant C | 3,947,094 | 3,766,129 |
| Events in quadrant D | 3,467,372 | 3,567,444 |
| Mode M0 | |||
|---|---|---|---|
| Quadrant | BADHDUFLAG | Total packets | Discarded packets |
| A | 0 | 145429 | 0 |
| B | 0 | 196748 | 0 |
| C | 0 | 143643 | 0 |
| D | 0 | 157671 | 0 |
| Mode SS | |||
|---|---|---|---|
| Quadrant | BADHDUFLAG | Total packets | Discarded packets |
| A | 0 | 1430 | 0 |
| B | 0 | 1430 | 0 |
| C | 0 | 1430 | 0 |
| D | 0 | 1430 | 0 |
| Mode M9 | |||
|---|---|---|---|
| Quadrant | BADHDUFLAG | Total packets | Discarded packets |
| A | 0 | 116 | 0 |
| B | 0 | 116 | 0 |
| C | 0 | 116 | 0 |
| D | 0 | 116 | 0 |
| Quadrant | Total seconds | Saturated seconds | Saturation percentage |
|---|---|---|---|
| A | 70114 | 633 | 0.902815% |
| B | 70114 | 4943 | 7.049947% |
| C | 70114 | 492 | 0.701714% |
| D | 70114 | 1507 | 2.149357% |
Noise dominated data is calculated using 1-second bins in cleaned event files. If a bin has >2000 counts, and if more than 50% of those come from <1% of pixels, then it is considered to be noise-dominated and hence unusable.
| Quadrant | # 1 sec bins | Bins with >0 counts | Bins with >2000 counts | High rate bins dominated by noise | Noise dominated (total time) | Noise dominated (detector-on time) | Marked lightcurve |
|---|---|---|---|---|---|---|---|
| A | 81709 | 70113 | 0 | 0 | 0.00% | 0.00% | 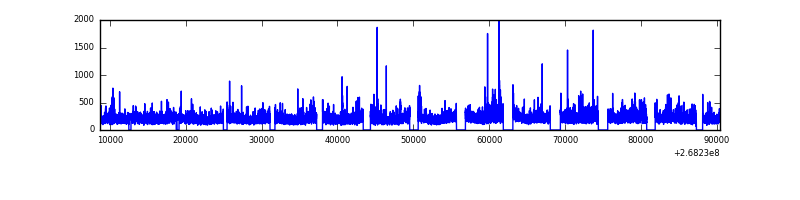 |
| B | 81709 | 70027 | 0 | 0 | 0.00% | 0.00% |  |
| C | 81709 | 70114 | 0 | 0 | 0.00% | 0.00% | 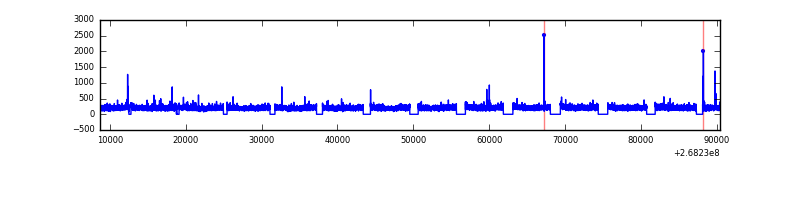 |
| D | 81709 | 70097 | 0 | 0 | 0.00% | 0.00% |  |
Top three noisy pixels from each quadrant. If the there are fewer than three noisy pixels in the level2.evt file, extra rows are filled as -1
| Pixel properties | Quadrant properties | ||||||
|---|---|---|---|---|---|---|---|
| Quadrant | DetID | PixID | Counts | Sigma | Mean | Median | Sigma |
| A | 0 | 29 | 4038 | 11.4 | 1068 | 1004 | 266.2 |
| A | 7 | 110 | 3230 | 8.36 | 1068 | 1004 | 266.2 |
| A | 9 | 19 | 3143 | 8.04 | 1068 | 1004 | 266.2 |
| B | 2 | 9 | 3240 | 11.82 | 1001 | 958 | 193.0 |
| B | 14 | 254 | 2481 | 7.89 | 1001 | 958 | 193.0 |
| B | 5 | 128 | 2463 | 7.8 | 1001 | 958 | 193.0 |
| C | 12 | 241 | 2851 | 6.99 | 1044 | 973 | 268.8 |
| C | 2 | 191 | 2632 | 6.17 | 1044 | 973 | 268.8 |
| C | 7 | 111 | 2616 | 6.11 | 1044 | 973 | 268.8 |
| D | 3 | 14 | 2504 | 5.98 | 989 | 899 | 268.5 |
| D | 6 | 231 | 2489 | 5.92 | 989 | 899 | 268.5 |
| D | 6 | 67 | 2400 | 5.59 | 989 | 899 | 268.5 |
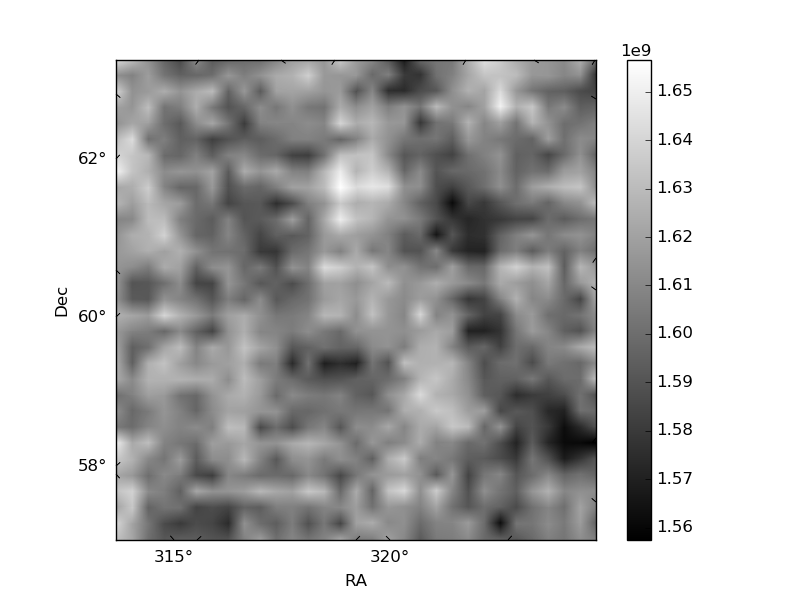
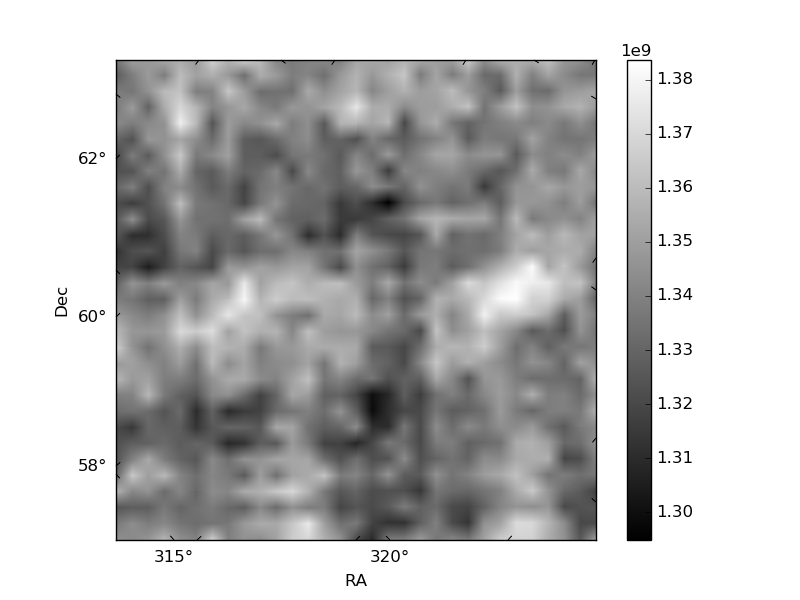
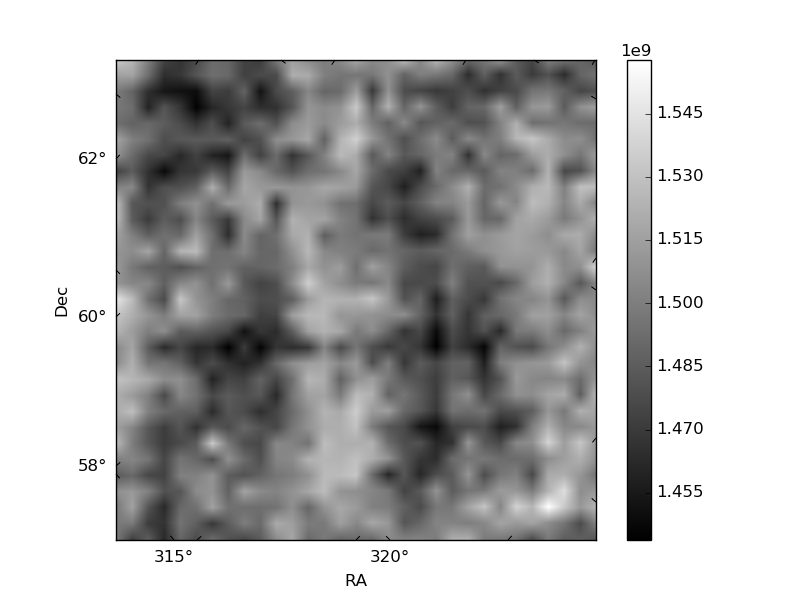
Histogram calculated using DETX and DETY for each event in the final _common_clean file
| Quadrant A | 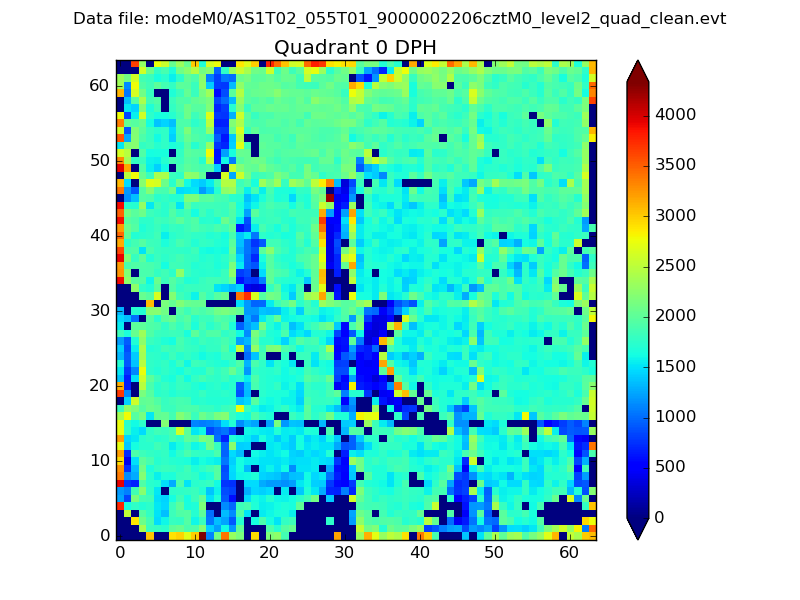 |
 |
Quadrant B |
|---|---|---|---|
| Quadrant D |  |
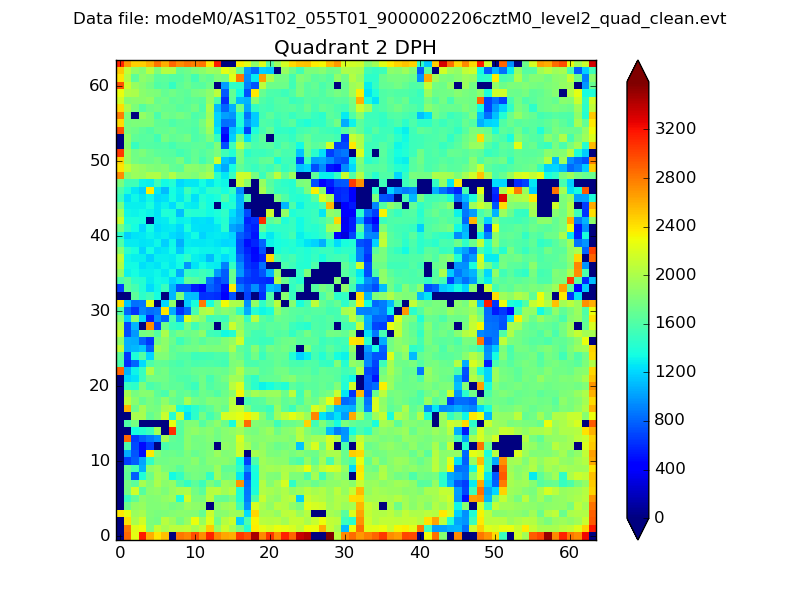 |
Quadrant C |
| Plot type | Count rate plots | Images |
|---|---|---|
| Comparison with Poisson distribution Blue bars denote a histogram of data divided into 1 sec bins. Red curve is a Poisson curve with rate = median count rate of data. |
 |
 |
| Quadrant-wise count rates Data is divided into 100 sec bins |
 |
|
| Module-wise count rates for Quadrant A Data is divided into 100 sec bins |
 |
 |
| Module-wise count rates for Quadrant B Data is divided into 100 sec bins |
 |
 |
| Module-wise count rates for Quadrant C Data is divided into 100 sec bins |
 |
 |
| Module-wise count rates for Quadrant D Data is divided into 100 sec bins |
 |
 |
| Parameter | Plot |
|---|---|
| CZT HV Monitor |  |
| D_VDD |  |
| Temperature 1 | 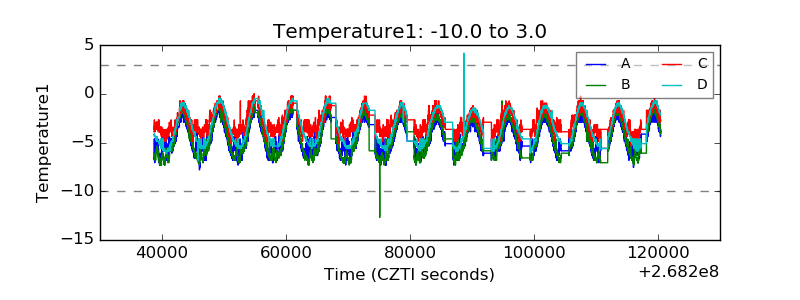 |
| Veto HV Monitor |  |
| Veto LLD | 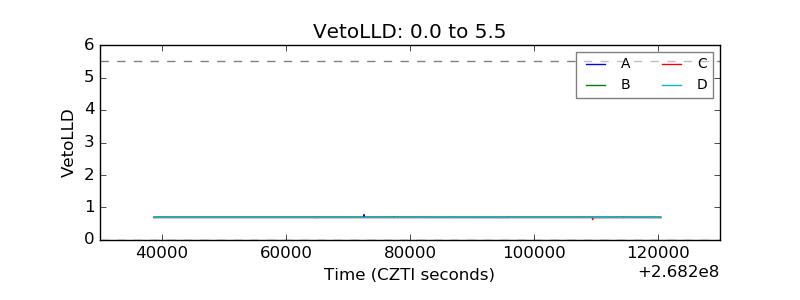 |
| Alpha Counter | 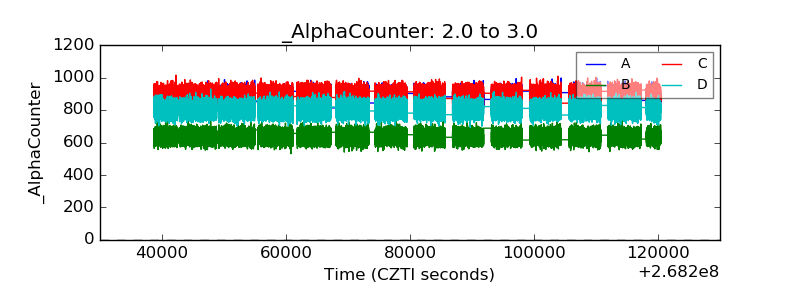 |
| _CPM_Rate |  |
| CZT Counter |  |
| +2.5 Volts monitor | 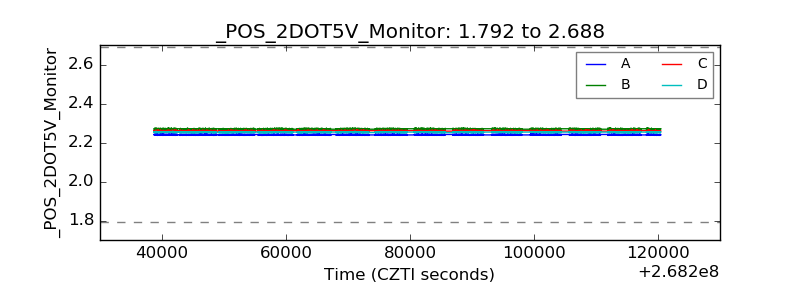 |
| +5 Volts monitor | 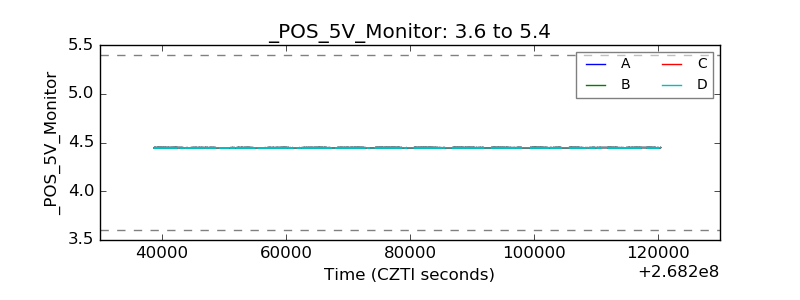 |
| _ROLL_ROT | 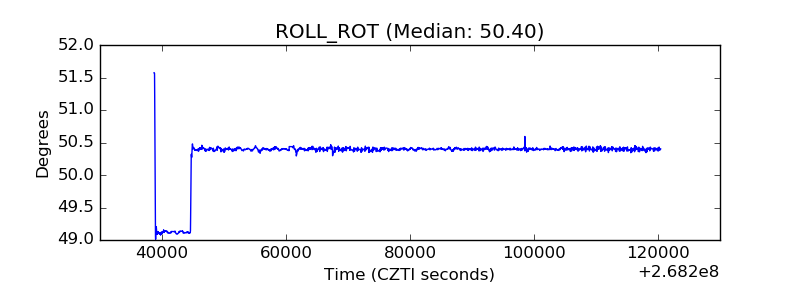 |
| _Roll_DEC |  |
| _Roll_RA |  |
| Veto Counter |  |