| Param | Original file | Final file |
|---|---|---|
| Filename | modeM0/AS1T02_055T01_9000002206_14927cztM0_level2.evt | modeM0/AS1T02_055T01_9000002206_14927cztM0_level2_quad_clean.evt |
| Size (bytes) | 363,346,560 | 80,700,480 |
| Size | 346.5 MB | 77.0 MB |
| Events in quadrant A | 2,558,910 | 527,701 |
| Events in quadrant B | 2,921,806 | 520,670 |
| Events in quadrant C | 2,549,725 | 510,169 |
| Events in quadrant D | 2,609,110 | 510,798 |
| Mode M0 | |||
|---|---|---|---|
| Quadrant | BADHDUFLAG | Total packets | Discarded packets |
| A | 0 | 11139 | 2 |
| B | 0 | 12271 | 1 |
| C | 0 | 11023 | 1 |
| D | 0 | 11649 | 1 |
| Mode SS | |||
|---|---|---|---|
| Quadrant | BADHDUFLAG | Total packets | Discarded packets |
| A | 0 | 108 | 0 |
| B | 0 | 108 | 0 |
| C | 0 | 108 | 0 |
| D | 0 | 108 | 0 |
| Mode M9 | |||
|---|---|---|---|
| Quadrant | BADHDUFLAG | Total packets | Discarded packets |
| A | 0 | 3 | 0 |
| B | 0 | 3 | 0 |
| C | 0 | 3 | 0 |
| D | 0 | 3 | 0 |
| Quadrant | Total seconds | Saturated seconds | Saturation percentage |
|---|---|---|---|
| A | 5352 | 88 | 1.644245% |
| B | 5352 | 205 | 3.830344% |
| C | 5352 | 89 | 1.662930% |
| D | 5352 | 118 | 2.204783% |
Noise dominated data is calculated using 1-second bins in cleaned event files. If a bin has >2000 counts, and if more than 50% of those come from <1% of pixels, then it is considered to be noise-dominated and hence unusable.
| Quadrant | # 1 sec bins | Bins with >0 counts | Bins with >2000 counts | High rate bins dominated by noise | Noise dominated (total time) | Noise dominated (detector-on time) | Marked lightcurve |
|---|---|---|---|---|---|---|---|
| A | 5638 | 5354 | 0 | 0 | 0.00% | 0.00% | 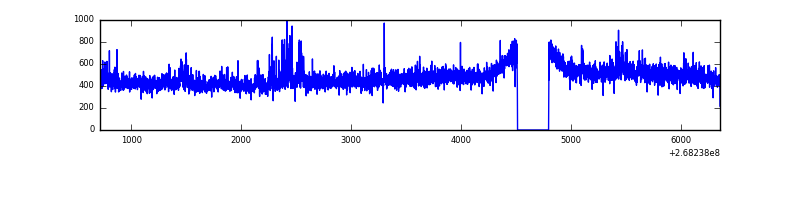 |
| B | 5638 | 5354 | 33 | 33 | 0.59% | 0.62% | 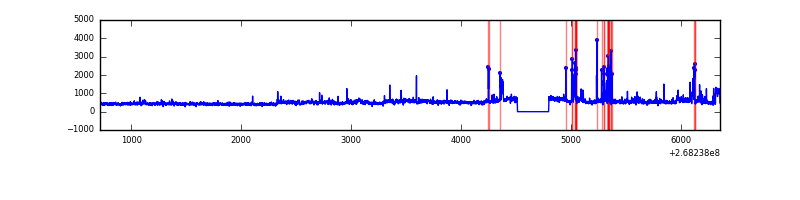 |
| C | 5638 | 5354 | 0 | 0 | 0.00% | 0.00% | 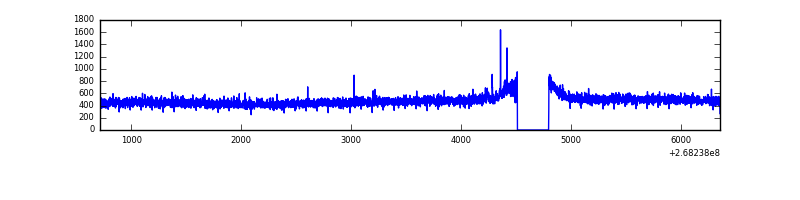 |
| D | 5638 | 5354 | 25 | 25 | 0.44% | 0.47% | 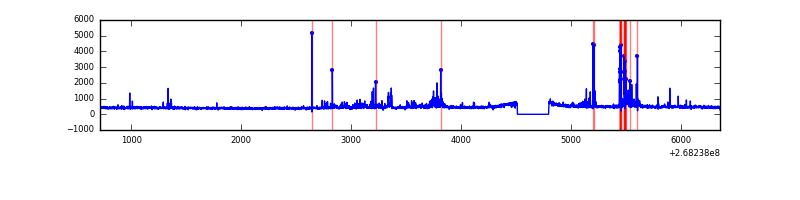 |
Top three noisy pixels from each quadrant. If the there are fewer than three noisy pixels in the level2.evt file, extra rows are filled as -1
| Pixel properties | Quadrant properties | ||||||
|---|---|---|---|---|---|---|---|
| Quadrant | DetID | PixID | Counts | Sigma | Mean | Median | Sigma |
| A | 12 | 189 | 44966 | 341.88 | 637 | 624 | 129.7 |
| A | 3 | 1 | 44425 | 337.71 | 637 | 624 | 129.7 |
| A | 1 | 162 | 9165 | 65.85 | 637 | 624 | 129.7 |
| B | 10 | 16 | 363404 | 3038.8 | 629 | 614 | 119.4 |
| B | 0 | 229 | 42397 | 349.98 | 629 | 614 | 119.4 |
| B | 0 | 189 | 15239 | 122.5 | 629 | 614 | 119.4 |
| C | 3 | 233 | 145150 | 1015.24 | 612 | 615 | 142.4 |
| C | 9 | 54 | 11977 | 79.81 | 612 | 615 | 142.4 |
| C | 13 | 61 | 4570 | 27.78 | 612 | 615 | 142.4 |
| D | 2 | 33 | 104463 | 709.29 | 612 | 596 | 146.4 |
| D | 2 | 136 | 64638 | 437.33 | 612 | 596 | 146.4 |
| D | 13 | 170 | 48366 | 326.21 | 612 | 596 | 146.4 |
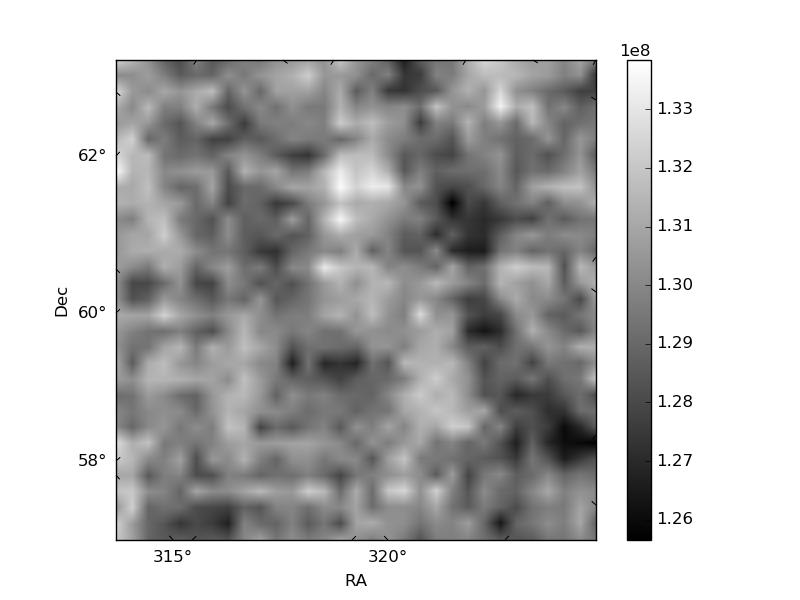
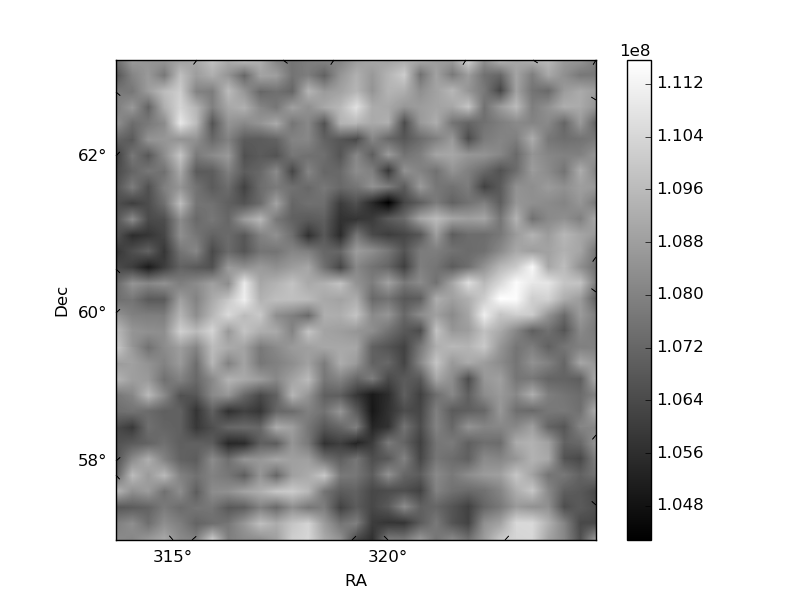
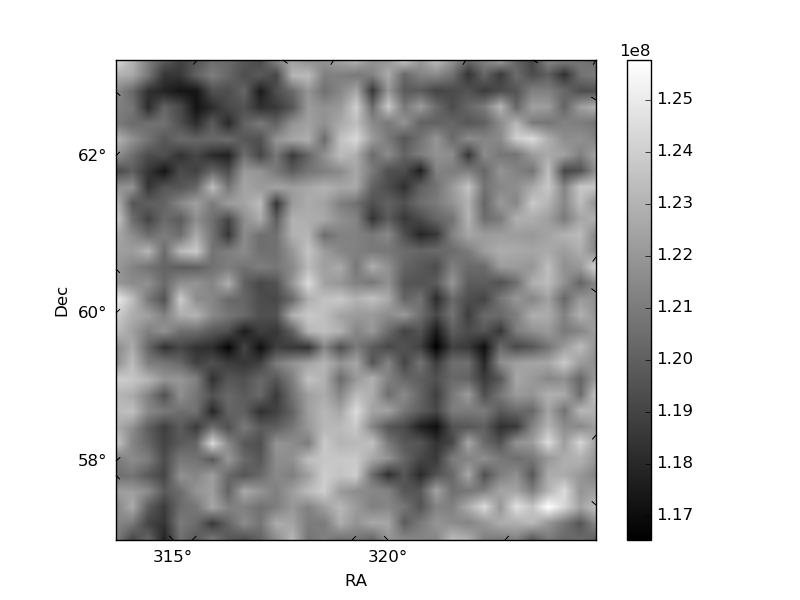
Histogram calculated using DETX and DETY for each event in the final _common_clean file
| Quadrant A | 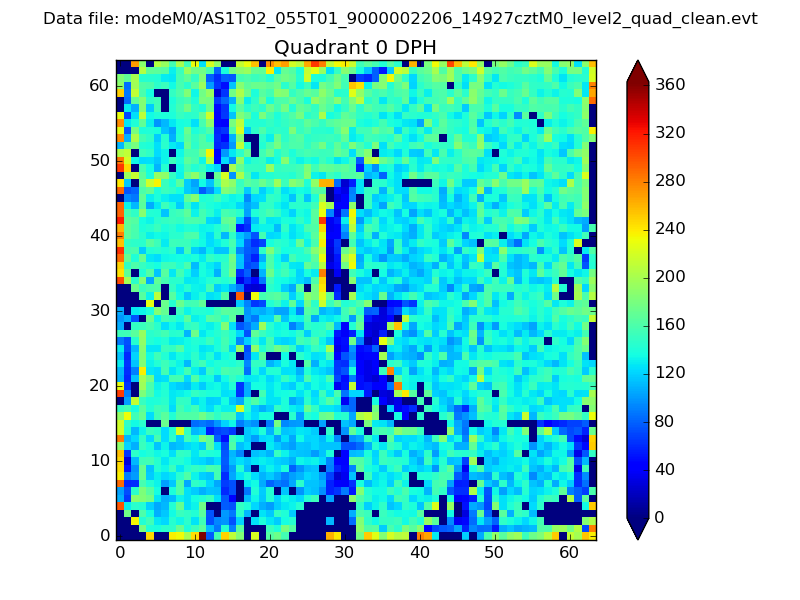 |
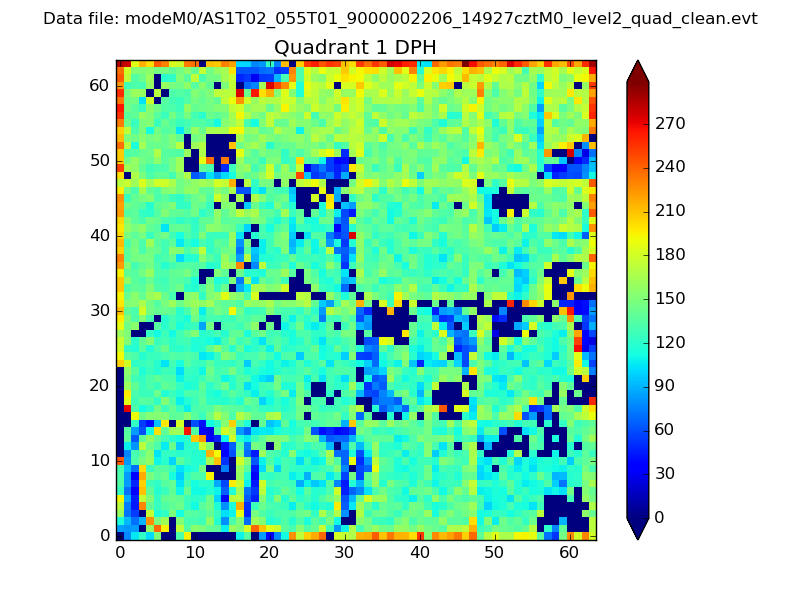 |
Quadrant B |
|---|---|---|---|
| Quadrant D | 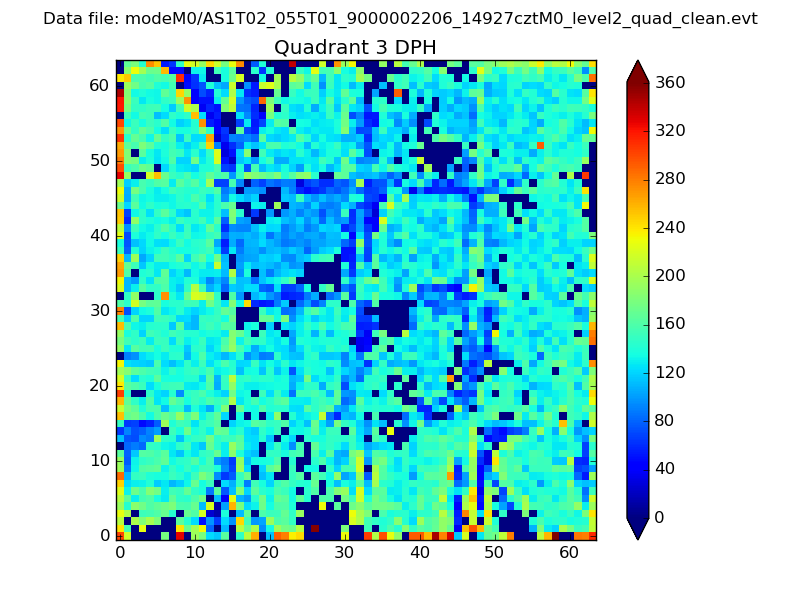 |
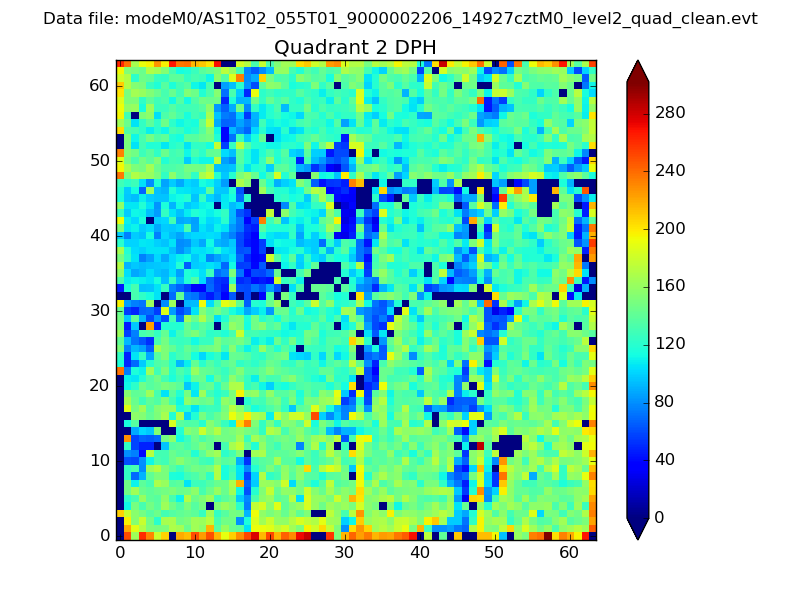 |
Quadrant C |
| Plot type | Count rate plots | Images |
|---|---|---|
| Comparison with Poisson distribution Blue bars denote a histogram of data divided into 1 sec bins. Red curve is a Poisson curve with rate = median count rate of data. |
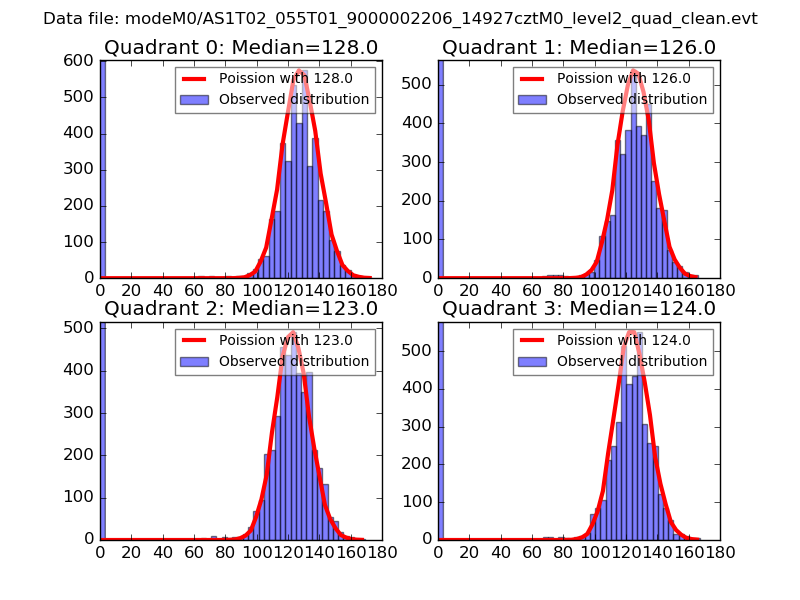 |
 |
| Quadrant-wise count rates Data is divided into 100 sec bins |
 |
|
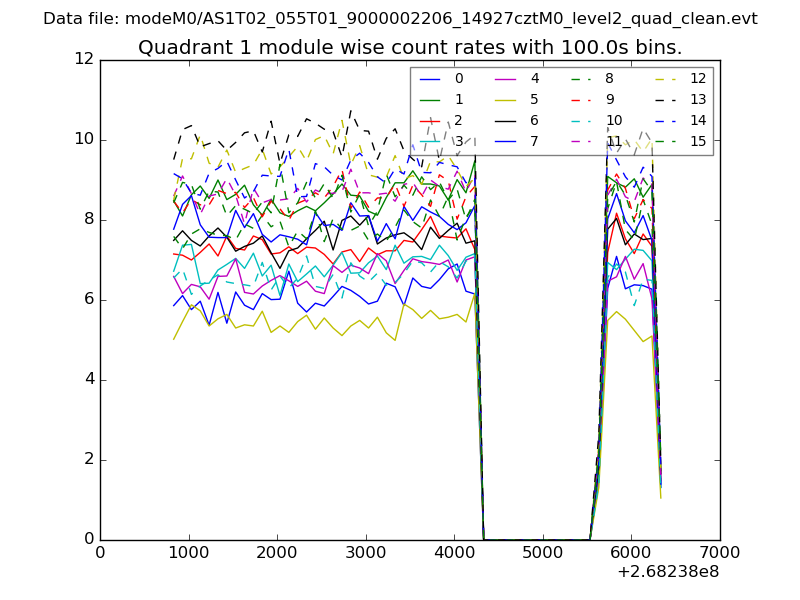
| Module-wise count rates for Quadrant A Data is divided into 100 sec bins |
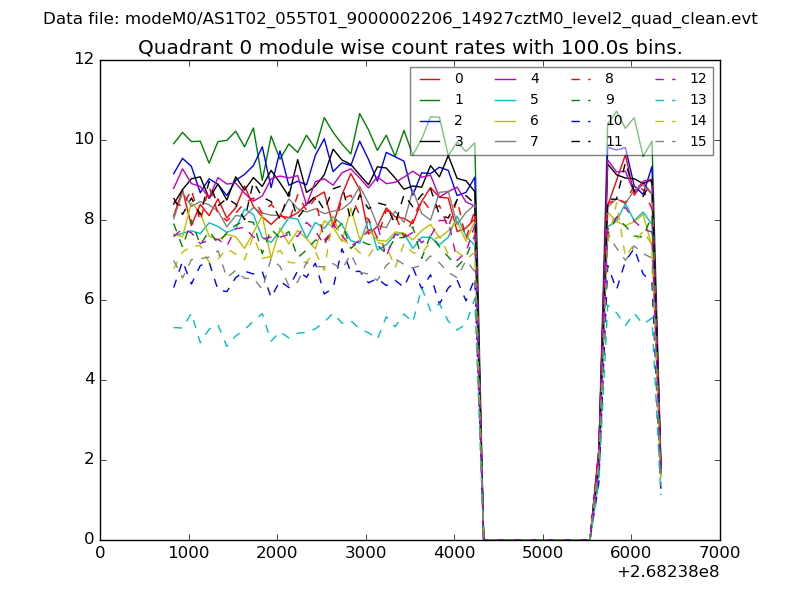 |
 |
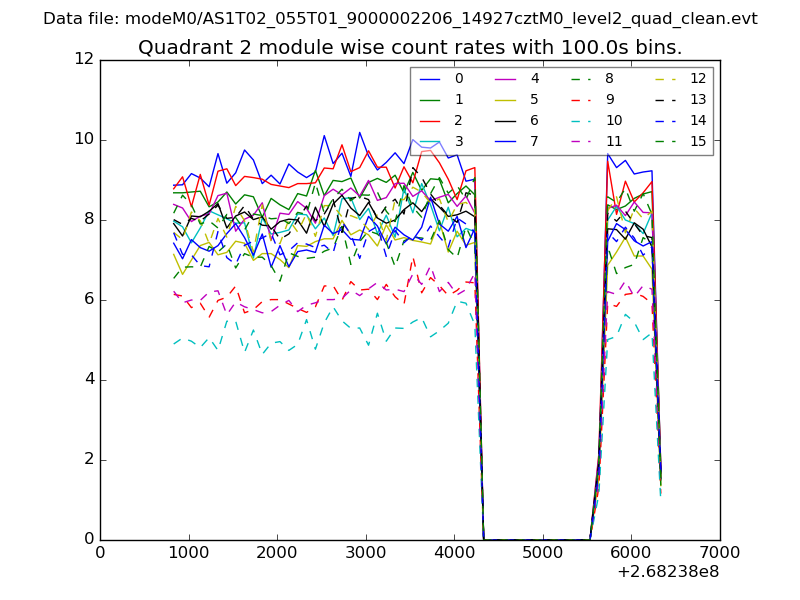
| Module-wise count rates for Quadrant B Data is divided into 100 sec bins |
 |
 |
| Module-wise count rates for Quadrant C Data is divided into 100 sec bins |
 |
 |
| Module-wise count rates for Quadrant D Data is divided into 100 sec bins |
 |
 |
| Parameter | Plot |
|---|---|
| CZT HV Monitor | 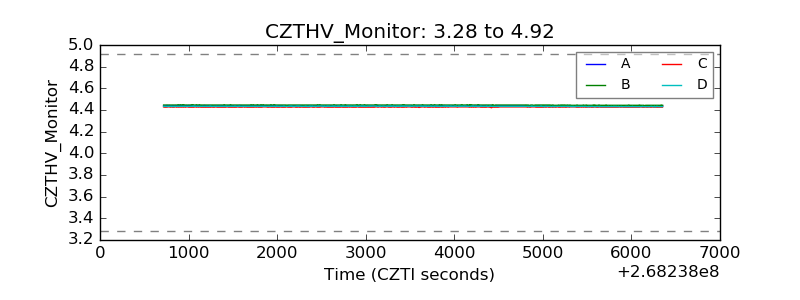 |
| D_VDD | 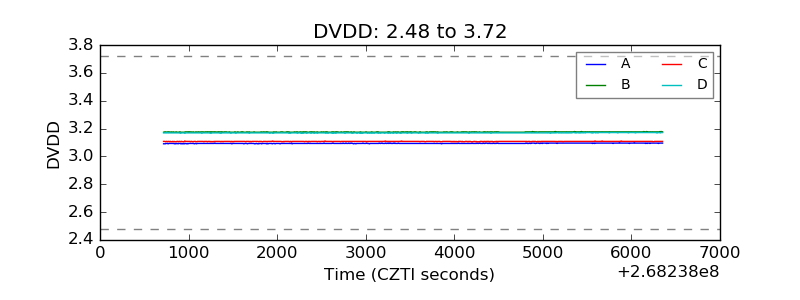 |
| Temperature 1 | 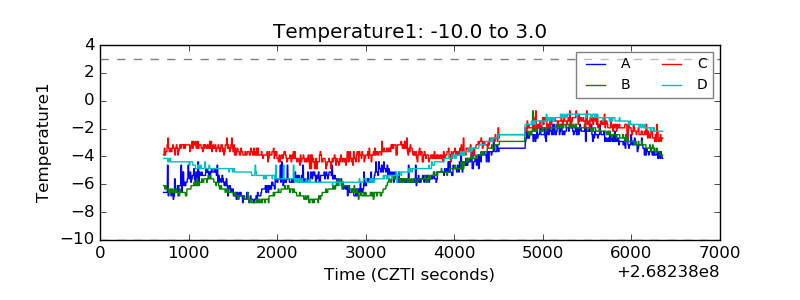 |
| Veto HV Monitor | 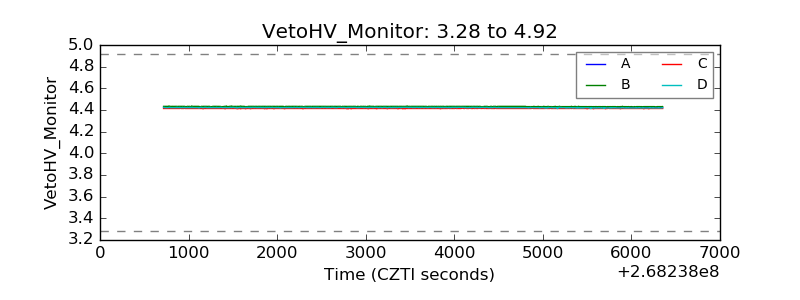 |
| Veto LLD |  |
| Alpha Counter |  |
| _CPM_Rate | 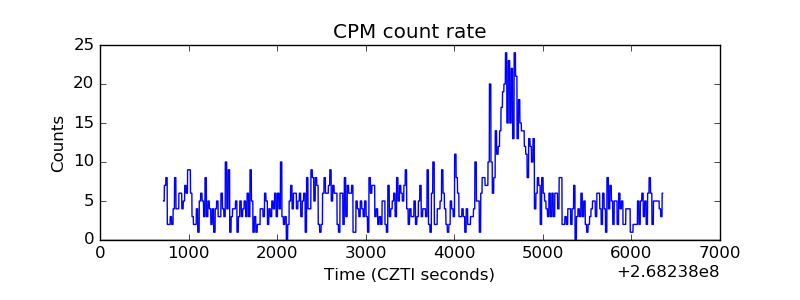 |
| CZT Counter | 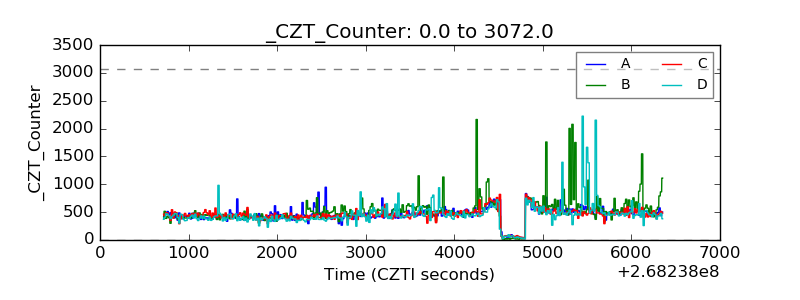 |
| +2.5 Volts monitor |  |
| +5 Volts monitor |  |
| _ROLL_ROT |  |
| _Roll_DEC | 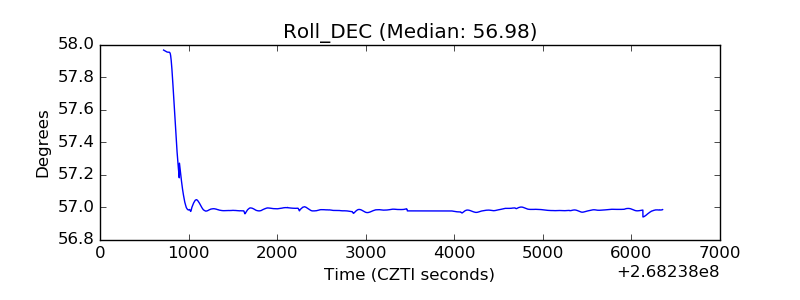 |
| _Roll_RA | 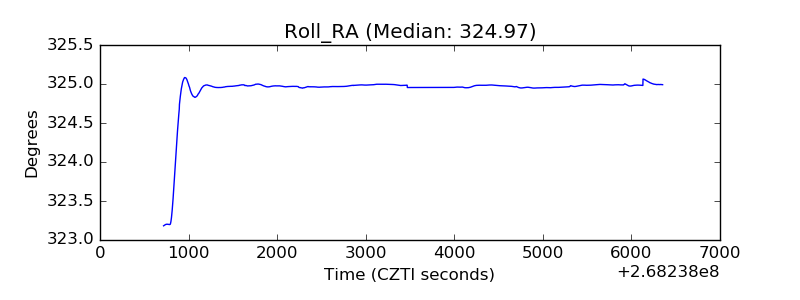 |
| Veto Counter |  |