| Param | Original file | Final file |
|---|---|---|
| Filename | modeM0/AS1T02_055T01_9000002206_14931cztM0_level2.evt | modeM0/AS1T02_055T01_9000002206_14931cztM0_level2_quad_clean.evt |
| Size (bytes) | 1,385,061,120 | 272,615,040 |
| Size | 1.3 GB | 260.0 MB |
| Events in quadrant A | 8,824,505 | 1,782,135 |
| Events in quadrant B | 13,790,603 | 1,720,926 |
| Events in quadrant C | 8,877,273 | 1,727,974 |
| Events in quadrant D | 9,171,413 | 1,718,204 |
| Mode M0 | |||
|---|---|---|---|
| Quadrant | BADHDUFLAG | Total packets | Discarded packets |
| A | 0 | 39097 | 5 |
| B | 0 | 54184 | 4 |
| C | 0 | 38909 | 4 |
| D | 0 | 41215 | 4 |
| Mode SS | |||
|---|---|---|---|
| Quadrant | BADHDUFLAG | Total packets | Discarded packets |
| A | 0 | 388 | 0 |
| B | 0 | 388 | 0 |
| C | 0 | 388 | 0 |
| D | 0 | 388 | 0 |
| Mode M9 | |||
|---|---|---|---|
| Quadrant | BADHDUFLAG | Total packets | Discarded packets |
| A | 0 | 23 | 0 |
| B | 0 | 23 | 0 |
| C | 0 | 23 | 0 |
| D | 0 | 23 | 0 |
| Quadrant | Total seconds | Saturated seconds | Saturation percentage |
|---|---|---|---|
| A | 18991 | 89 | 0.468643% |
| B | 18991 | 1277 | 6.724238% |
| C | 18991 | 100 | 0.526565% |
| D | 18991 | 122 | 0.642410% |
Noise dominated data is calculated using 1-second bins in cleaned event files. If a bin has >2000 counts, and if more than 50% of those come from <1% of pixels, then it is considered to be noise-dominated and hence unusable.
| Quadrant | # 1 sec bins | Bins with >0 counts | Bins with >2000 counts | High rate bins dominated by noise | Noise dominated (total time) | Noise dominated (detector-on time) | Marked lightcurve |
|---|---|---|---|---|---|---|---|
| A | 21247 | 18997 | 1 | 1 | 0.00% | 0.01% | 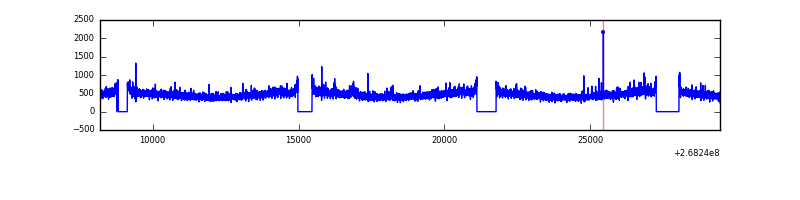 |
| B | 21247 | 18996 | 739 | 739 | 3.48% | 3.89% | 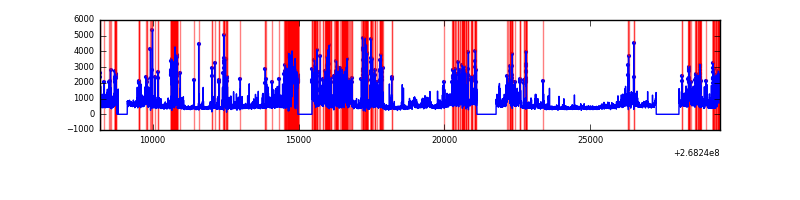 |
| C | 21247 | 18997 | 1 | 1 | 0.00% | 0.01% |  |
| D | 21247 | 18997 | 27 | 27 | 0.13% | 0.14% | 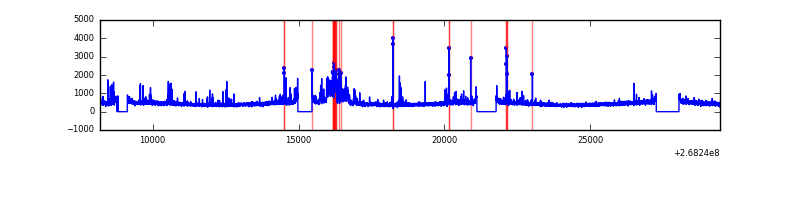 |
Top three noisy pixels from each quadrant. If the there are fewer than three noisy pixels in the level2.evt file, extra rows are filled as -1
| Pixel properties | Quadrant properties | ||||||
|---|---|---|---|---|---|---|---|
| Quadrant | DetID | PixID | Counts | Sigma | Mean | Median | Sigma |
| A | 12 | 189 | 137841 | 301.25 | 2231 | 2182 | 450.3 |
| A | 1 | 162 | 35116 | 73.14 | 2231 | 2182 | 450.3 |
| A | 9 | 143 | 21381 | 42.63 | 2231 | 2182 | 450.3 |
| B | 10 | 16 | 3941803 | 9615.96 | 2161 | 2103 | 409.7 |
| B | 0 | 219 | 818173 | 1991.85 | 2161 | 2103 | 409.7 |
| B | 0 | 189 | 186934 | 451.13 | 2161 | 2103 | 409.7 |
| C | 3 | 233 | 462129 | 926.99 | 2153 | 2159 | 496.2 |
| C | 13 | 61 | 15592 | 27.07 | 2153 | 2159 | 496.2 |
| C | 8 | 128 | 12735 | 21.31 | 2153 | 2159 | 496.2 |
| D | 7 | 254 | 670216 | 1316.37 | 2154 | 2100 | 507.5 |
| D | 13 | 249 | 118907 | 230.14 | 2154 | 2100 | 507.5 |
| D | 2 | 120 | 67727 | 129.3 | 2154 | 2100 | 507.5 |
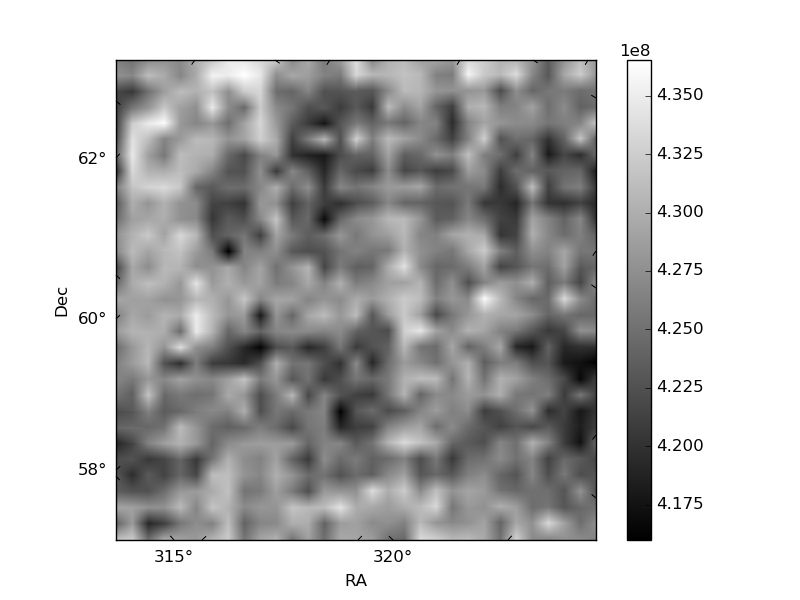
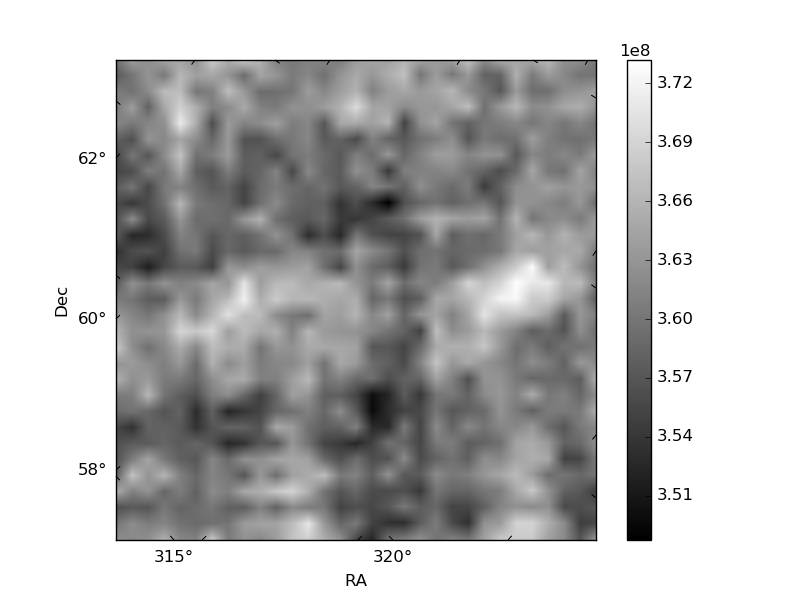
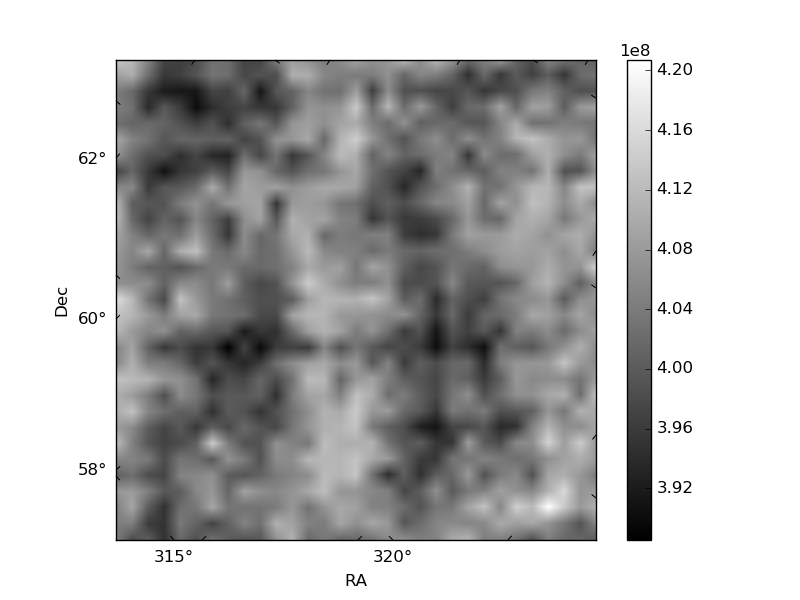
Histogram calculated using DETX and DETY for each event in the final _common_clean file
| Quadrant A |  |
 |
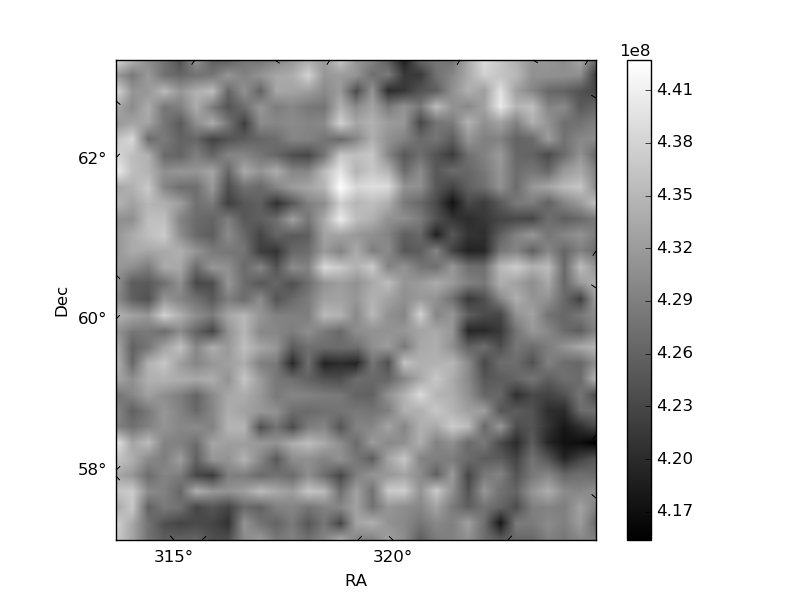
Quadrant B |
|---|---|---|---|
| Quadrant D | 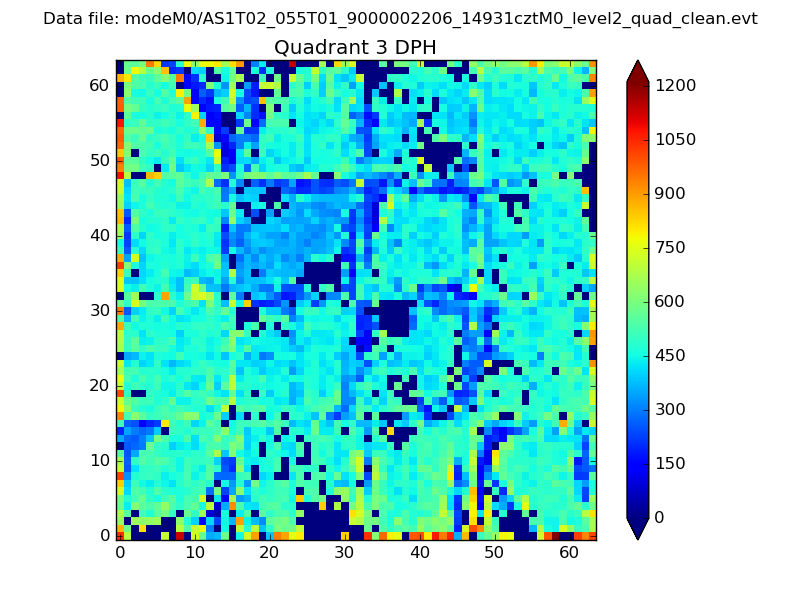 |
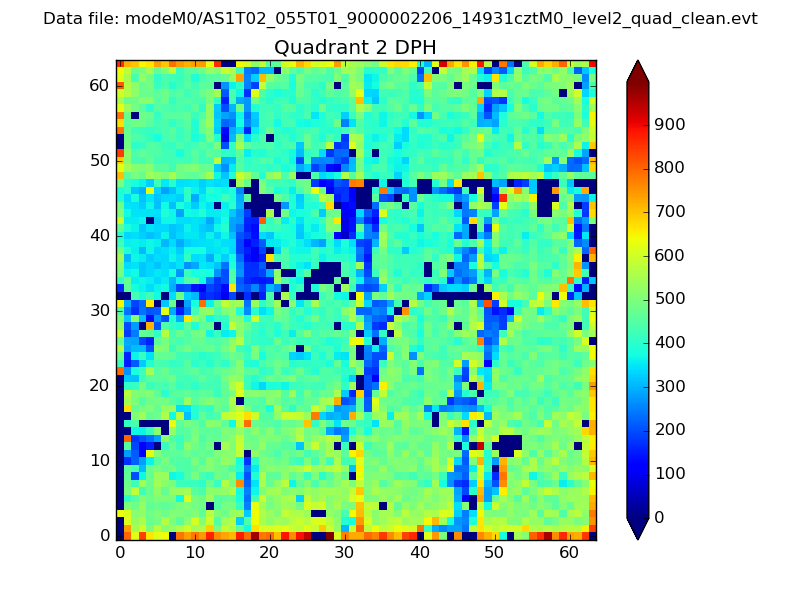 |
Quadrant C |
| Plot type | Count rate plots | Images |
|---|---|---|
| Comparison with Poisson distribution Blue bars denote a histogram of data divided into 1 sec bins. Red curve is a Poisson curve with rate = median count rate of data. |
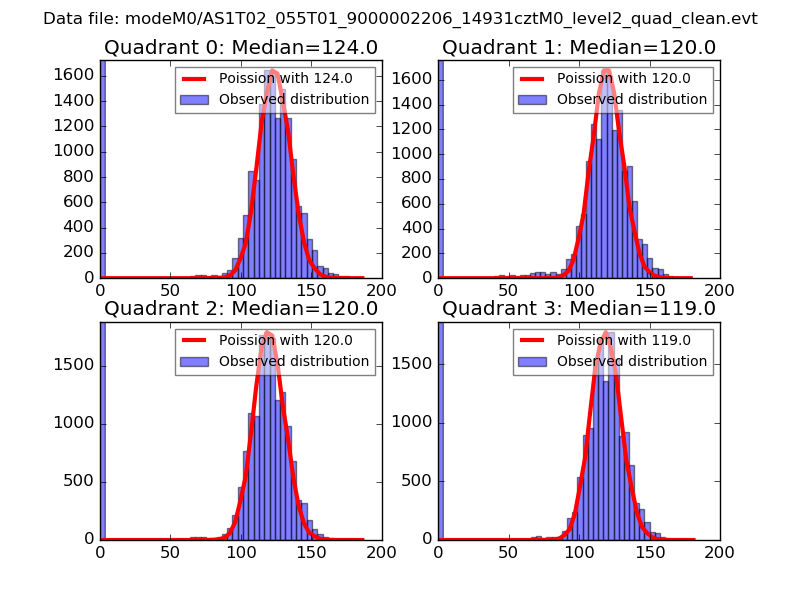 |
 |
| Quadrant-wise count rates Data is divided into 100 sec bins |
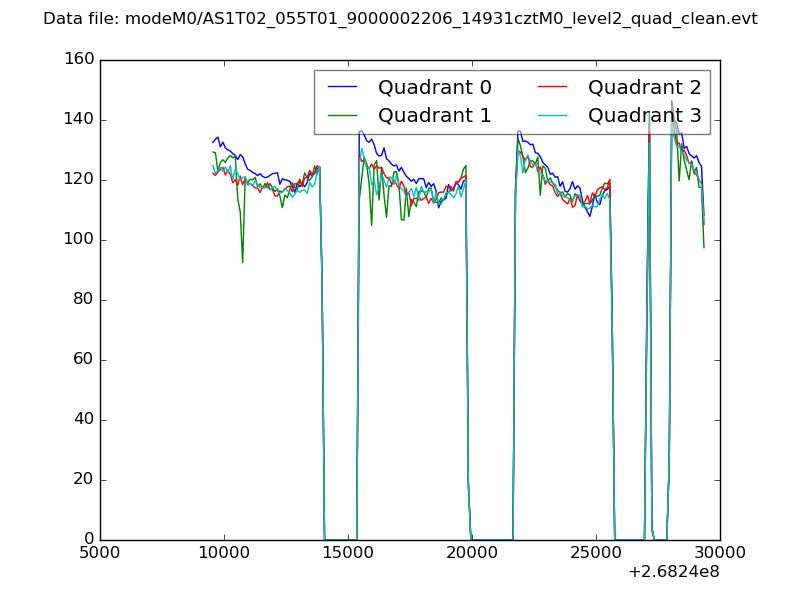 |
|
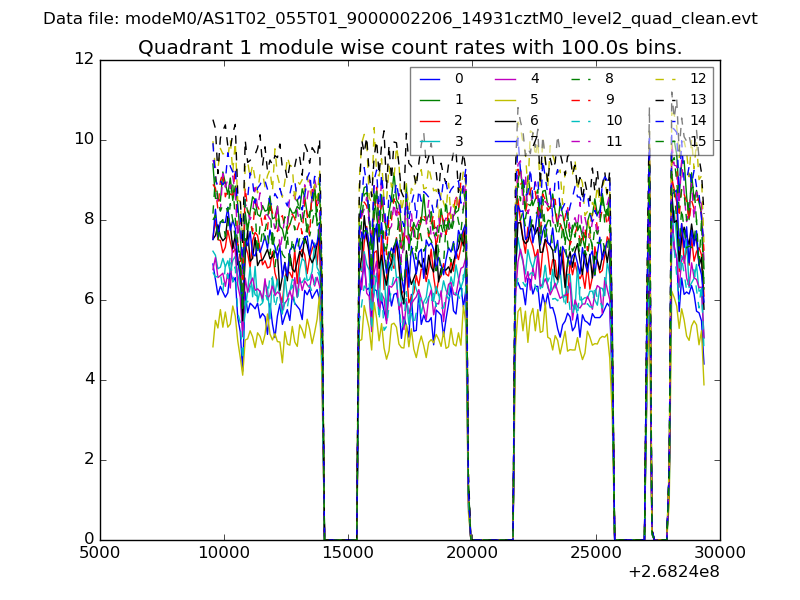
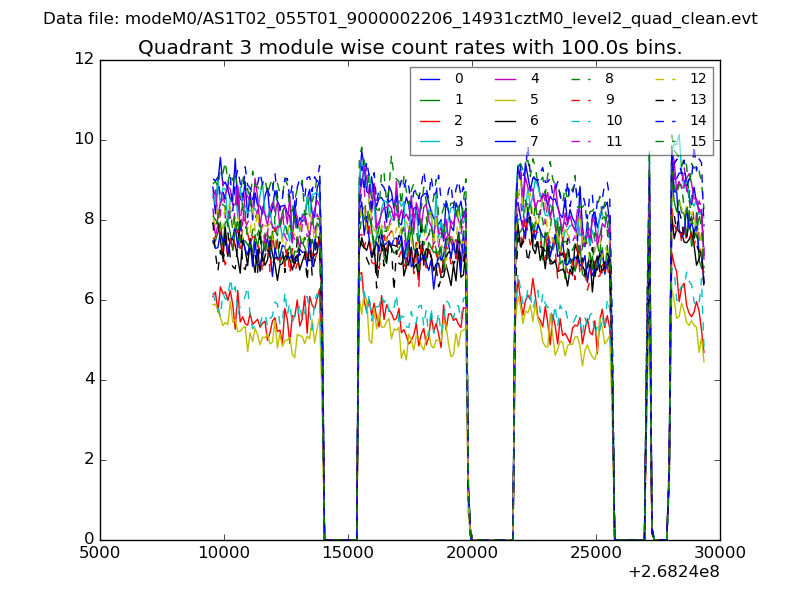
| Module-wise count rates for Quadrant A Data is divided into 100 sec bins |
 |
 |
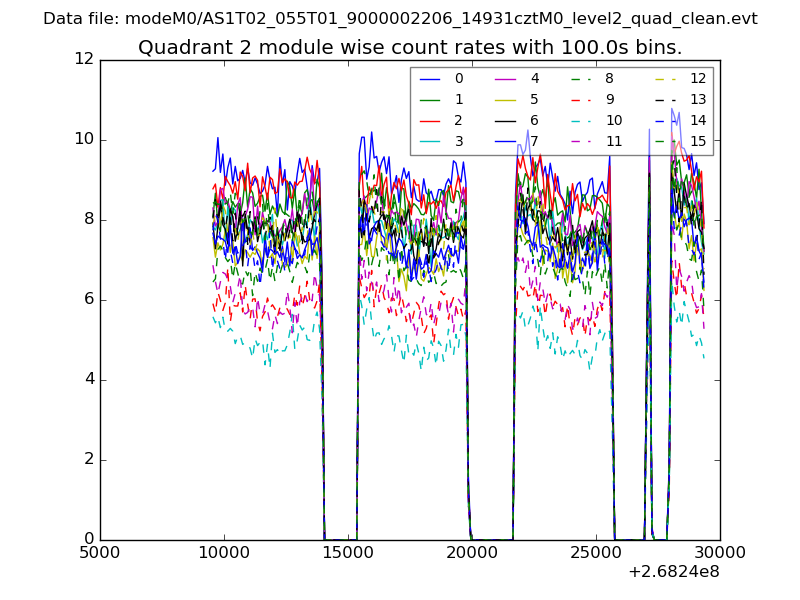
| Module-wise count rates for Quadrant B Data is divided into 100 sec bins |
 |
 |
| Module-wise count rates for Quadrant C Data is divided into 100 sec bins |
 |
 |
| Module-wise count rates for Quadrant D Data is divided into 100 sec bins |
 |
 |
| Parameter | Plot |
|---|---|
| CZT HV Monitor |  |
| D_VDD | 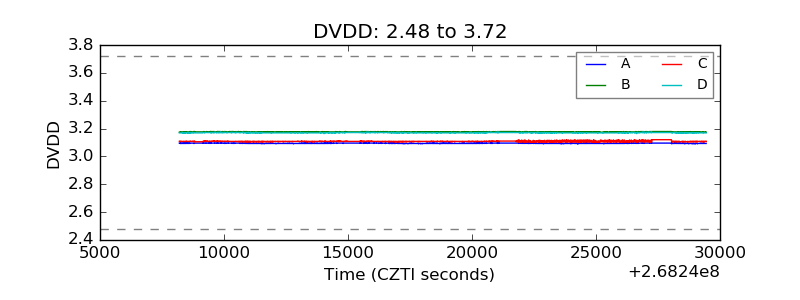 |
| Temperature 1 | 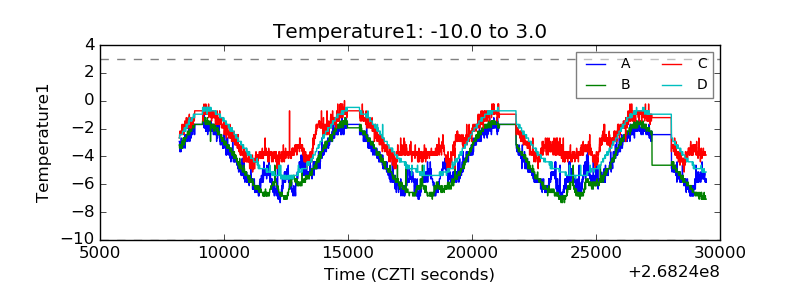 |
| Veto HV Monitor | 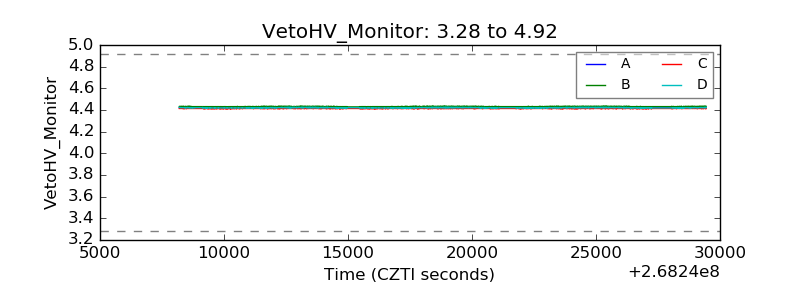 |
| Veto LLD | 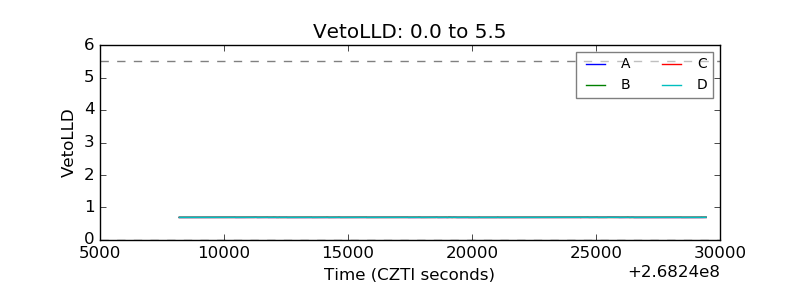 |
| Alpha Counter | 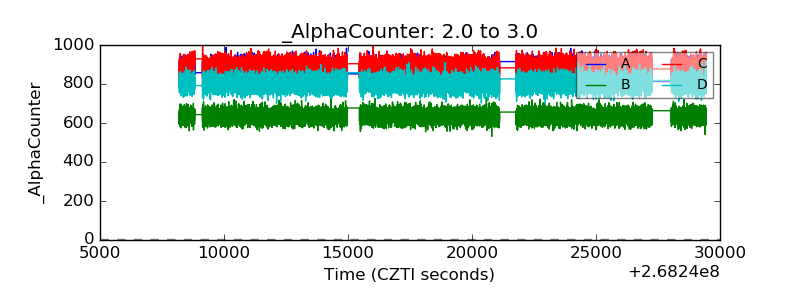 |
| _CPM_Rate | 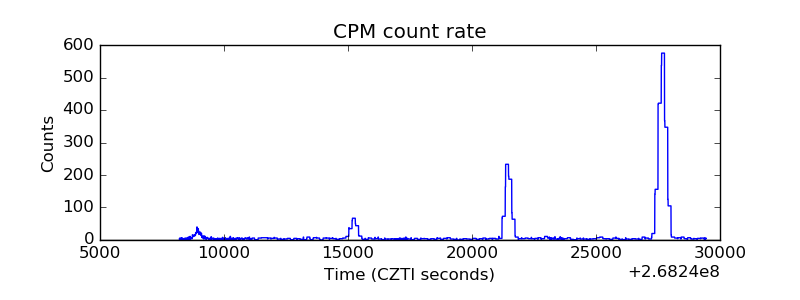 |
| CZT Counter | 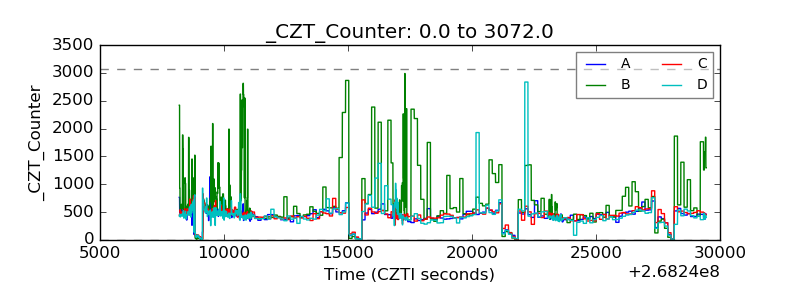 |
| +2.5 Volts monitor |  |
| +5 Volts monitor |  |
| _ROLL_ROT | 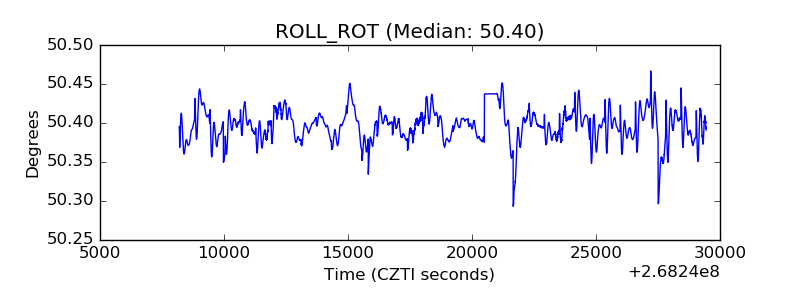 |
| _Roll_DEC | 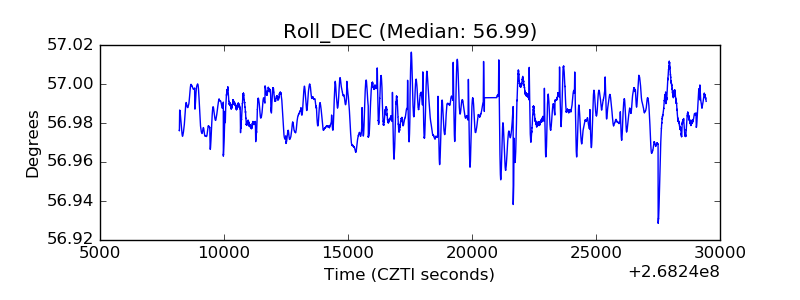 |
| _Roll_RA | 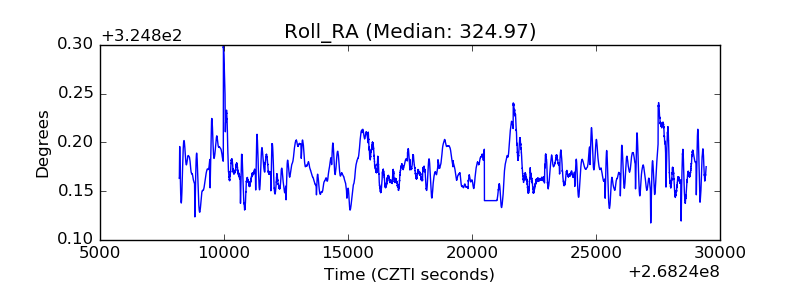 |
| Veto Counter | 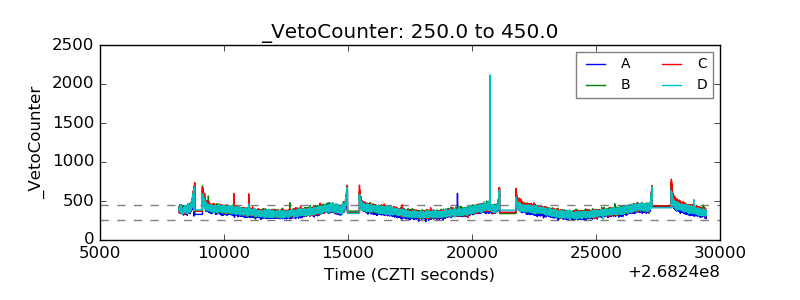 |