| Param | Original file | Final file |
|---|---|---|
| Filename | modeM0/AS1T02_055T01_9000002206_14932cztM0_level2.evt | modeM0/AS1T02_055T01_9000002206_14932cztM0_level2_quad_clean.evt |
| Size (bytes) | 529,755,840 | 102,752,640 |
| Size | 505.2 MB | 98.0 MB |
| Events in quadrant A | 3,148,128 | 680,169 |
| Events in quadrant B | 6,225,663 | 634,053 |
| Events in quadrant C | 3,137,542 | 667,080 |
| Events in quadrant D | 3,074,070 | 659,538 |
| Mode M0 | |||
|---|---|---|---|
| Quadrant | BADHDUFLAG | Total packets | Discarded packets |
| A | 0 | 13954 | 3 |
| B | 0 | 22991 | 2 |
| C | 0 | 13807 | 2 |
| D | 0 | 13997 | 2 |
| Mode SS | |||
|---|---|---|---|
| Quadrant | BADHDUFLAG | Total packets | Discarded packets |
| A | 0 | 138 | 0 |
| B | 0 | 138 | 0 |
| C | 0 | 138 | 0 |
| D | 0 | 138 | 0 |
| Mode M9 | |||
|---|---|---|---|
| Quadrant | BADHDUFLAG | Total packets | Discarded packets |
| A | 0 | 13 | 0 |
| B | 0 | 13 | 0 |
| C | 0 | 13 | 0 |
| D | 0 | 14 | 0 |
| Quadrant | Total seconds | Saturated seconds | Saturation percentage |
|---|---|---|---|
| A | 6750 | 19 | 0.281481% |
| B | 6750 | 750 | 11.111111% |
| C | 6750 | 12 | 0.177778% |
| D | 6750 | 14 | 0.207407% |
Noise dominated data is calculated using 1-second bins in cleaned event files. If a bin has >2000 counts, and if more than 50% of those come from <1% of pixels, then it is considered to be noise-dominated and hence unusable.
| Quadrant | # 1 sec bins | Bins with >0 counts | Bins with >2000 counts | High rate bins dominated by noise | Noise dominated (total time) | Noise dominated (detector-on time) | Marked lightcurve |
|---|---|---|---|---|---|---|---|
| A | 7711 | 6752 | 4 | 4 | 0.05% | 0.06% | 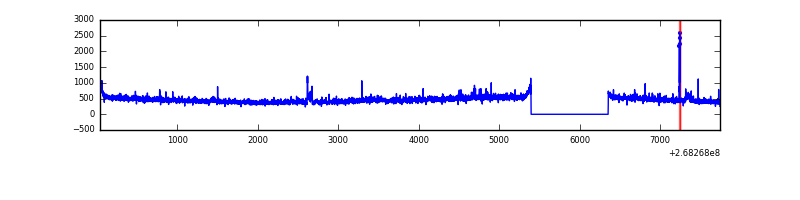 |
| B | 7711 | 6752 | 501 | 501 | 6.50% | 7.42% | 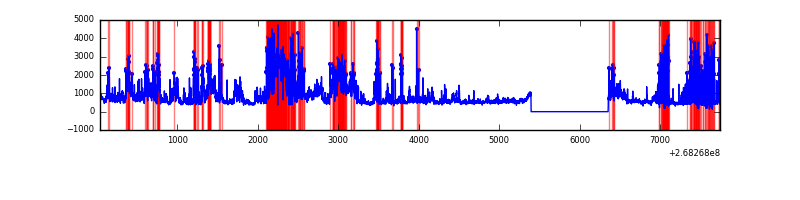 |
| C | 7711 | 6752 | 0 | 0 | 0.00% | 0.00% | 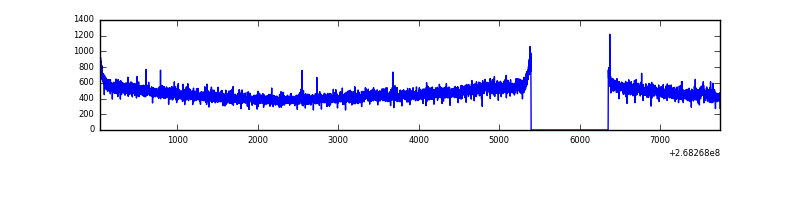 |
| D | 7711 | 6752 | 1 | 1 | 0.01% | 0.01% | 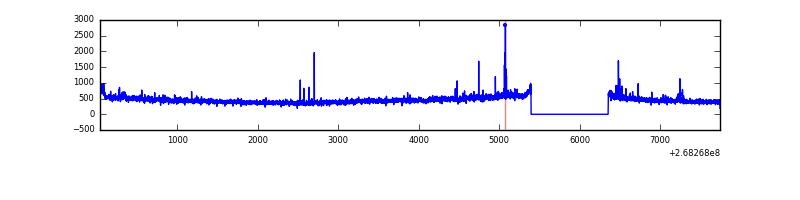 |
Top three noisy pixels from each quadrant. If the there are fewer than three noisy pixels in the level2.evt file, extra rows are filled as -1
| Pixel properties | Quadrant properties | ||||||
|---|---|---|---|---|---|---|---|
| Quadrant | DetID | PixID | Counts | Sigma | Mean | Median | Sigma |
| A | 12 | 189 | 62027 | 387.41 | 784 | 766 | 158.1 |
| A | 4 | 2 | 36778 | 227.74 | 784 | 766 | 158.1 |
| A | 13 | 252 | 11179 | 65.85 | 784 | 766 | 158.1 |
| B | 10 | 16 | 2237711 | 15542.48 | 754 | 734 | 143.9 |
| B | 0 | 219 | 665238 | 4616.96 | 754 | 734 | 143.9 |
| B | 0 | 229 | 244871 | 1696.26 | 754 | 734 | 143.9 |
| C | 3 | 233 | 160484 | 909.0 | 762 | 767 | 175.7 |
| C | 13 | 61 | 5468 | 26.75 | 762 | 767 | 175.7 |
| C | 7 | 222 | 2660 | 10.77 | 762 | 767 | 175.7 |
| D | 7 | 254 | 123557 | 678.85 | 759 | 739 | 180.9 |
| D | 2 | 152 | 25238 | 135.41 | 759 | 739 | 180.9 |
| D | 10 | 70 | 23406 | 125.29 | 759 | 739 | 180.9 |
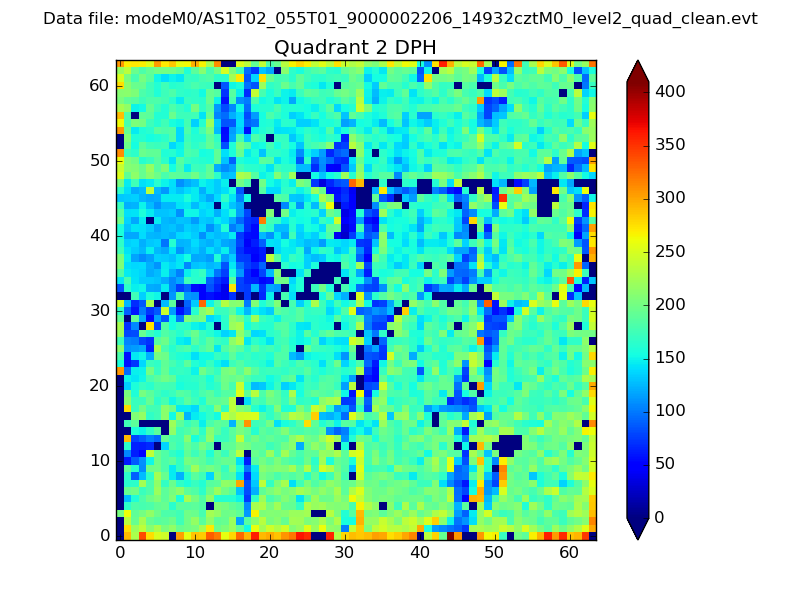
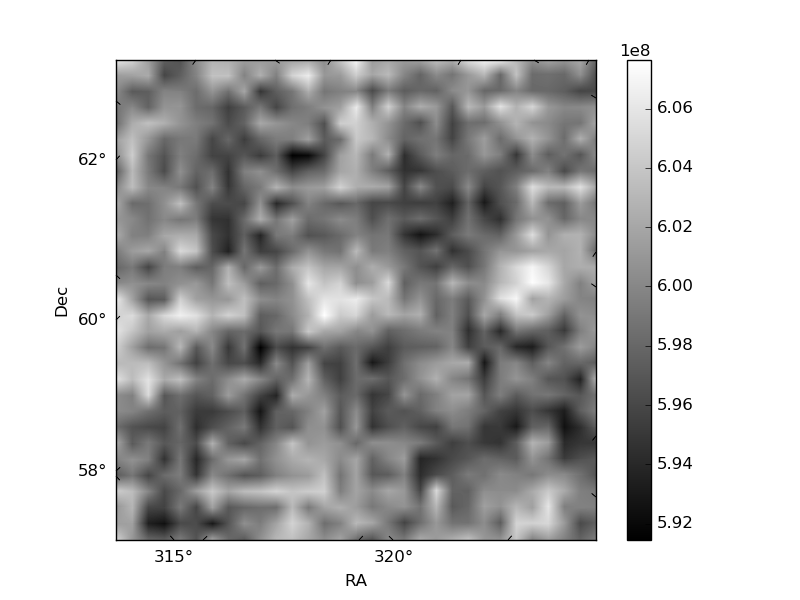
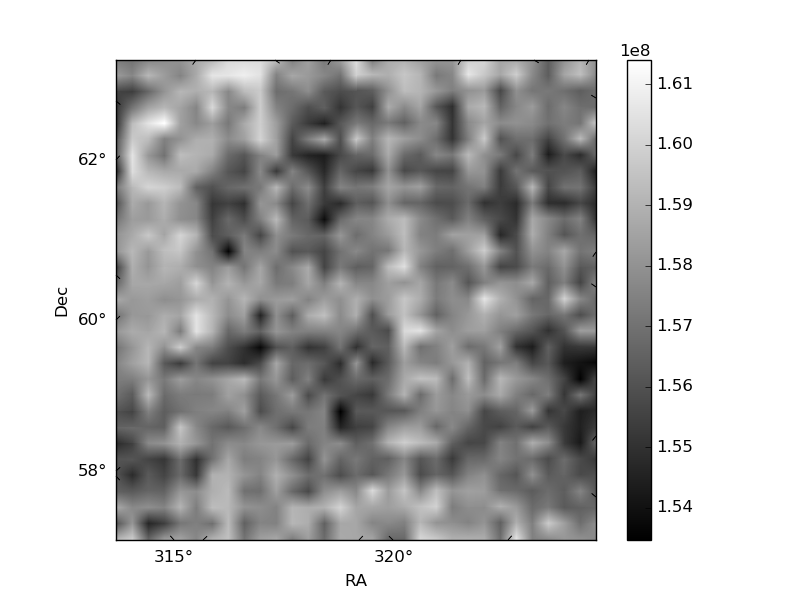
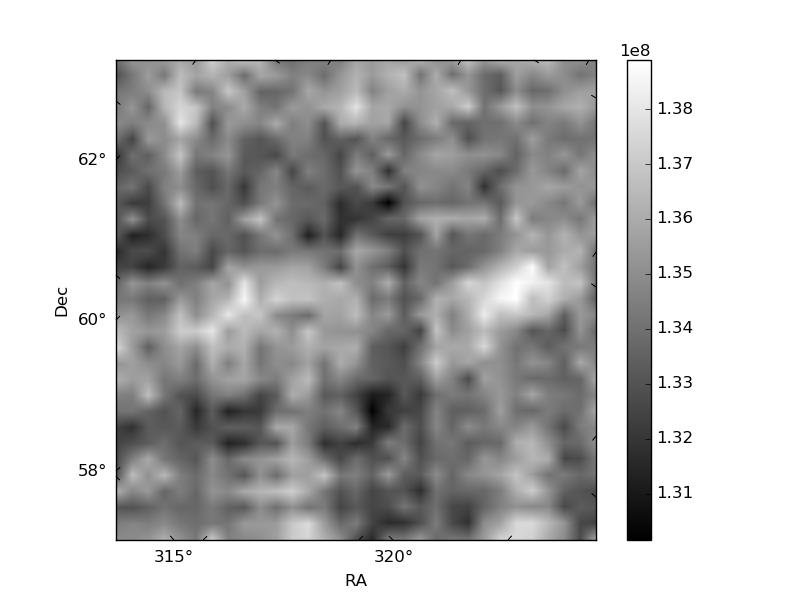
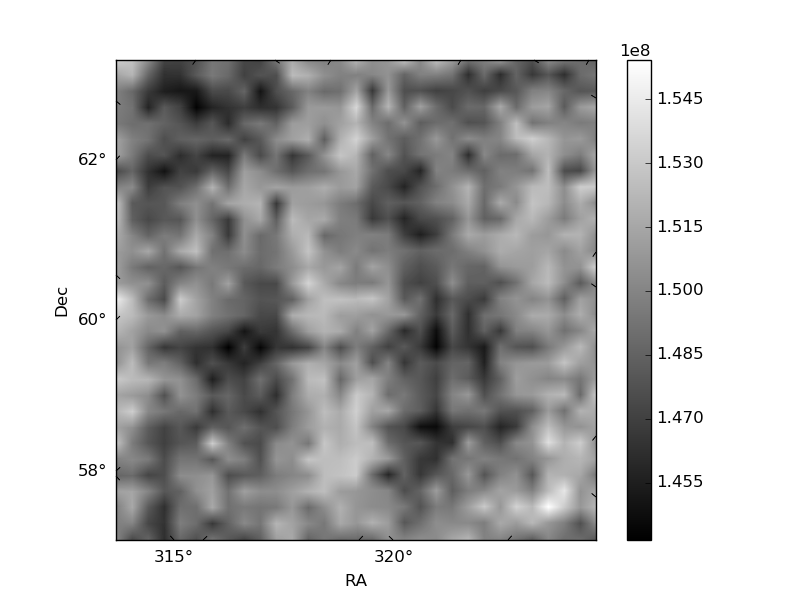
Histogram calculated using DETX and DETY for each event in the final _common_clean file
| Quadrant A | 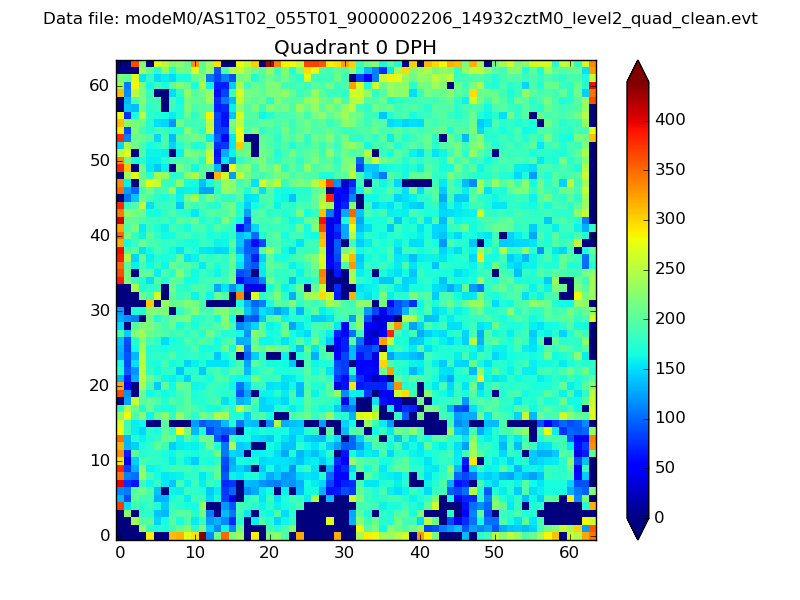 |
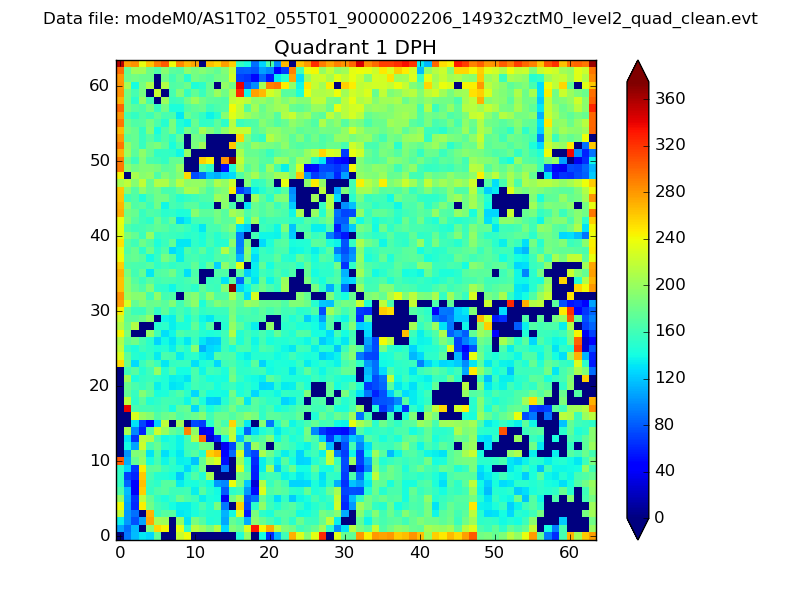 |
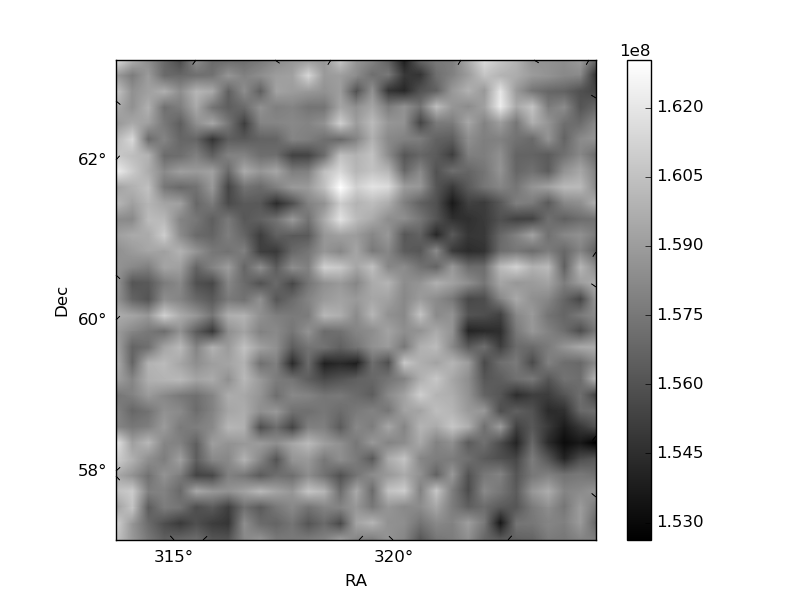
Quadrant B |
|---|---|---|---|
| Quadrant D | 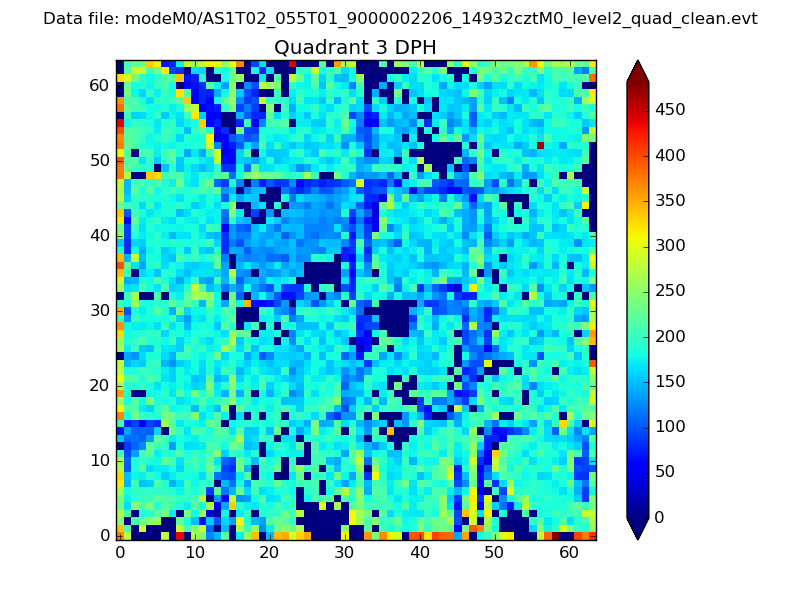 |
 |
Quadrant C |
| Plot type | Count rate plots | Images |
|---|---|---|
| Comparison with Poisson distribution Blue bars denote a histogram of data divided into 1 sec bins. Red curve is a Poisson curve with rate = median count rate of data. |
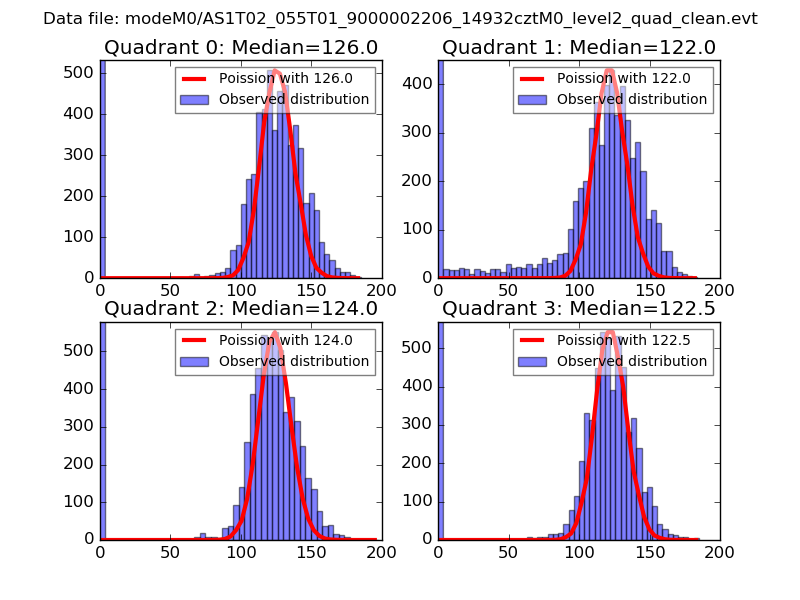 |
 |
| Quadrant-wise count rates Data is divided into 100 sec bins |
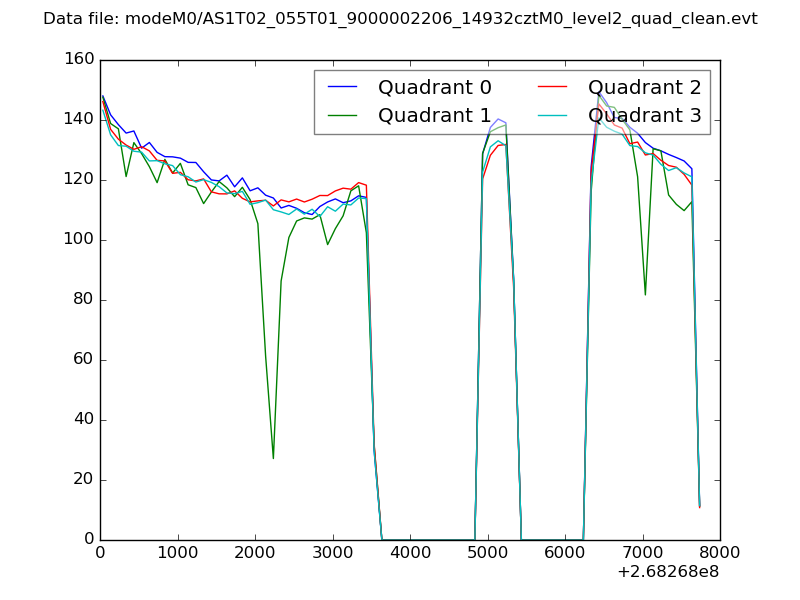 |
|
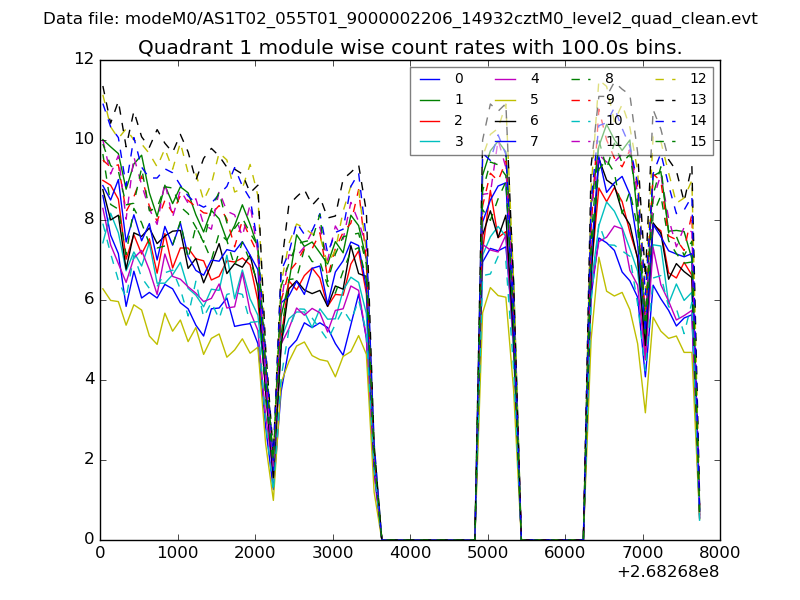
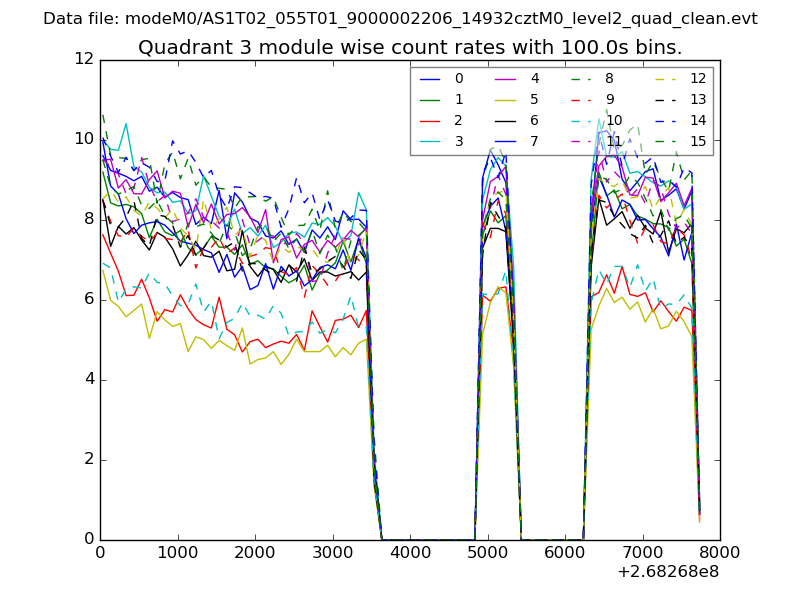
| Module-wise count rates for Quadrant A Data is divided into 100 sec bins |
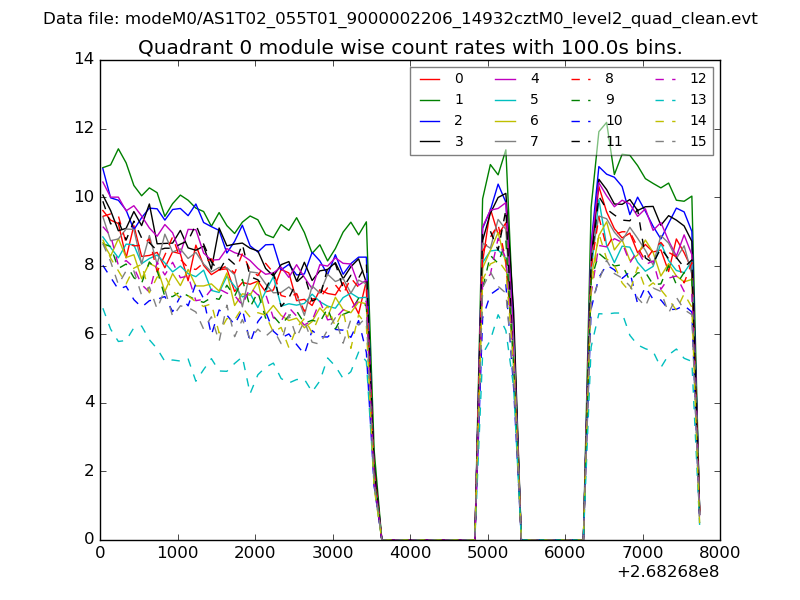 |
 |
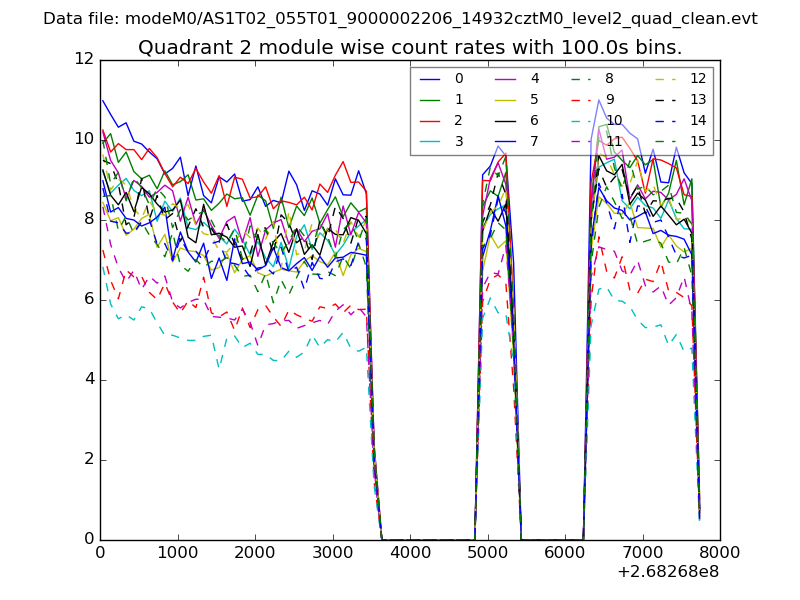
| Module-wise count rates for Quadrant B Data is divided into 100 sec bins |
 |
 |
| Module-wise count rates for Quadrant C Data is divided into 100 sec bins |
 |
 |
| Module-wise count rates for Quadrant D Data is divided into 100 sec bins |
 |
 |
| Parameter | Plot |
|---|---|
| CZT HV Monitor | 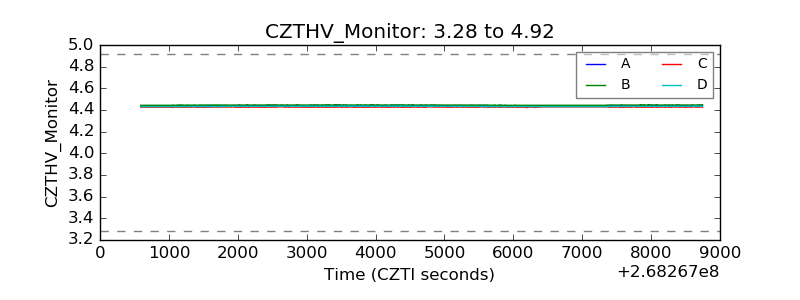 |
| D_VDD | 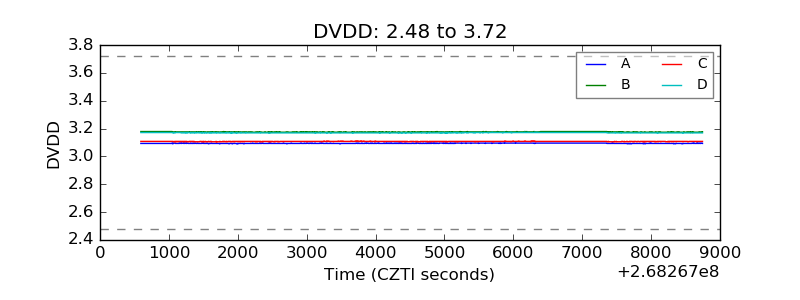 |
| Temperature 1 | 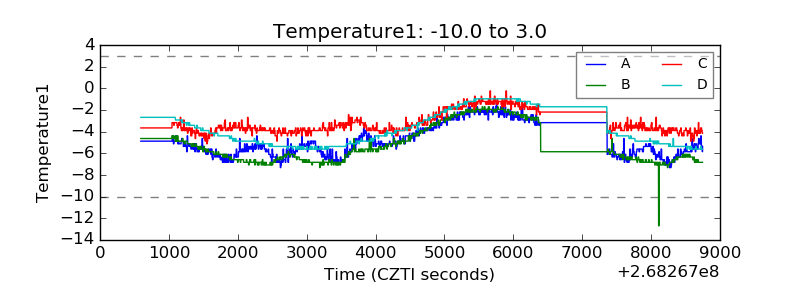 |
| Veto HV Monitor | 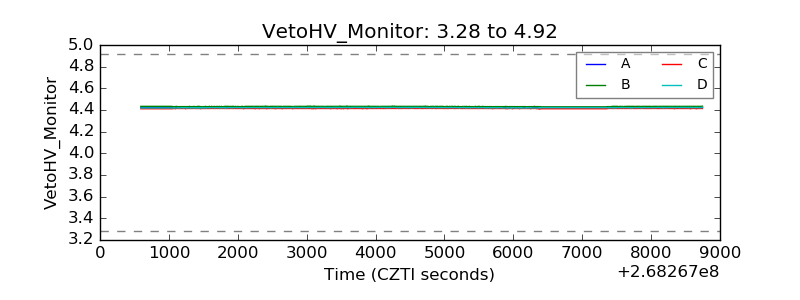 |
| Veto LLD | 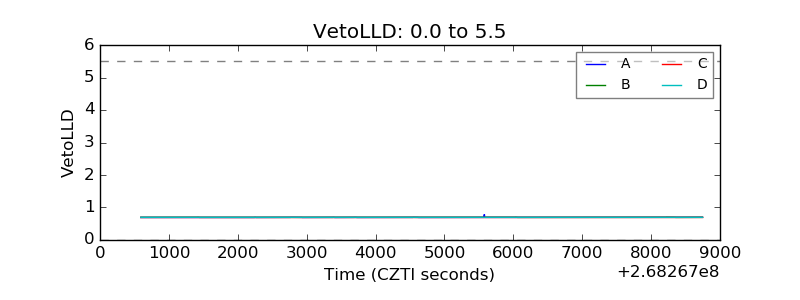 |
| Alpha Counter | 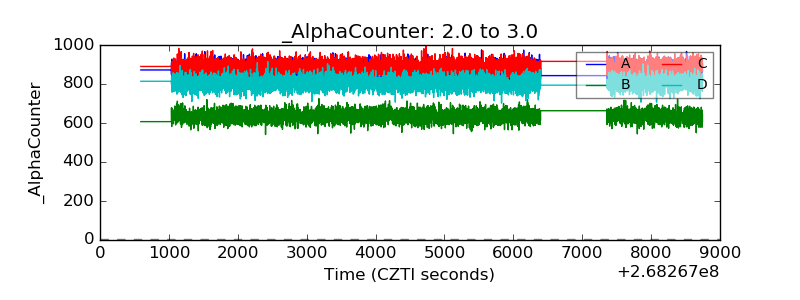 |
| _CPM_Rate | 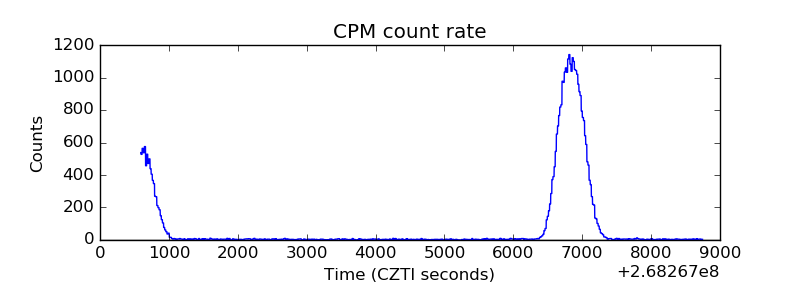 |
| CZT Counter | 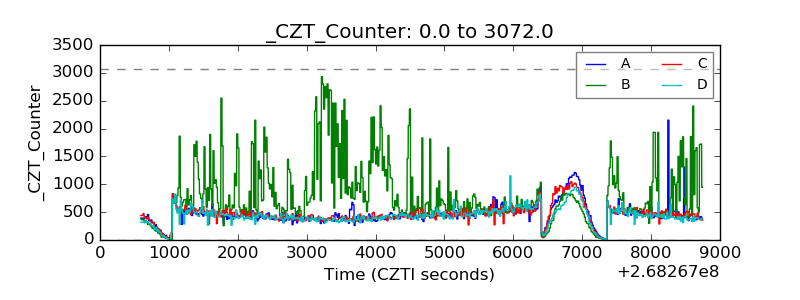 |
| +2.5 Volts monitor |  |
| +5 Volts monitor |  |
| _ROLL_ROT | 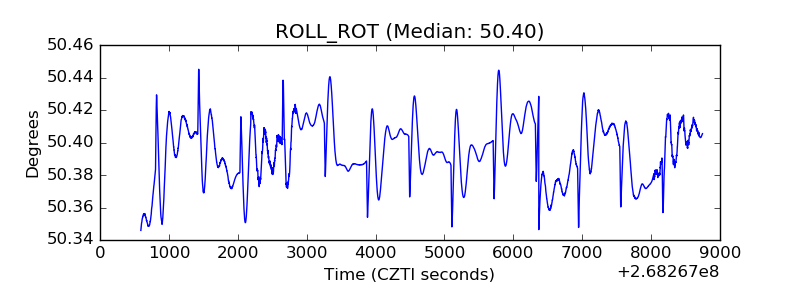 |
| _Roll_DEC | 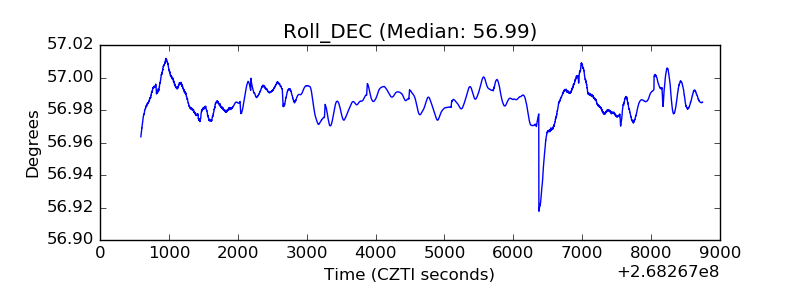 |
| _Roll_RA | 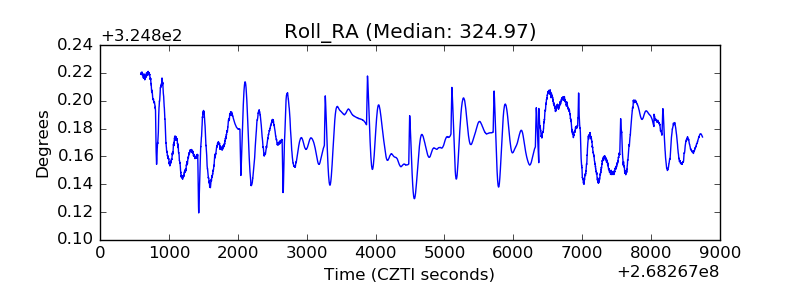 |
| Veto Counter | 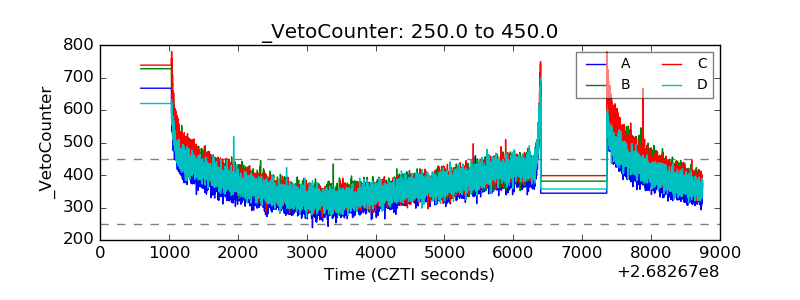 |