| Param | Original file | Final file |
|---|---|---|
| Filename | modeM0/AS1T02_055T01_9000002206_14936cztM0_level2.evt | modeM0/AS1T02_055T01_9000002206_14936cztM0_level2_quad_clean.evt |
| Size (bytes) | 495,584,640 | 89,470,080 |
| Size | 472.6 MB | 85.3 MB |
| Events in quadrant A | 2,864,868 | 611,914 |
| Events in quadrant B | 5,142,135 | 578,611 |
| Events in quadrant C | 2,681,845 | 589,833 |
| Events in quadrant D | 3,937,820 | 535,043 |
| Mode M0 | |||
|---|---|---|---|
| Quadrant | BADHDUFLAG | Total packets | Discarded packets |
| A | 0 | 12029 | 2 |
| B | 0 | 19117 | 1 |
| C | 0 | 11521 | 1 |
| D | 0 | 15622 | 1 |
| Mode SS | |||
|---|---|---|---|
| Quadrant | BADHDUFLAG | Total packets | Discarded packets |
| A | 0 | 114 | 0 |
| B | 0 | 114 | 0 |
| C | 0 | 114 | 0 |
| D | 0 | 114 | 0 |
| Mode M9 | |||
|---|---|---|---|
| Quadrant | BADHDUFLAG | Total packets | Discarded packets |
| A | 0 | 13 | 0 |
| B | 0 | 13 | 0 |
| C | 0 | 13 | 0 |
| D | 0 | 13 | 0 |
| Quadrant | Total seconds | Saturated seconds | Saturation percentage |
|---|---|---|---|
| A | 5632 | 35 | 0.621449% |
| B | 5632 | 747 | 13.263494% |
| C | 5632 | 11 | 0.195312% |
| D | 5632 | 507 | 9.002131% |
Noise dominated data is calculated using 1-second bins in cleaned event files. If a bin has >2000 counts, and if more than 50% of those come from <1% of pixels, then it is considered to be noise-dominated and hence unusable.
| Quadrant | # 1 sec bins | Bins with >0 counts | Bins with >2000 counts | High rate bins dominated by noise | Noise dominated (total time) | Noise dominated (detector-on time) | Marked lightcurve |
|---|---|---|---|---|---|---|---|
| A | 6898 | 5634 | 4 | 4 | 0.06% | 0.07% | 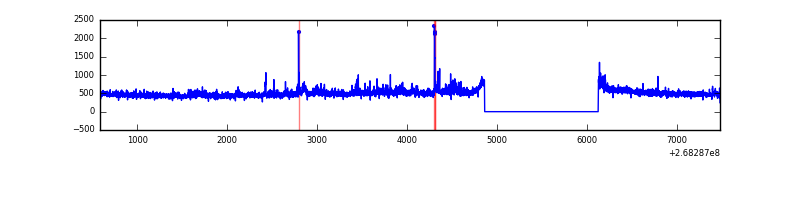 |
| B | 6898 | 5634 | 496 | 496 | 7.19% | 8.80% | 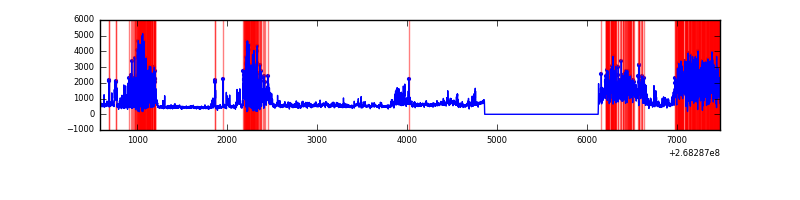 |
| C | 6898 | 5634 | 0 | 0 | 0.00% | 0.00% | 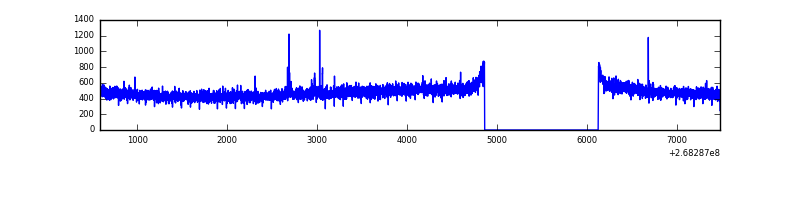 |
| D | 6898 | 5634 | 447 | 447 | 6.48% | 7.93% |  |
Top three noisy pixels from each quadrant. If the there are fewer than three noisy pixels in the level2.evt file, extra rows are filled as -1
| Pixel properties | Quadrant properties | ||||||
|---|---|---|---|---|---|---|---|
| Quadrant | DetID | PixID | Counts | Sigma | Mean | Median | Sigma |
| A | 12 | 189 | 154666 | 1081.14 | 696 | 682 | 142.4 |
| A | 3 | 1 | 23008 | 156.75 | 696 | 682 | 142.4 |
| A | 0 | 226 | 6387 | 40.05 | 696 | 682 | 142.4 |
| B | 10 | 16 | 2251404 | 18098.27 | 663 | 648 | 124.4 |
| B | 0 | 219 | 198259 | 1588.98 | 663 | 648 | 124.4 |
| B | 0 | 229 | 63132 | 502.43 | 663 | 648 | 124.4 |
| C | 3 | 233 | 110956 | 733.22 | 656 | 659 | 150.4 |
| C | 10 | 22 | 11569 | 72.53 | 656 | 659 | 150.4 |
| C | 13 | 61 | 4724 | 27.02 | 656 | 659 | 150.4 |
| D | 13 | 249 | 712773 | 4771.75 | 630 | 615 | 149.2 |
| D | 7 | 254 | 666675 | 4462.87 | 630 | 615 | 149.2 |
| D | 13 | 104 | 105332 | 701.65 | 630 | 615 | 149.2 |
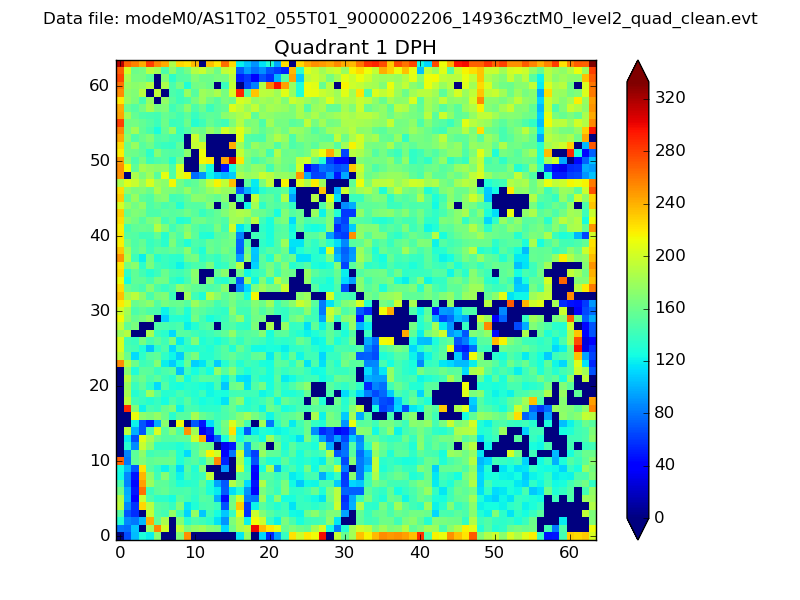
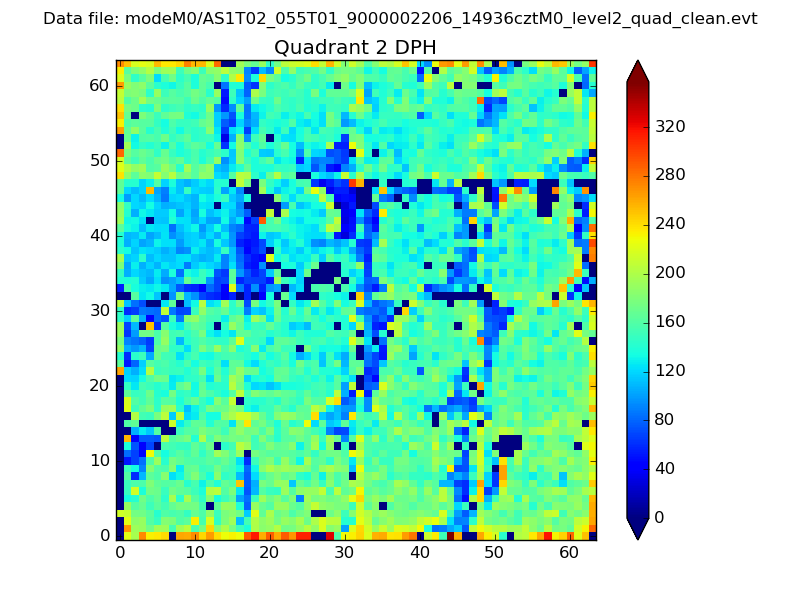
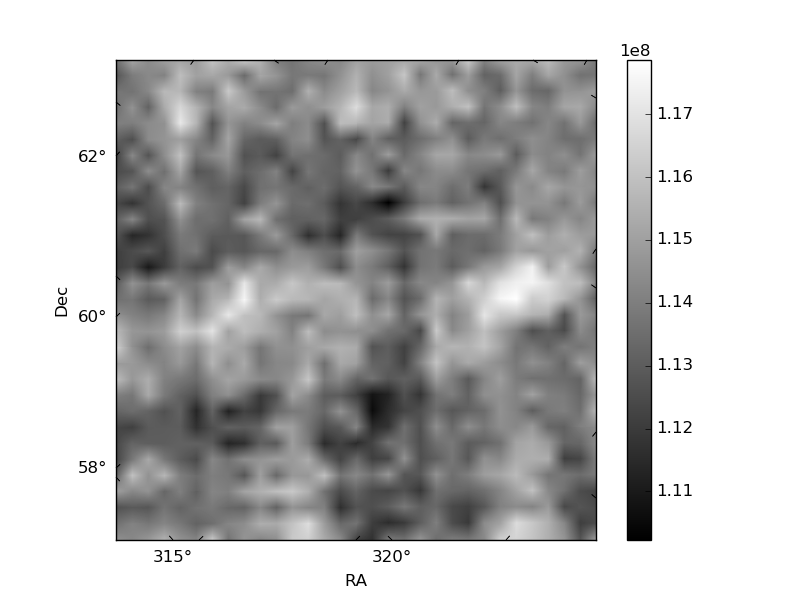
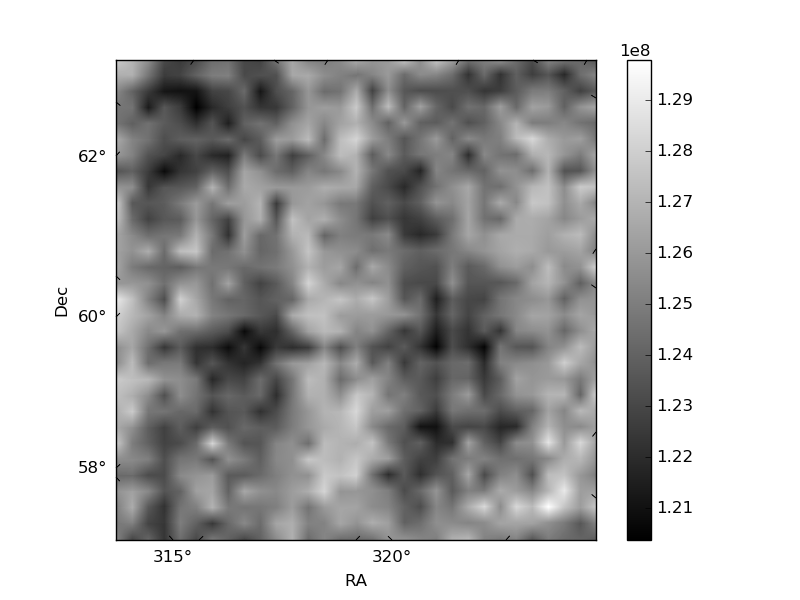
Histogram calculated using DETX and DETY for each event in the final _common_clean file
| Quadrant A | 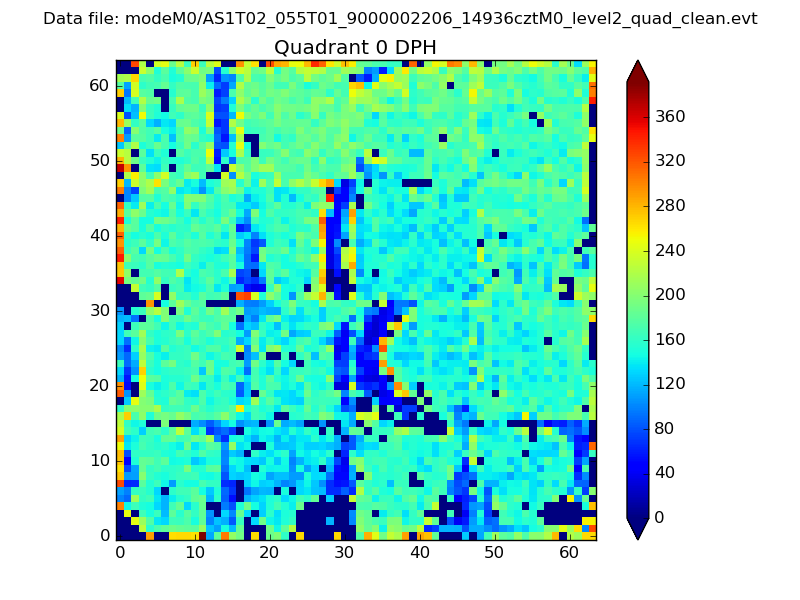 |
 |
Quadrant B |
|---|---|---|---|
| Quadrant D | 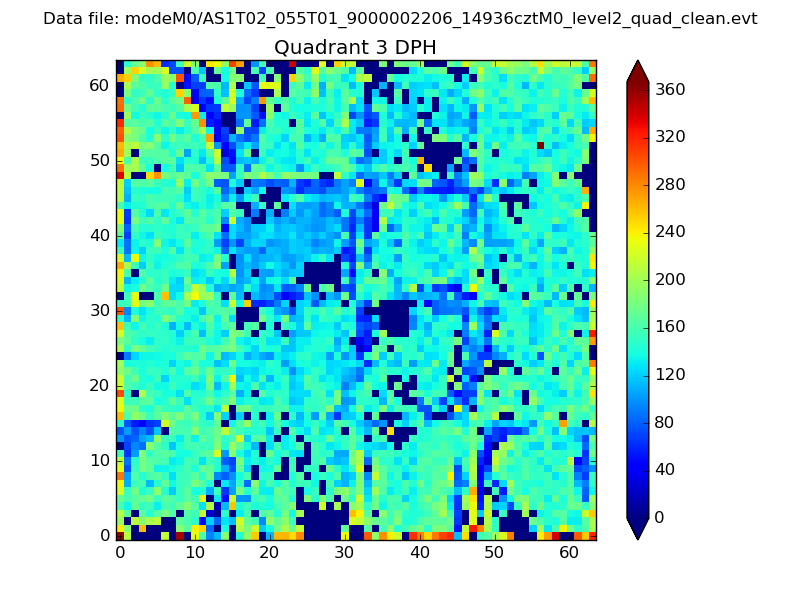 |
 |
Quadrant C |
| Plot type | Count rate plots | Images |
|---|---|---|
| Comparison with Poisson distribution Blue bars denote a histogram of data divided into 1 sec bins. Red curve is a Poisson curve with rate = median count rate of data. |
 |
 |
| Quadrant-wise count rates Data is divided into 100 sec bins |
 |
|
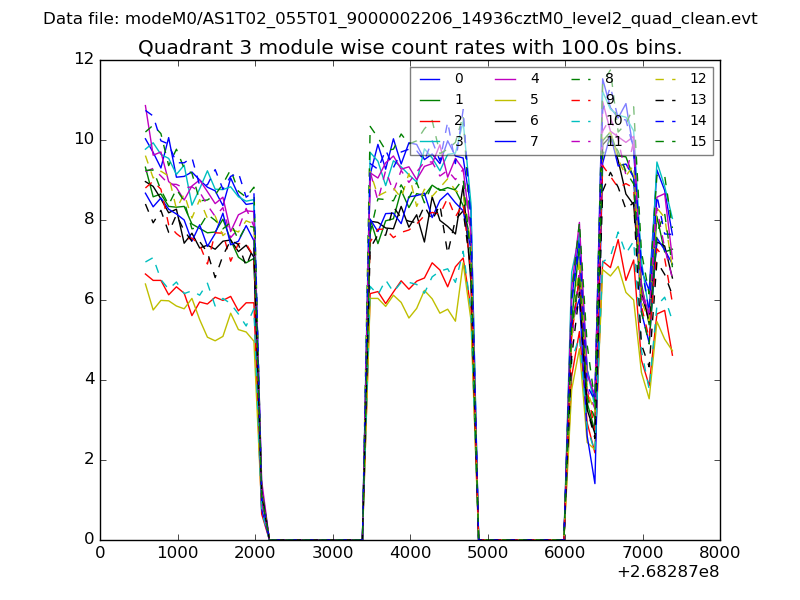
| Module-wise count rates for Quadrant A Data is divided into 100 sec bins |
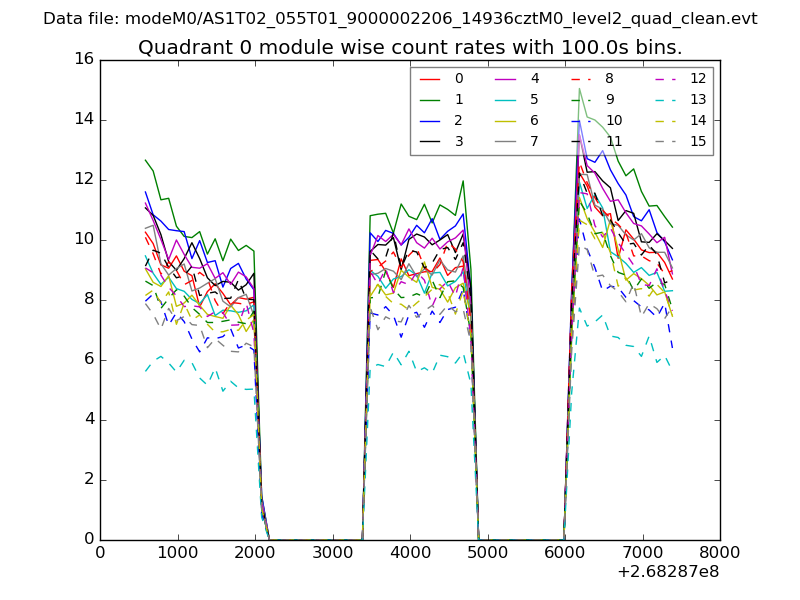 |
 |
| Module-wise count rates for Quadrant B Data is divided into 100 sec bins |
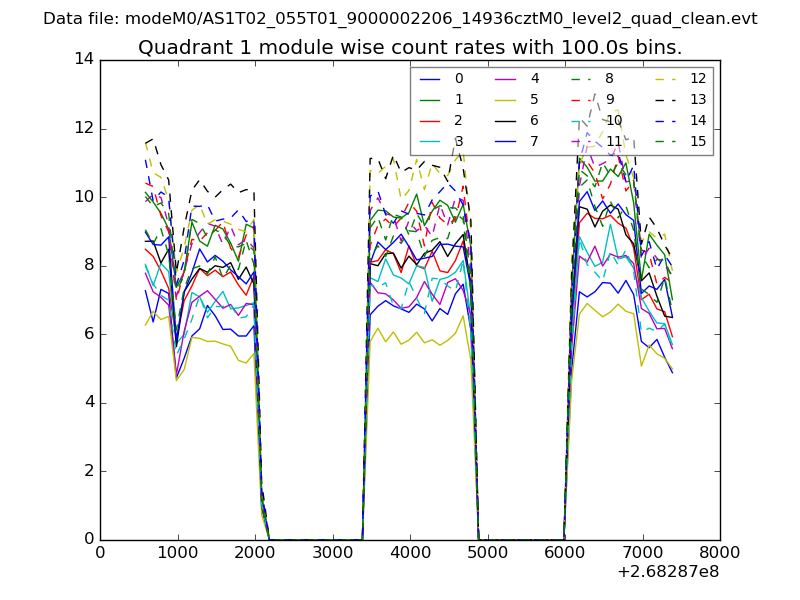 |
 |
| Module-wise count rates for Quadrant C Data is divided into 100 sec bins |
 |
 |
| Module-wise count rates for Quadrant D Data is divided into 100 sec bins |
 |
 |
| Parameter | Plot |
|---|---|
| CZT HV Monitor | 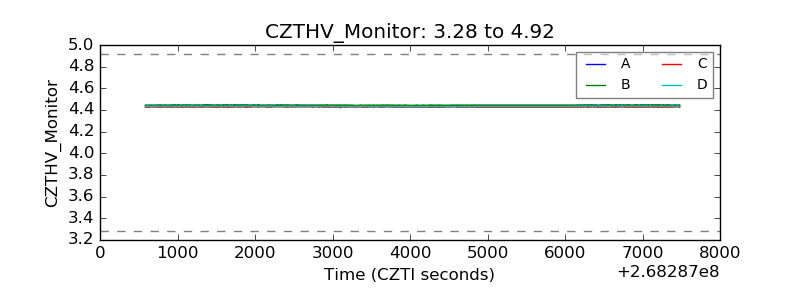 |
| D_VDD | 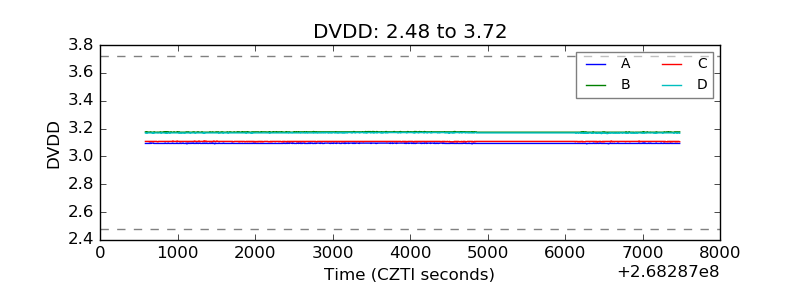 |
| Temperature 1 | 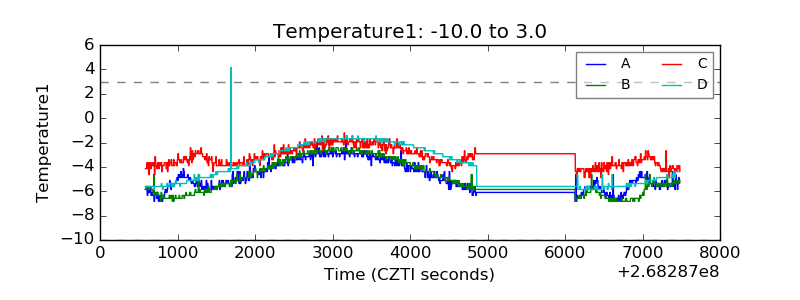 |
| Veto HV Monitor | 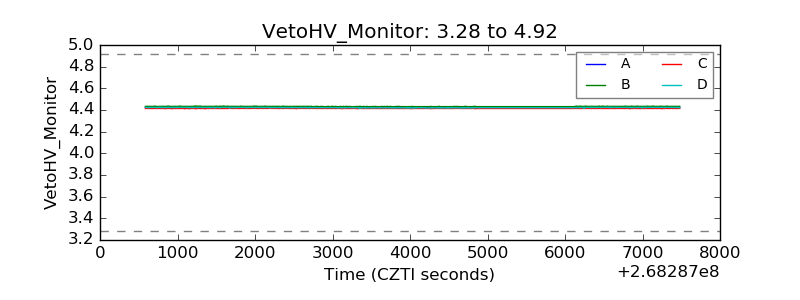 |
| Veto LLD | 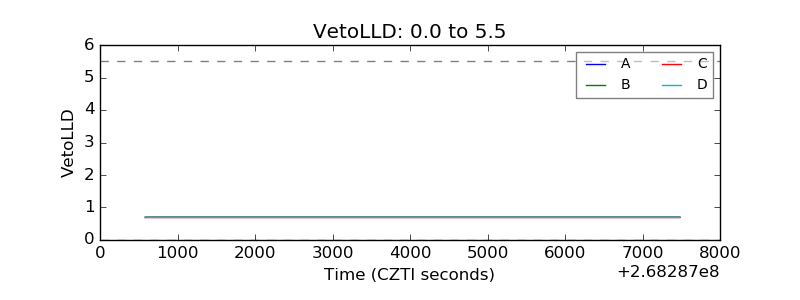 |
| Alpha Counter |  |
| _CPM_Rate | 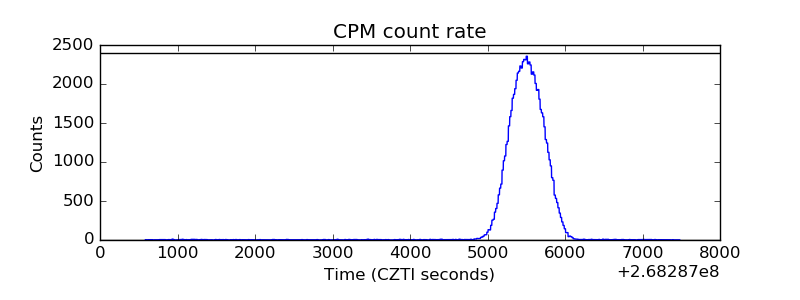 |
| CZT Counter |  |
| +2.5 Volts monitor |  |
| +5 Volts monitor |  |
| _ROLL_ROT | 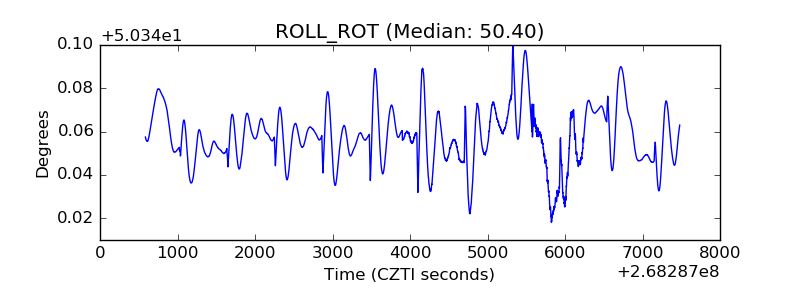 |
| _Roll_DEC | 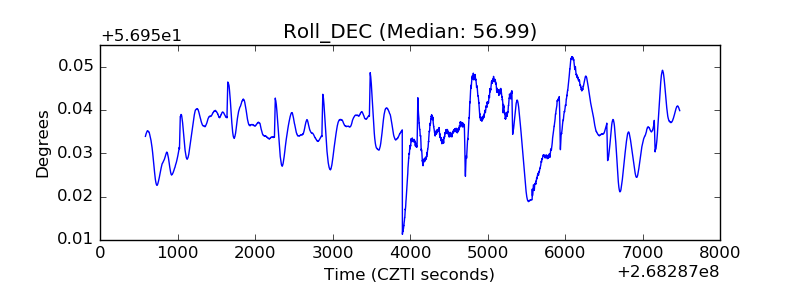 |
| _Roll_RA | 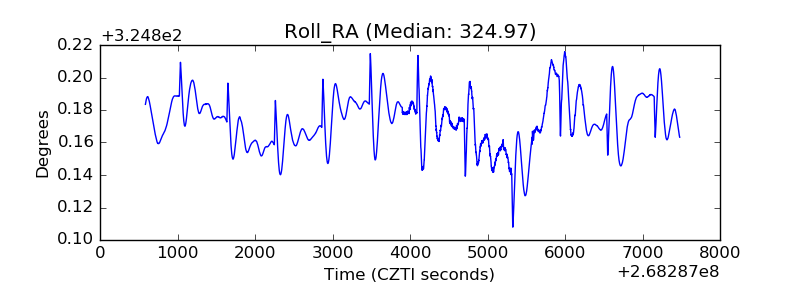 |
| Veto Counter | 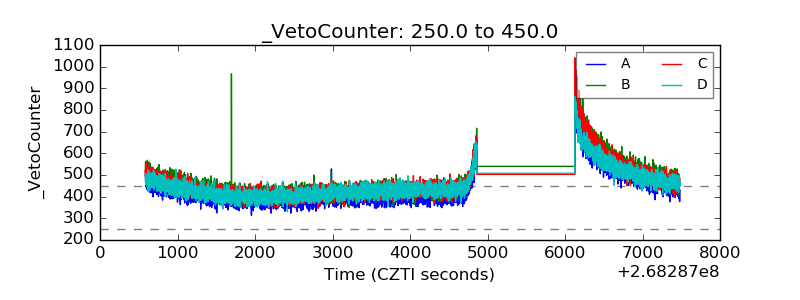 |