| Param | Original file | Final file |
|---|---|---|
| Filename | modeM0/AS1T02_055T01_9000002206_14938cztM0_level2.evt | modeM0/AS1T02_055T01_9000002206_14938cztM0_level2_quad_clean.evt |
| Size (bytes) | 832,072,320 | 163,362,240 |
| Size | 793.5 MB | 155.8 MB |
| Events in quadrant A | 5,286,552 | 1,094,270 |
| Events in quadrant B | 7,464,987 | 1,059,292 |
| Events in quadrant C | 5,139,511 | 1,050,207 |
| Events in quadrant D | 6,598,588 | 1,017,203 |
| Mode M0 | |||
|---|---|---|---|
| Quadrant | BADHDUFLAG | Total packets | Discarded packets |
| A | 0 | 21922 | 3 |
| B | 0 | 28686 | 2 |
| C | 0 | 21575 | 2 |
| D | 0 | 26501 | 2 |
| Mode SS | |||
|---|---|---|---|
| Quadrant | BADHDUFLAG | Total packets | Discarded packets |
| A | 0 | 212 | 0 |
| B | 0 | 212 | 0 |
| C | 0 | 212 | 0 |
| D | 0 | 212 | 0 |
| Mode M9 | |||
|---|---|---|---|
| Quadrant | BADHDUFLAG | Total packets | Discarded packets |
| A | 0 | 26 | 0 |
| B | 0 | 26 | 0 |
| C | 0 | 26 | 0 |
| D | 0 | 26 | 0 |
| Quadrant | Total seconds | Saturated seconds | Saturation percentage |
|---|---|---|---|
| A | 10497 | 165 | 1.571878% |
| B | 10497 | 767 | 7.306850% |
| C | 10497 | 93 | 0.885967% |
| D | 10497 | 417 | 3.972564% |
Noise dominated data is calculated using 1-second bins in cleaned event files. If a bin has >2000 counts, and if more than 50% of those come from <1% of pixels, then it is considered to be noise-dominated and hence unusable.
| Quadrant | # 1 sec bins | Bins with >0 counts | Bins with >2000 counts | High rate bins dominated by noise | Noise dominated (total time) | Noise dominated (detector-on time) | Marked lightcurve |
|---|---|---|---|---|---|---|---|
| A | 13073 | 10500 | 2 | 2 | 0.02% | 0.02% | 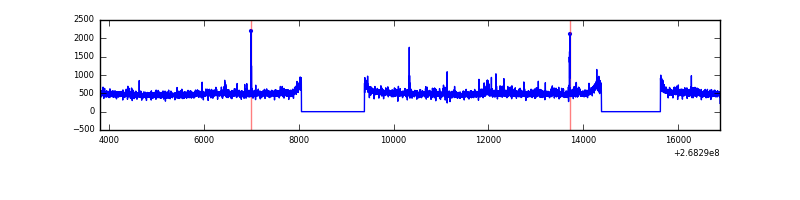 |
| B | 13073 | 10500 | 433 | 433 | 3.31% | 4.12% | 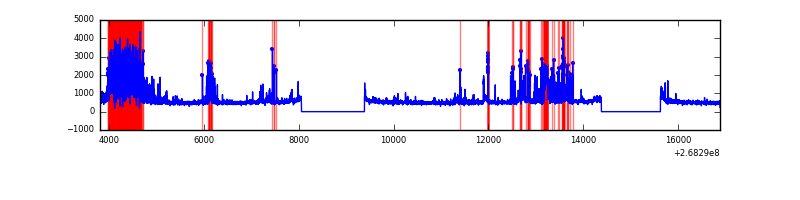 |
| C | 13073 | 10500 | 1 | 1 | 0.01% | 0.01% | 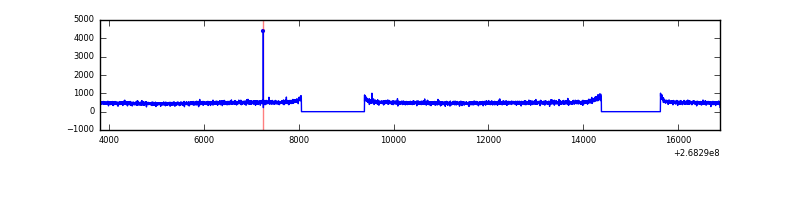 |
| D | 13073 | 10499 | 262 | 262 | 2.00% | 2.50% | 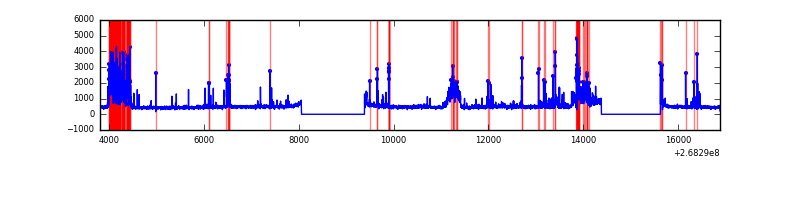 |
Top three noisy pixels from each quadrant. If the there are fewer than three noisy pixels in the level2.evt file, extra rows are filled as -1
| Pixel properties | Quadrant properties | ||||||
|---|---|---|---|---|---|---|---|
| Quadrant | DetID | PixID | Counts | Sigma | Mean | Median | Sigma |
| A | 12 | 189 | 122804 | 460.33 | 1332 | 1308 | 263.9 |
| A | 3 | 1 | 29995 | 108.69 | 1332 | 1308 | 263.9 |
| A | 0 | 226 | 11970 | 40.4 | 1332 | 1308 | 263.9 |
| B | 10 | 16 | 2057157 | 8568.06 | 1295 | 1262 | 239.9 |
| B | 0 | 219 | 176045 | 728.42 | 1295 | 1262 | 239.9 |
| B | 0 | 229 | 80235 | 329.12 | 1295 | 1262 | 239.9 |
| C | 3 | 233 | 223634 | 778.43 | 1259 | 1261 | 285.7 |
| C | 13 | 61 | 9134 | 27.56 | 1259 | 1261 | 285.7 |
| C | 10 | 22 | 7027 | 20.18 | 1259 | 1261 | 285.7 |
| D | 13 | 249 | 744560 | 2495.79 | 1259 | 1226 | 297.8 |
| D | 7 | 254 | 575626 | 1928.58 | 1259 | 1226 | 297.8 |
| D | 13 | 104 | 318349 | 1064.76 | 1259 | 1226 | 297.8 |
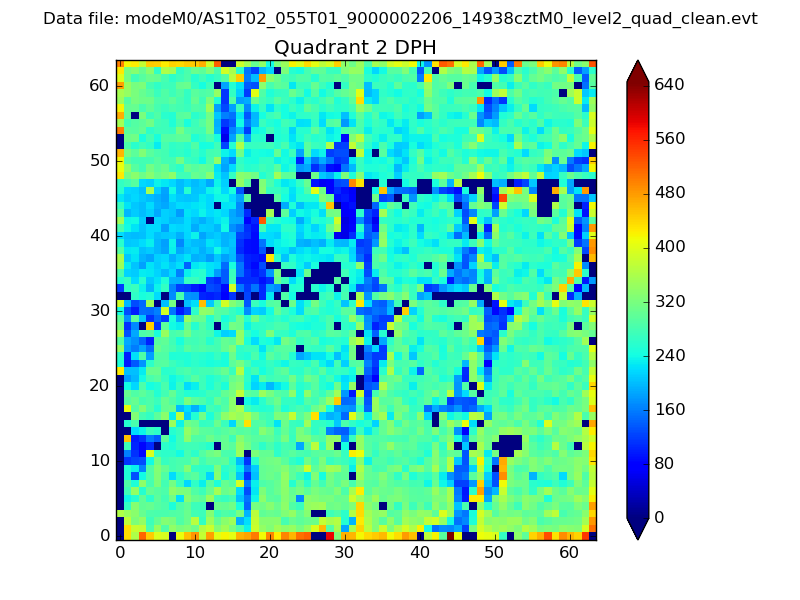
Histogram calculated using DETX and DETY for each event in the final _common_clean file
| Quadrant A | 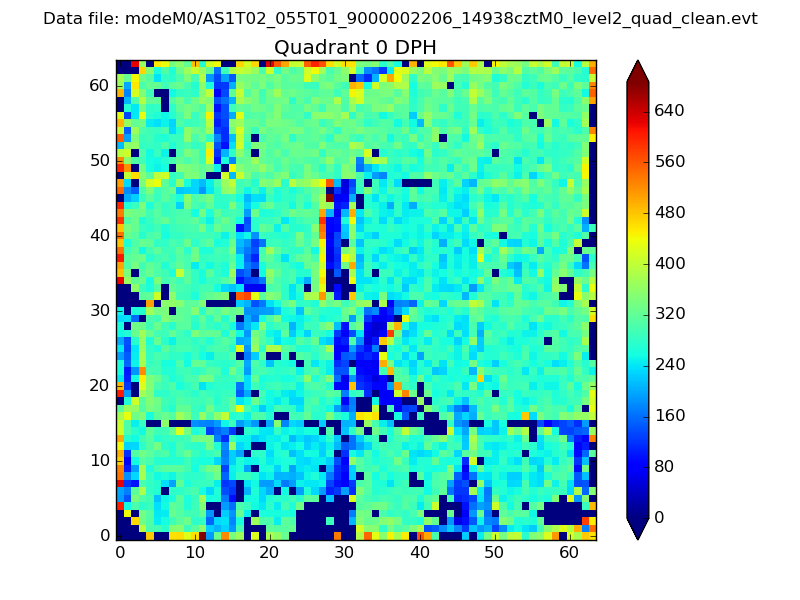 |
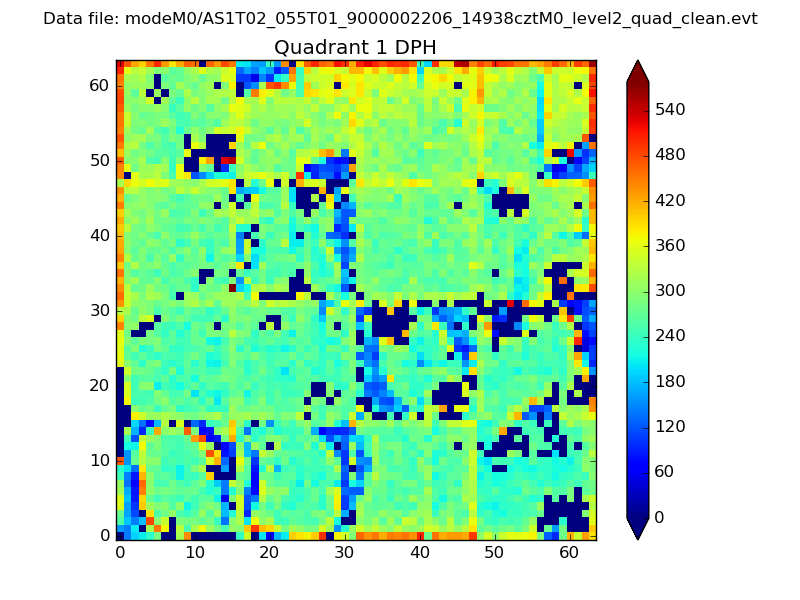 |
Quadrant B |
|---|---|---|---|
| Quadrant D | 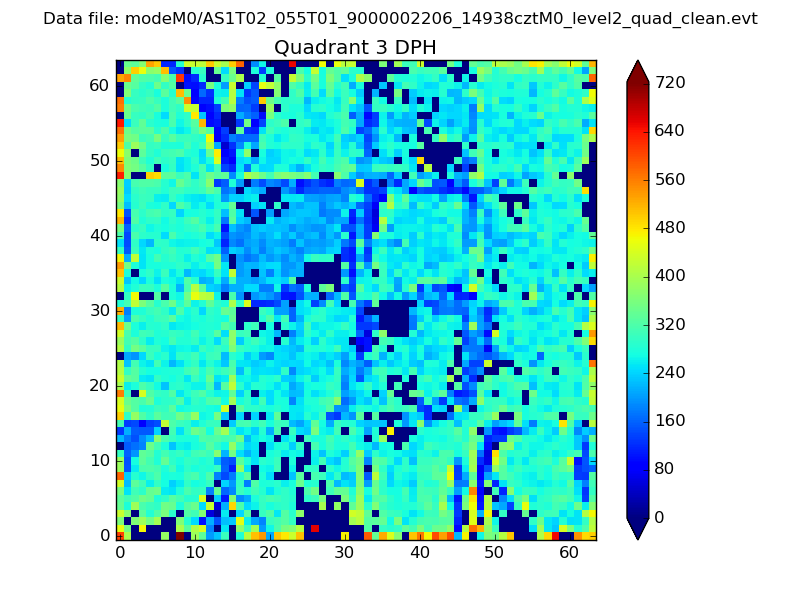 |
 |
Quadrant C |
| Plot type | Count rate plots | Images |
|---|---|---|
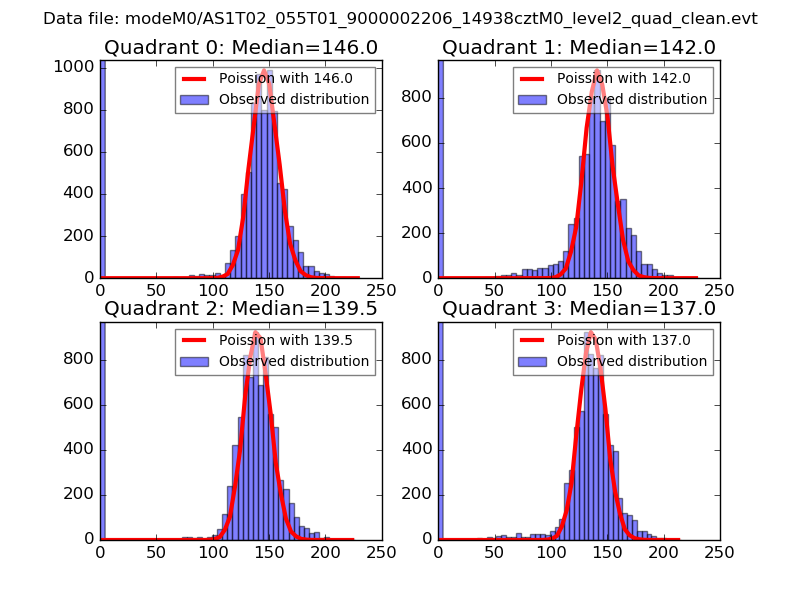
| Comparison with Poisson distribution Blue bars denote a histogram of data divided into 1 sec bins. Red curve is a Poisson curve with rate = median count rate of data. |
 |
 |
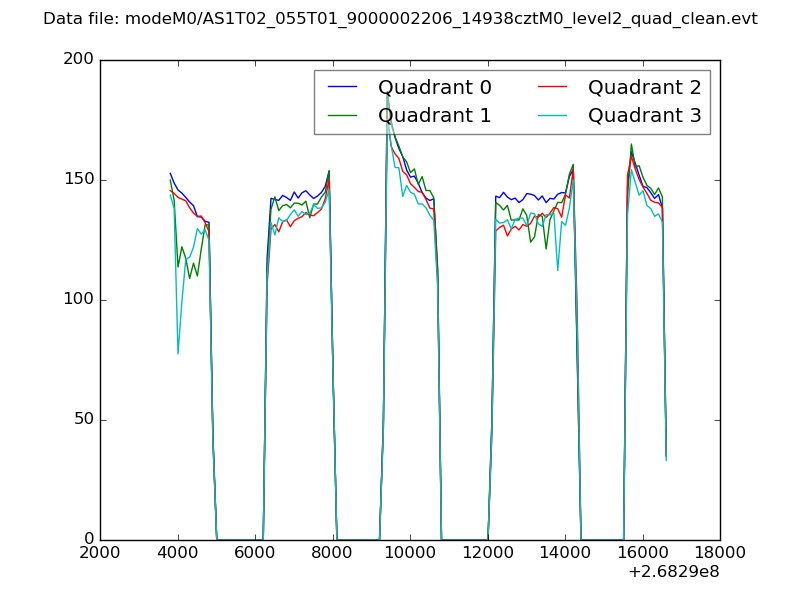
| Quadrant-wise count rates Data is divided into 100 sec bins |
 |
|
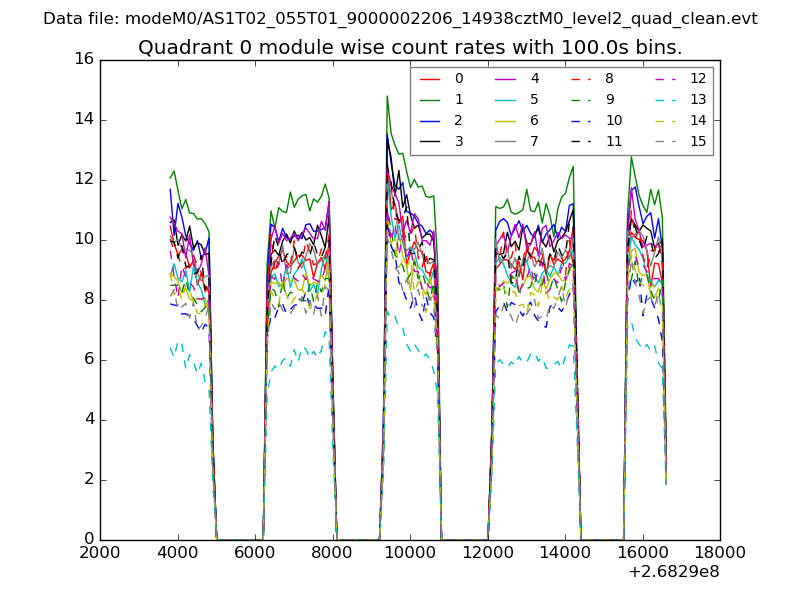
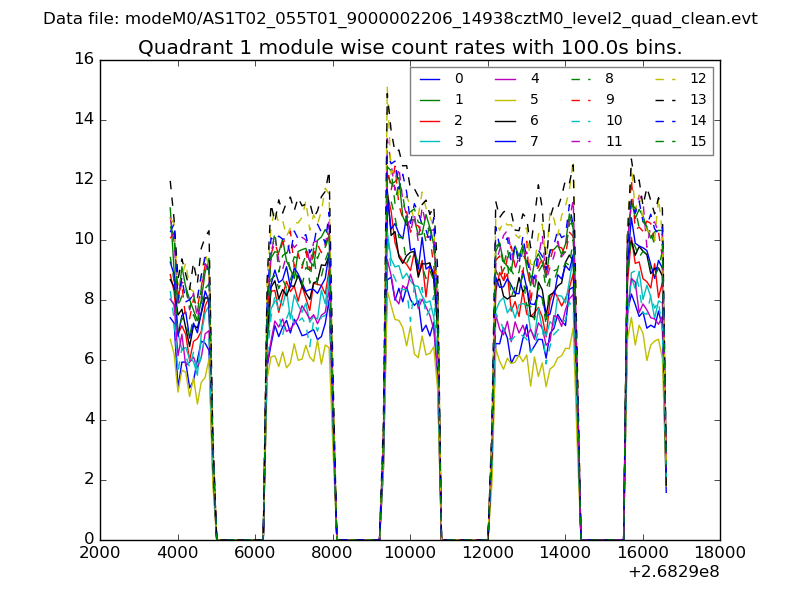
| Module-wise count rates for Quadrant A Data is divided into 100 sec bins |
 |
 |
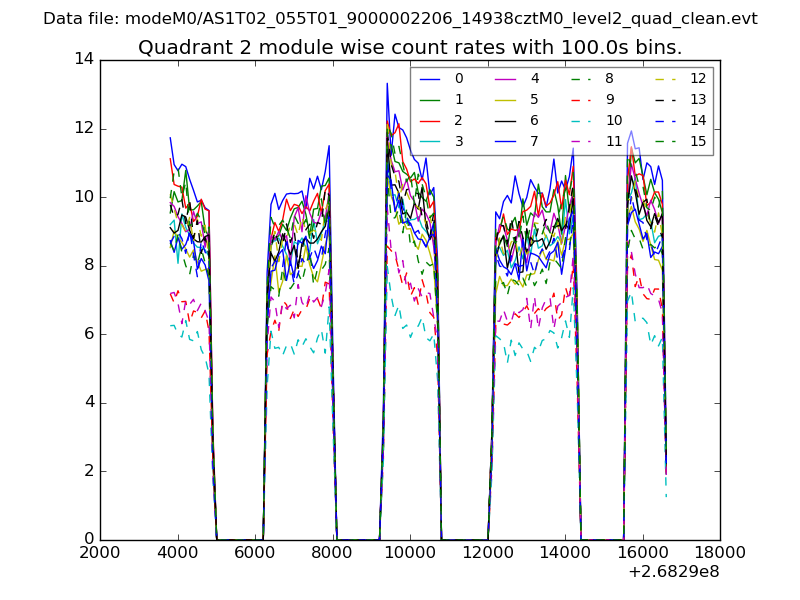
| Module-wise count rates for Quadrant B Data is divided into 100 sec bins |
 |
 |
| Module-wise count rates for Quadrant C Data is divided into 100 sec bins |
 |
 |
| Module-wise count rates for Quadrant D Data is divided into 100 sec bins |
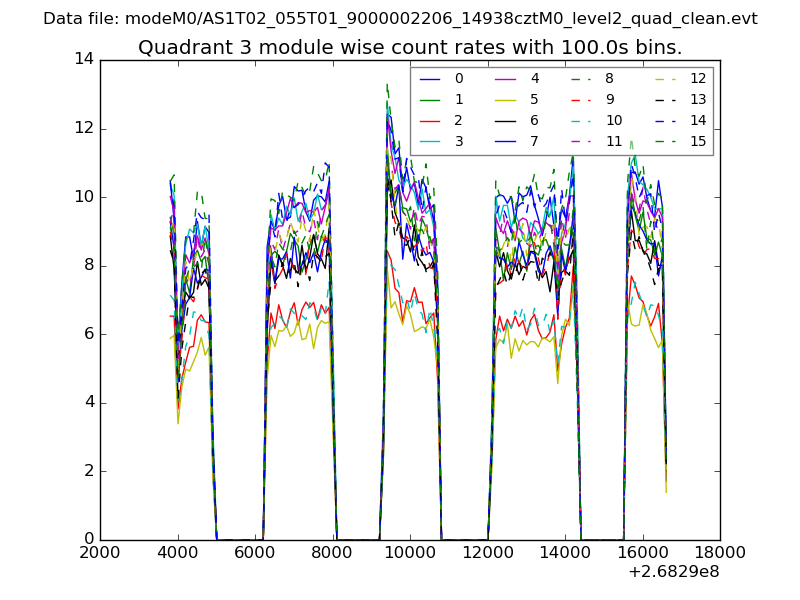 |
 |
| Parameter | Plot |
|---|---|
| CZT HV Monitor | 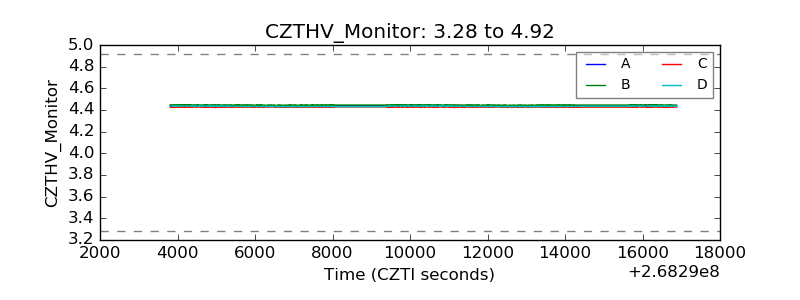 |
| D_VDD | 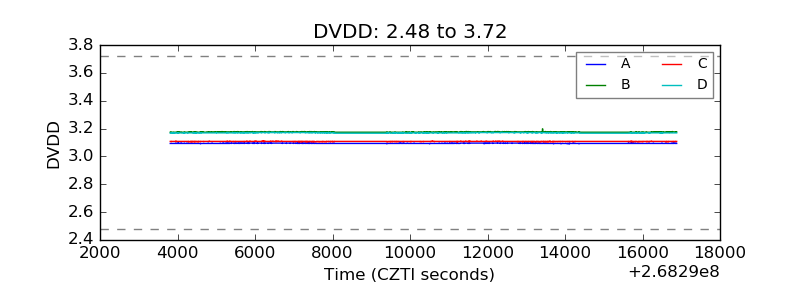 |
| Temperature 1 | 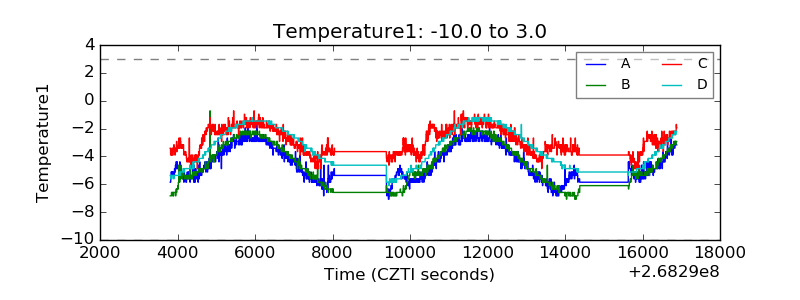 |
| Veto HV Monitor | 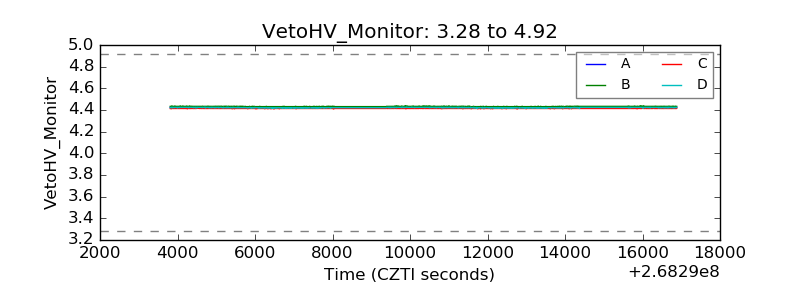 |
| Veto LLD | 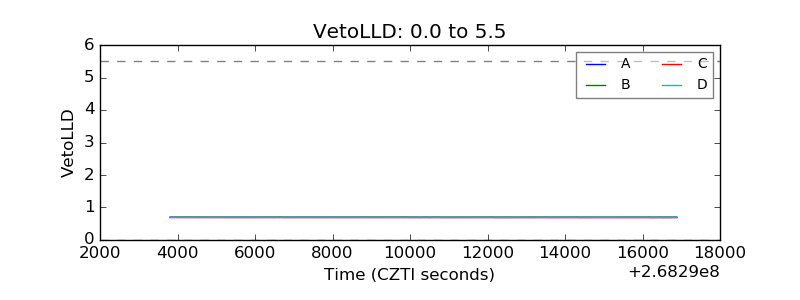 |
| Alpha Counter | 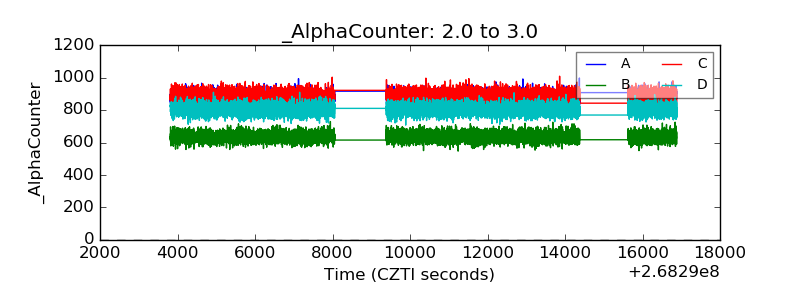 |
| _CPM_Rate |  |
| CZT Counter |  |
| +2.5 Volts monitor |  |
| +5 Volts monitor | 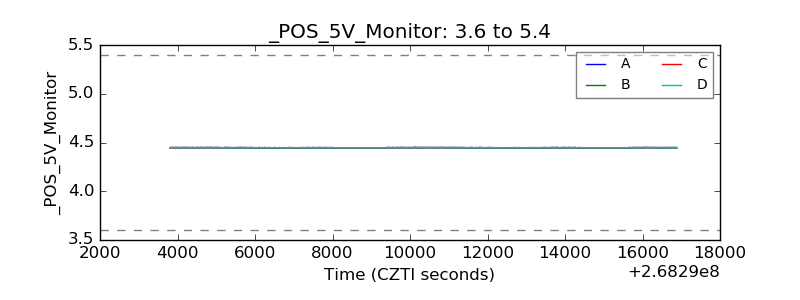 |
| _ROLL_ROT | 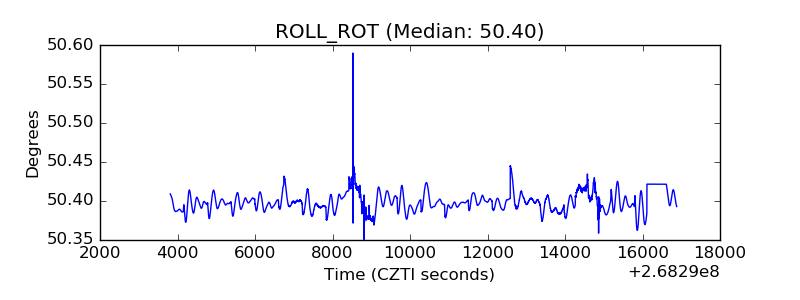 |
| _Roll_DEC | 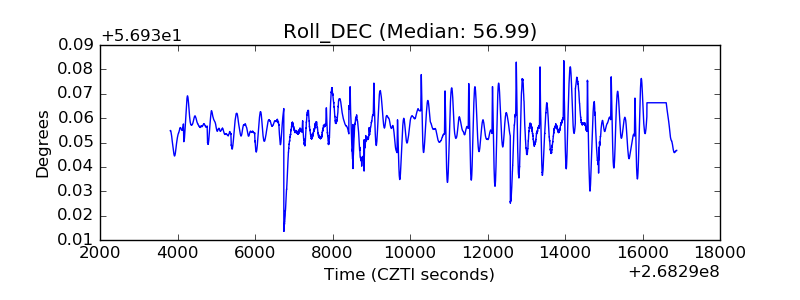 |
| _Roll_RA | 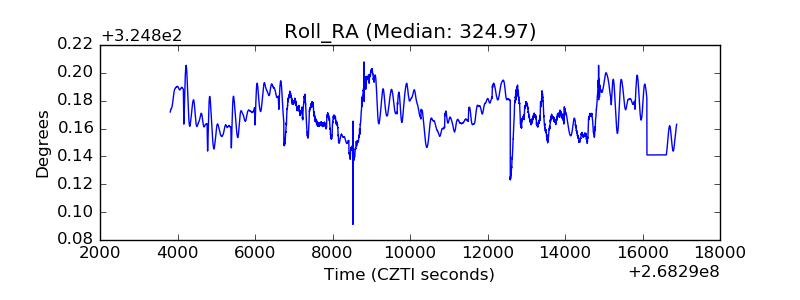 |
| Veto Counter | 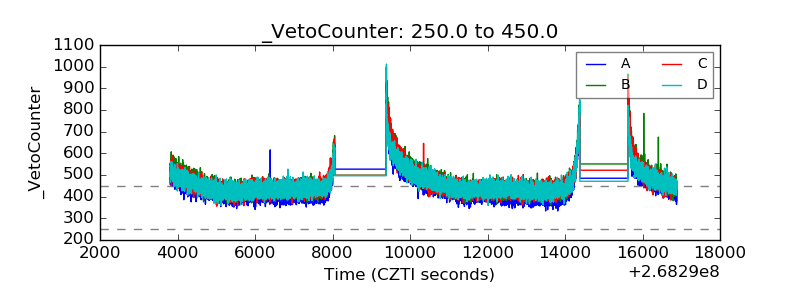 |