| Param | Original file | Final file |
|---|---|---|
| Filename | modeM0/AS1T02_055T01_9000002206_14940cztM0_level2.evt | modeM0/AS1T02_055T01_9000002206_14940cztM0_level2_quad_clean.evt |
| Size (bytes) | 502,231,680 | 87,966,720 |
| Size | 479.0 MB | 83.9 MB |
| Events in quadrant A | 3,394,381 | 557,748 |
| Events in quadrant B | 4,280,888 | 549,644 |
| Events in quadrant C | 3,369,891 | 535,478 |
| Events in quadrant D | 3,693,437 | 537,139 |
| Mode M0 | |||
|---|---|---|---|
| Quadrant | BADHDUFLAG | Total packets | Discarded packets |
| A | 0 | 14365 | 2 |
| B | 0 | 17048 | 1 |
| C | 0 | 14292 | 1 |
| D | 0 | 15672 | 1 |
| Mode SS | |||
|---|---|---|---|
| Quadrant | BADHDUFLAG | Total packets | Discarded packets |
| A | 0 | 142 | 0 |
| B | 0 | 142 | 0 |
| C | 0 | 142 | 0 |
| D | 0 | 142 | 0 |
| Mode M9 | |||
|---|---|---|---|
| Quadrant | BADHDUFLAG | Total packets | Discarded packets |
| A | 0 | 8 | 0 |
| B | 0 | 8 | 0 |
| C | 0 | 8 | 0 |
| D | 0 | 8 | 0 |
| Quadrant | Total seconds | Saturated seconds | Saturation percentage |
|---|---|---|---|
| A | 6941 | 114 | 1.642415% |
| B | 6941 | 272 | 3.918744% |
| C | 6941 | 92 | 1.325457% |
| D | 6941 | 233 | 3.356865% |
Noise dominated data is calculated using 1-second bins in cleaned event files. If a bin has >2000 counts, and if more than 50% of those come from <1% of pixels, then it is considered to be noise-dominated and hence unusable.
| Quadrant | # 1 sec bins | Bins with >0 counts | Bins with >2000 counts | High rate bins dominated by noise | Noise dominated (total time) | Noise dominated (detector-on time) | Marked lightcurve |
|---|---|---|---|---|---|---|---|
| A | 7767 | 6943 | 0 | 0 | 0.00% | 0.00% | 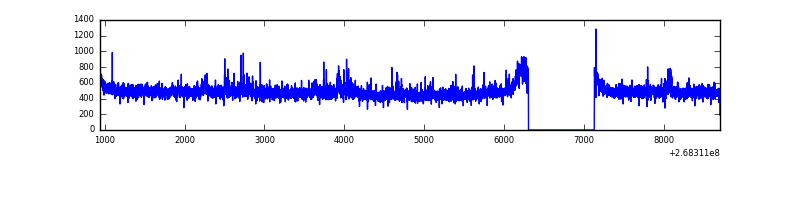 |
| B | 7767 | 6943 | 108 | 108 | 1.39% | 1.56% | 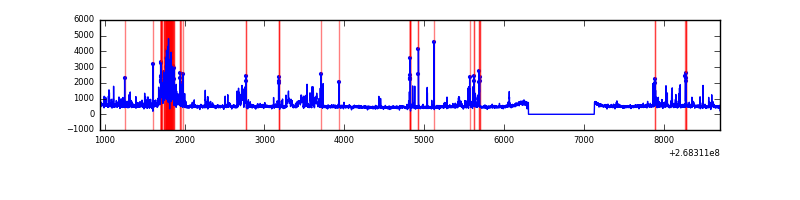 |
| C | 7767 | 6943 | 6 | 6 | 0.08% | 0.09% | 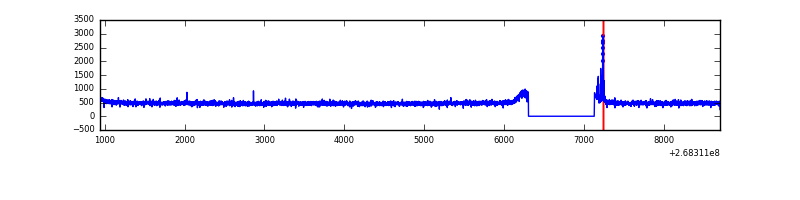 |
| D | 7767 | 6942 | 120 | 120 | 1.54% | 1.73% | 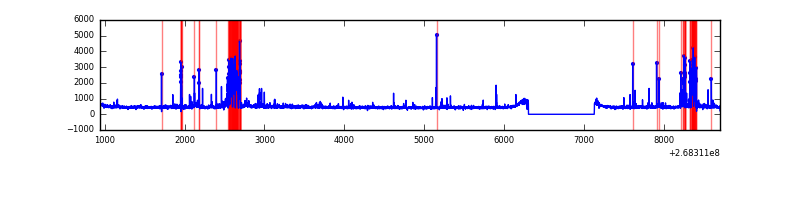 |
Top three noisy pixels from each quadrant. If the there are fewer than three noisy pixels in the level2.evt file, extra rows are filled as -1
| Pixel properties | Quadrant properties | ||||||
|---|---|---|---|---|---|---|---|
| Quadrant | DetID | PixID | Counts | Sigma | Mean | Median | Sigma |
| A | 12 | 189 | 89107 | 516.76 | 842 | 824 | 170.8 |
| A | 13 | 252 | 20112 | 112.9 | 842 | 824 | 170.8 |
| A | 3 | 1 | 16788 | 93.44 | 842 | 824 | 170.8 |
| B | 10 | 16 | 857069 | 5407.4 | 825 | 803 | 158.4 |
| B | 0 | 219 | 78530 | 490.85 | 825 | 803 | 158.4 |
| B | 0 | 189 | 67470 | 421.01 | 825 | 803 | 158.4 |
| C | 3 | 233 | 195845 | 1060.79 | 802 | 803 | 183.9 |
| C | 9 | 236 | 38445 | 204.73 | 802 | 803 | 183.9 |
| C | 10 | 22 | 6311 | 29.96 | 802 | 803 | 183.9 |
| D | 10 | 70 | 394019 | 2059.85 | 805 | 784 | 190.9 |
| D | 7 | 254 | 124651 | 648.84 | 805 | 784 | 190.9 |
| D | 13 | 249 | 74953 | 388.51 | 805 | 784 | 190.9 |
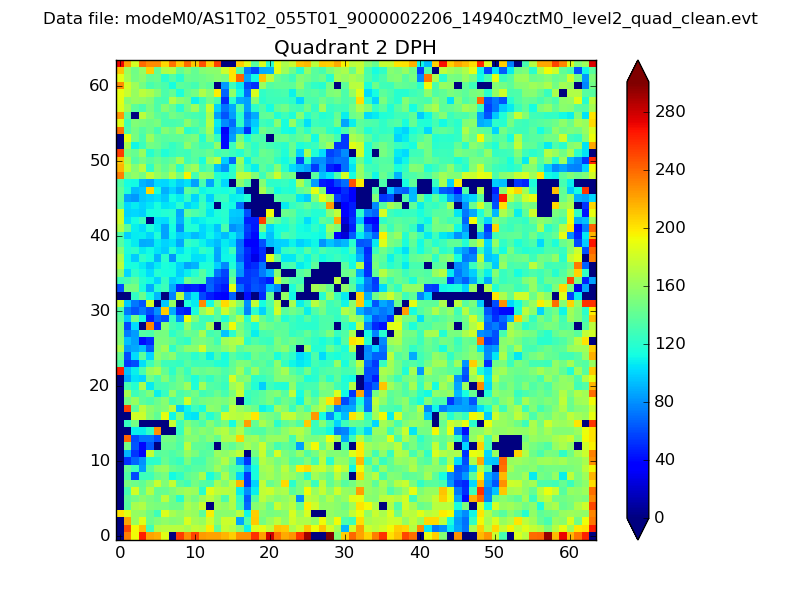
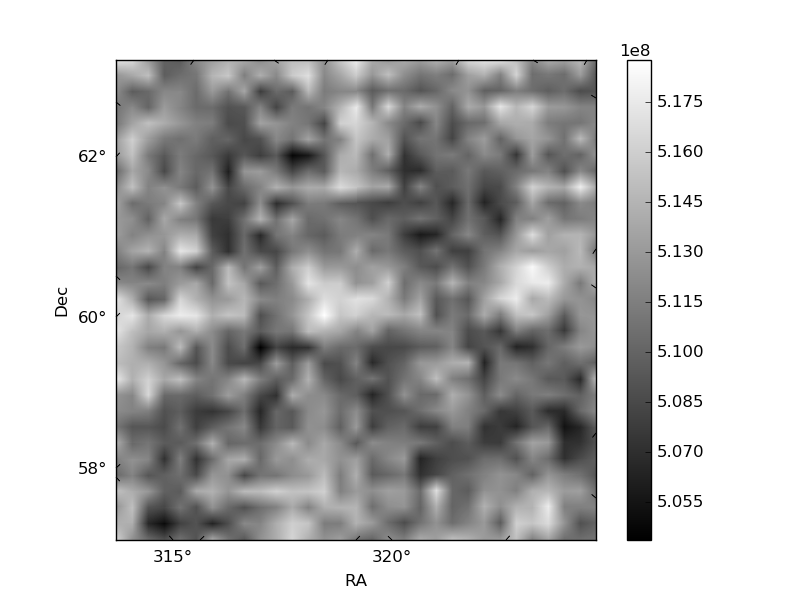
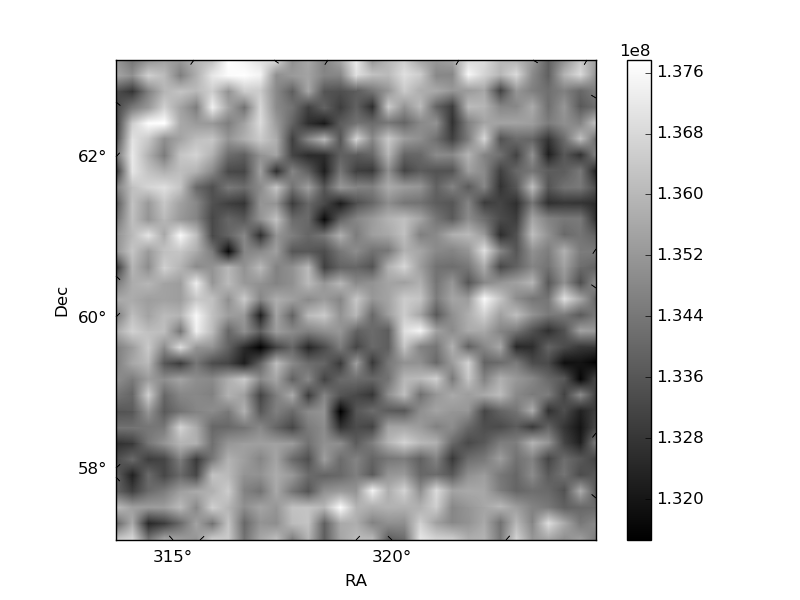
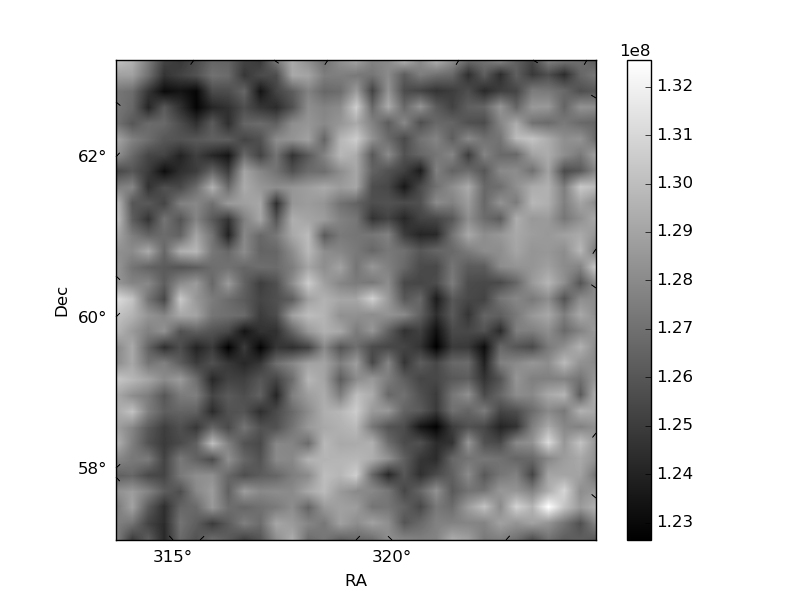
Histogram calculated using DETX and DETY for each event in the final _common_clean file
| Quadrant A | 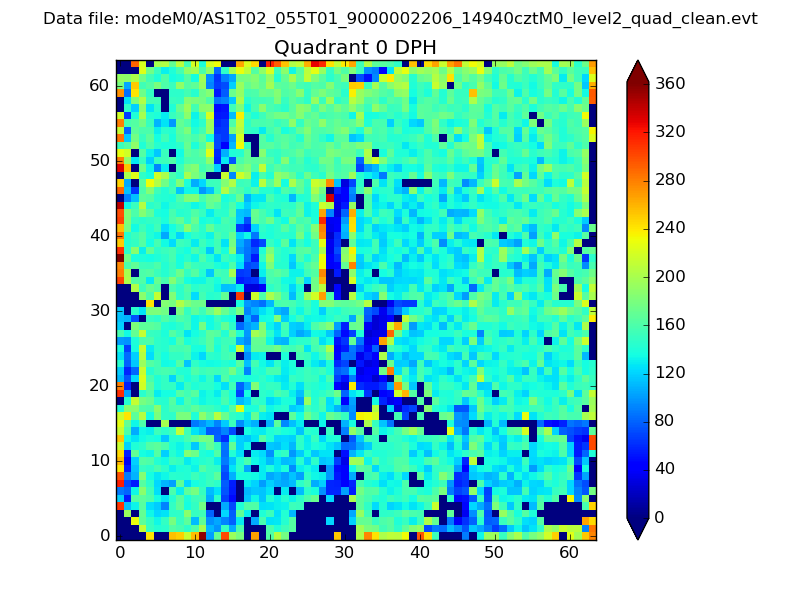 |
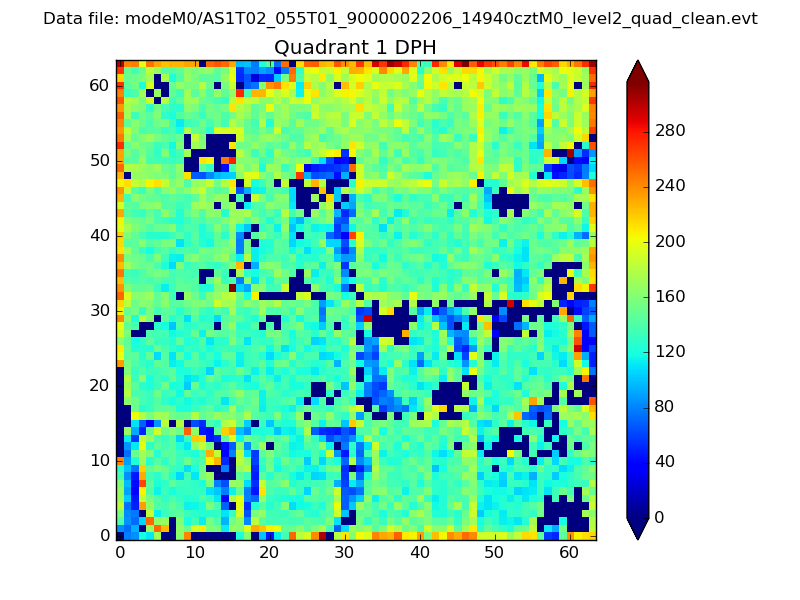 |
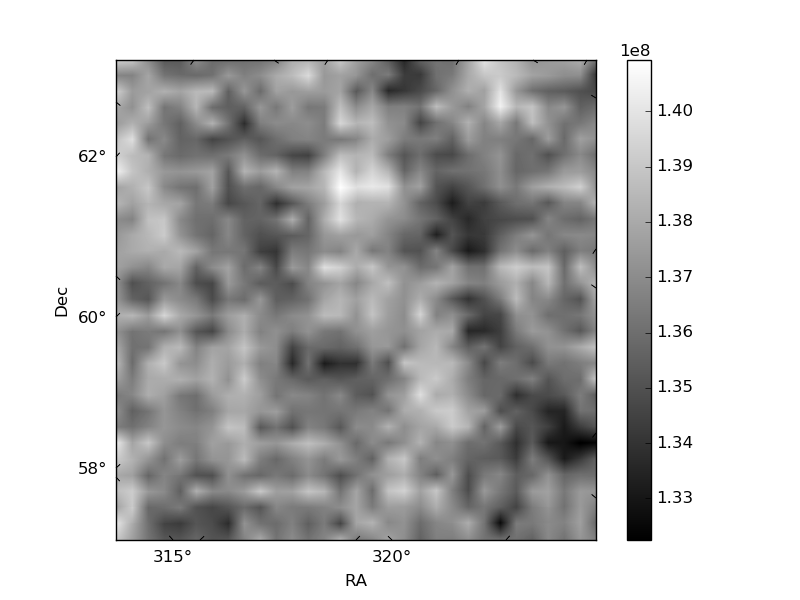
Quadrant B |
|---|---|---|---|
| Quadrant D | 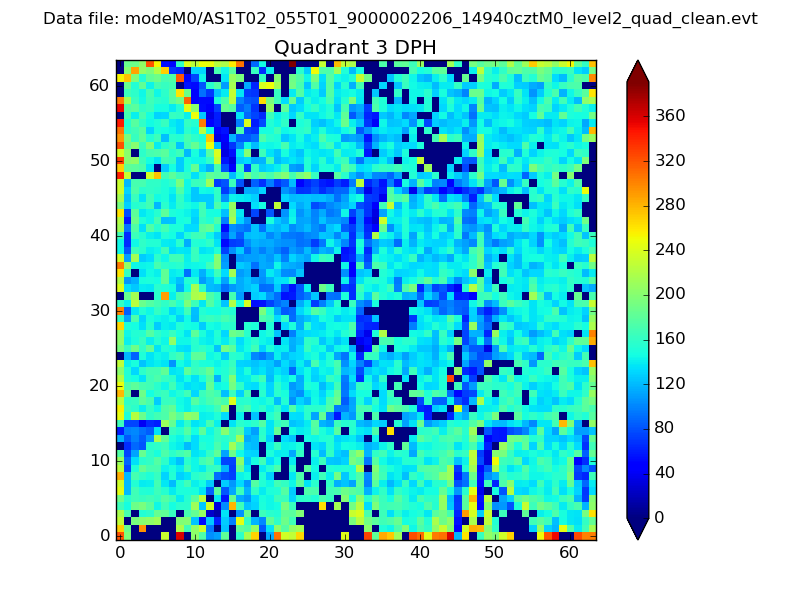 |
 |
Quadrant C |
| Plot type | Count rate plots | Images |
|---|---|---|
| Comparison with Poisson distribution Blue bars denote a histogram of data divided into 1 sec bins. Red curve is a Poisson curve with rate = median count rate of data. |
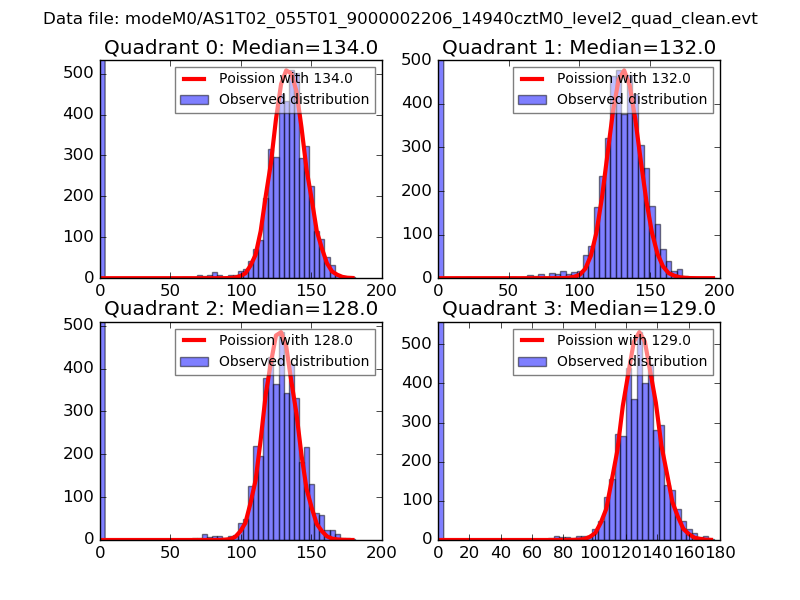 |
 |
| Quadrant-wise count rates Data is divided into 100 sec bins |
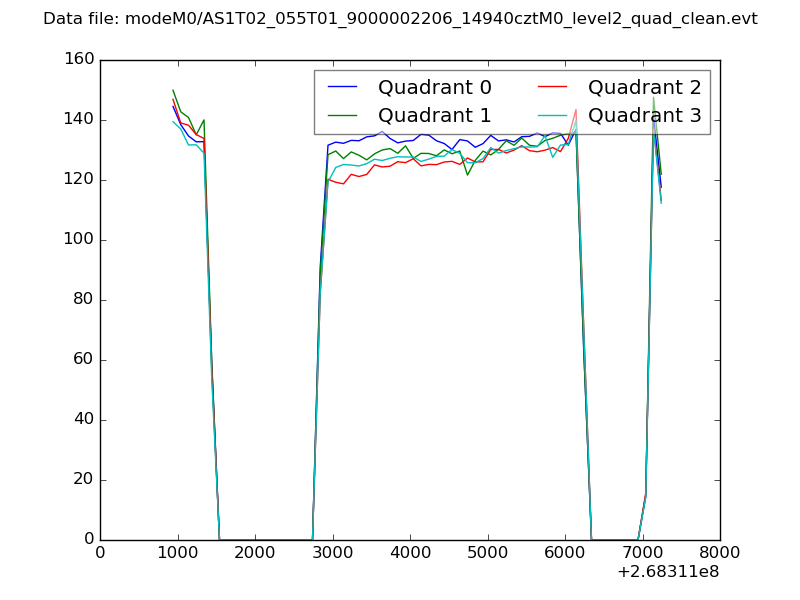 |
|
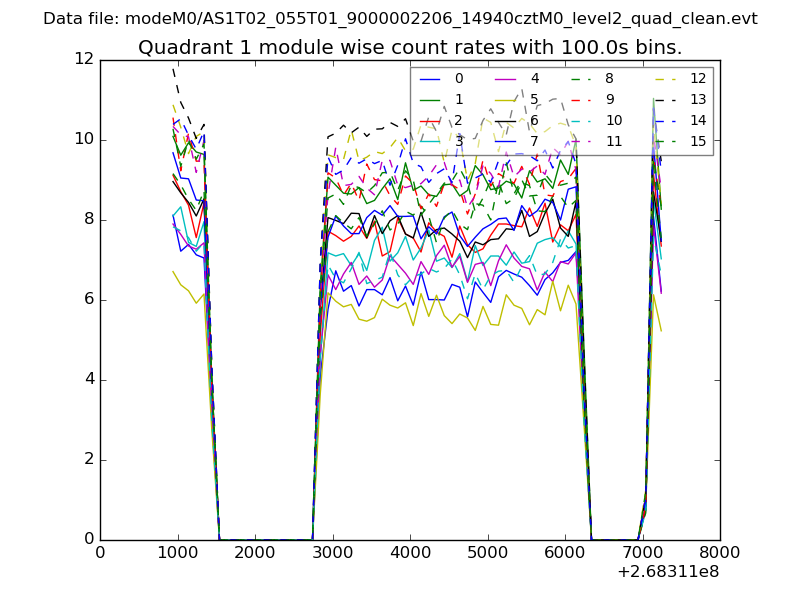
| Module-wise count rates for Quadrant A Data is divided into 100 sec bins |
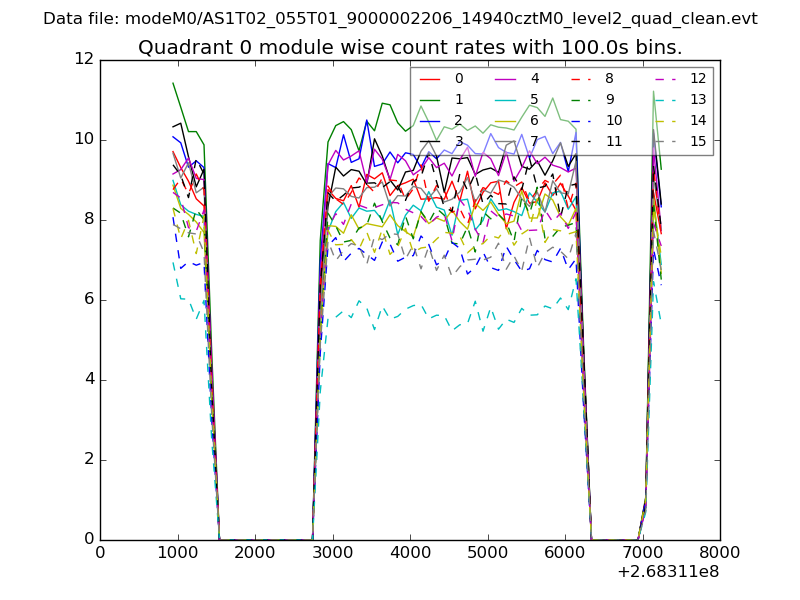 |
 |
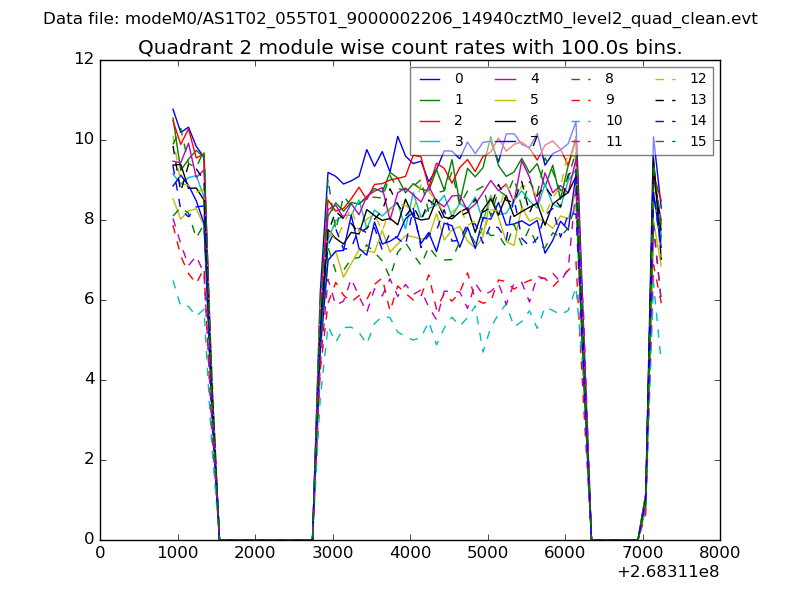
| Module-wise count rates for Quadrant B Data is divided into 100 sec bins |
 |
 |
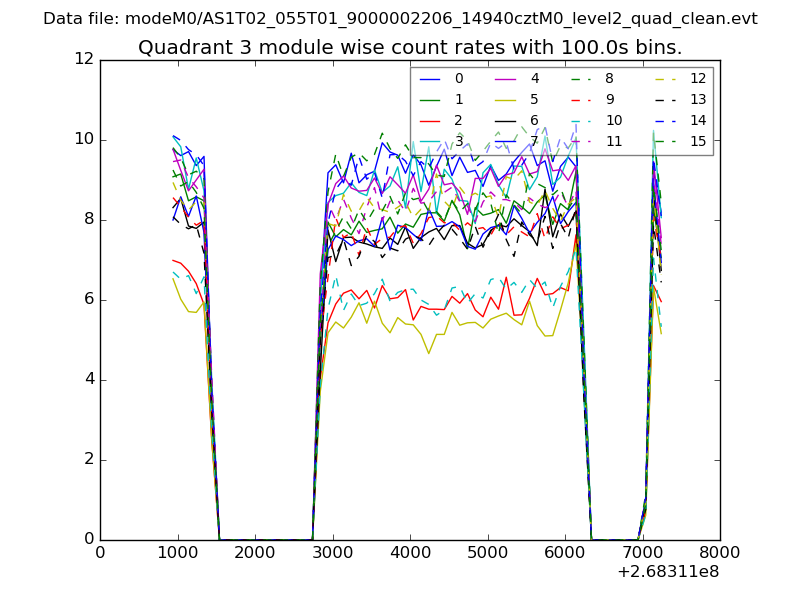
| Module-wise count rates for Quadrant C Data is divided into 100 sec bins |
 |
 |
| Module-wise count rates for Quadrant D Data is divided into 100 sec bins |
 |
 |
| Parameter | Plot |
|---|---|
| CZT HV Monitor | 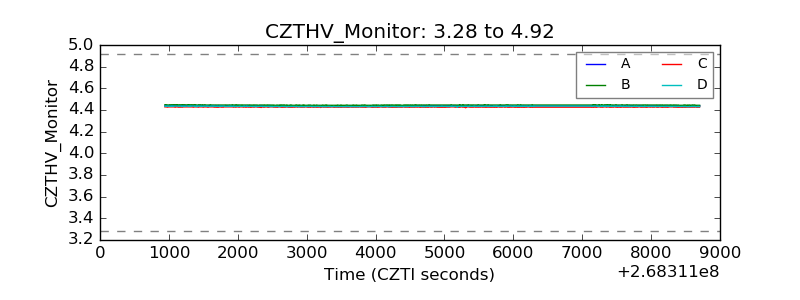 |
| D_VDD | 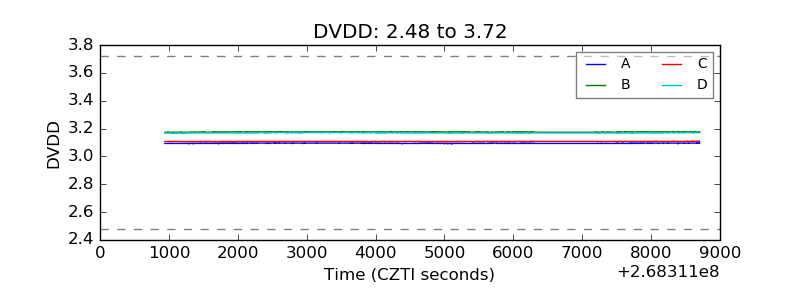 |
| Temperature 1 | 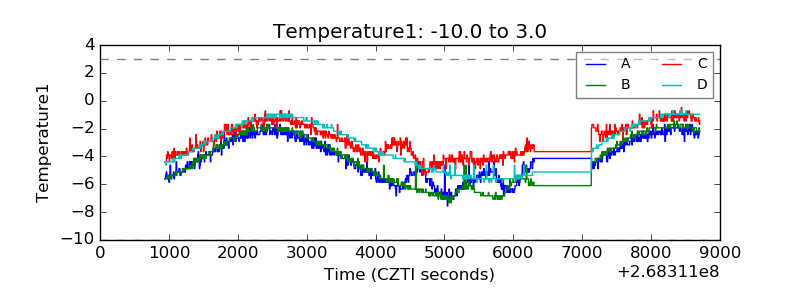 |
| Veto HV Monitor | 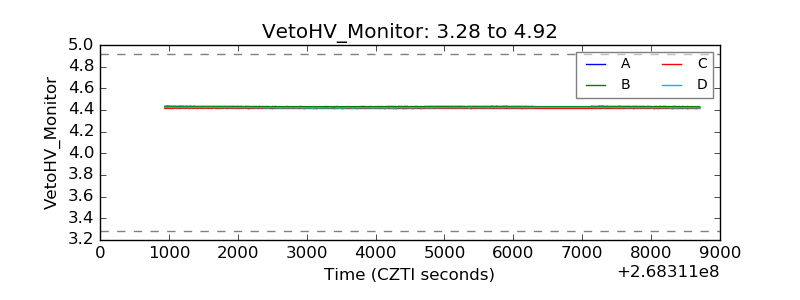 |
| Veto LLD | 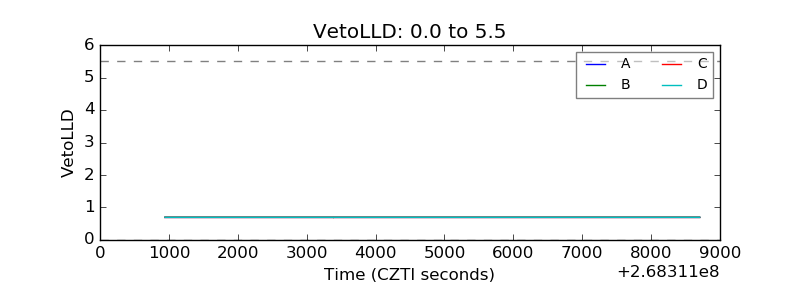 |
| Alpha Counter | 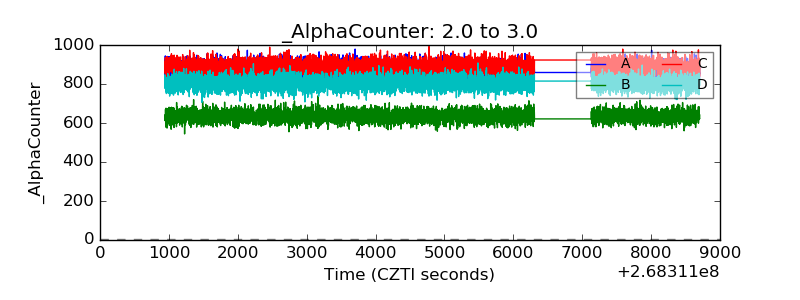 |
| _CPM_Rate | 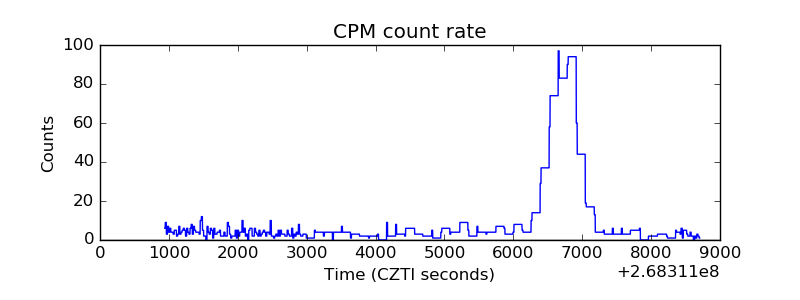 |
| CZT Counter | 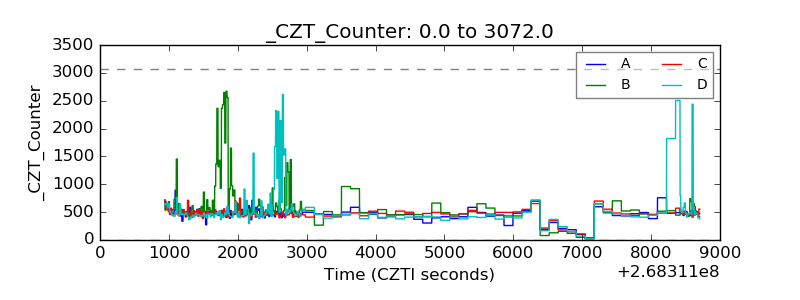 |
| +2.5 Volts monitor |  |
| +5 Volts monitor |  |
| _ROLL_ROT | 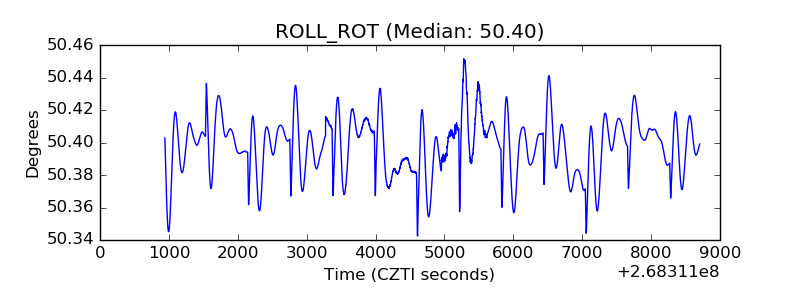 |
| _Roll_DEC | 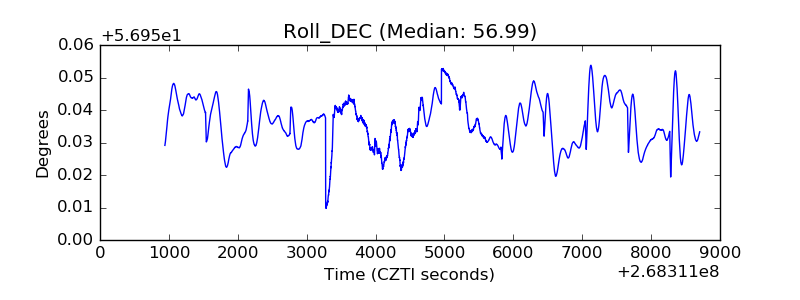 |
| _Roll_RA | 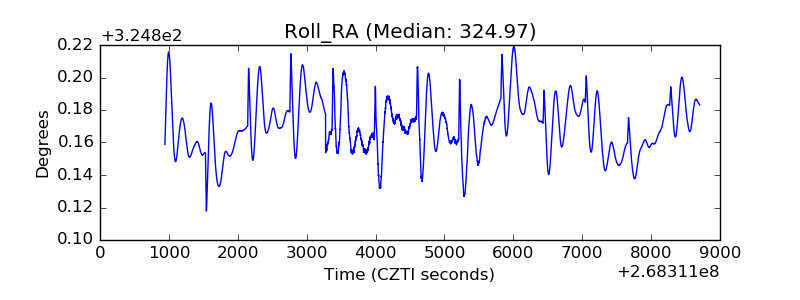 |
| Veto Counter | 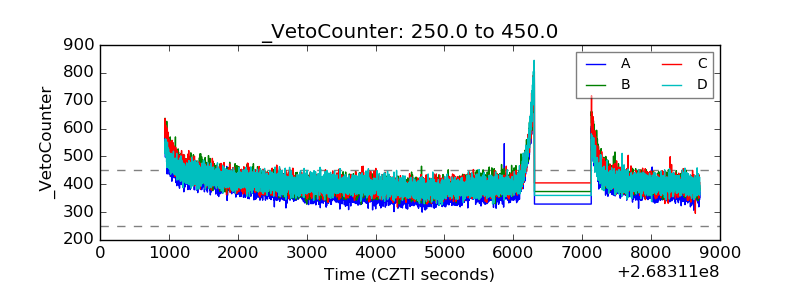 |