| Param | Original file | Final file |
|---|---|---|
| Filename | modeM0/AS1T02_052T01_9000002208cztM0_level2.fits | modeM0/AS1T02_052T01_9000002208cztM0_level2_quad_clean.evt |
| Size (bytes) | 250,957,440 | 230,682,240 |
| Size | 239.3 MB | 220.0 MB |
| Events in quadrant A | 1,544,790 | 1,425,565 |
| Events in quadrant B | 1,449,706 | 1,346,048 |
| Events in quadrant C | 1,493,726 | 1,307,076 |
| Events in quadrant D | 1,243,418 | 1,039,825 |
| Mode SS | |||
|---|---|---|---|
| Quadrant | BADHDUFLAG | Total packets | Discarded packets |
| A | 0 | 556 | 0 |
| B | 0 | 556 | 0 |
| C | 0 | 556 | 0 |
| D | 0 | 556 | 0 |
| Mode M9 | |||
|---|---|---|---|
| Quadrant | BADHDUFLAG | Total packets | Discarded packets |
| A | 0 | 21 | 0 |
| B | 0 | 21 | 0 |
| C | 0 | 21 | 0 |
| D | 0 | 21 | 0 |
| Mode M0 | |||
|---|---|---|---|
| Quadrant | BADHDUFLAG | Total packets | Discarded packets |
| A | 0 | 56203 | 0 |
| B | 0 | 67010 | 0 |
| C | 0 | 61797 | 0 |
| D | 0 | 89952 | 0 |
| Quadrant | Total seconds | Saturated seconds | Saturation percentage |
|---|---|---|---|
| A | 27130 | 358 | 1.319572% |
| B | 27130 | 1031 | 3.800221% |
| C | 27130 | 601 | 2.215260% |
| D | 27130 | 3291 | 12.130483% |
Noise dominated data is calculated using 1-second bins in cleaned event files. If a bin has >2000 counts, and if more than 50% of those come from <1% of pixels, then it is considered to be noise-dominated and hence unusable.
| Quadrant | # 1 sec bins | Bins with >0 counts | Bins with >2000 counts | High rate bins dominated by noise | Noise dominated (total time) | Noise dominated (detector-on time) | Marked lightcurve |
|---|---|---|---|---|---|---|---|
| A | 29461 | 27131 | 0 | 0 | 0.00% | 0.00% |  |
| B | 29461 | 27119 | 0 | 0 | 0.00% | 0.00% | 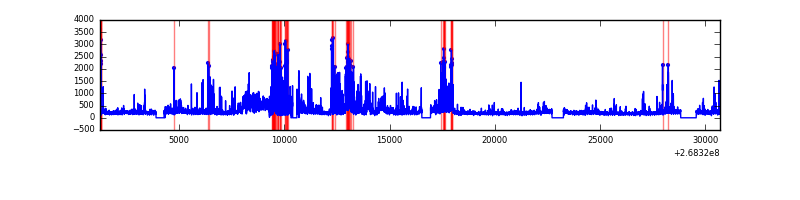 |
| C | 29461 | 27128 | 0 | 0 | 0.00% | 0.00% |  |
| D | 29461 | 27122 | 0 | 0 | 0.00% | 0.00% |  |
Top three noisy pixels from each quadrant. If the there are fewer than three noisy pixels in the level2.evt file, extra rows are filled as -1
| Pixel properties | Quadrant properties | ||||||
|---|---|---|---|---|---|---|---|
| Quadrant | DetID | PixID | Counts | Sigma | Mean | Median | Sigma |
| A | 14 | 188 | 1559 | 11.63 | 401 | 374 | 101.9 |
| A | 0 | 29 | 1476 | 10.81 | 401 | 374 | 101.9 |
| A | 15 | 236 | 1288 | 8.97 | 401 | 374 | 101.9 |
| B | 2 | 9 | 1300 | 11.98 | 381 | 361 | 78.4 |
| B | 3 | 17 | 1023 | 8.45 | 381 | 361 | 78.4 |
| B | 2 | 8 | 989 | 8.01 | 381 | 361 | 78.4 |
| C | 7 | 111 | 1029 | 6.33 | 394 | 367 | 104.6 |
| C | 12 | 241 | 1024 | 6.28 | 394 | 367 | 104.6 |
| C | 2 | 191 | 1003 | 6.08 | 394 | 367 | 104.6 |
| D | 6 | 231 | 916 | 6.09 | 354 | 322 | 97.6 |
| D | 3 | 14 | 897 | 5.89 | 354 | 322 | 97.6 |
| D | 3 | 31 | 887 | 5.79 | 354 | 322 | 97.6 |
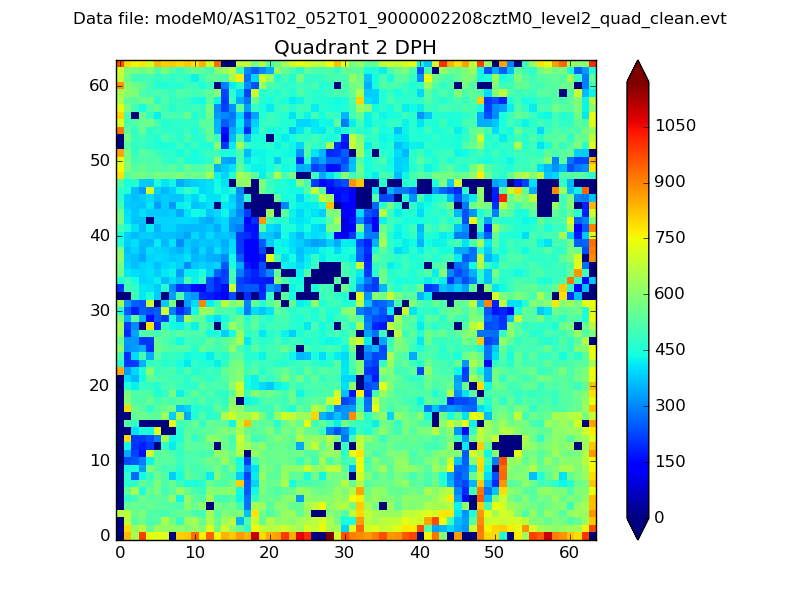
Histogram calculated using DETX and DETY for each event in the final _common_clean file
| Quadrant A | 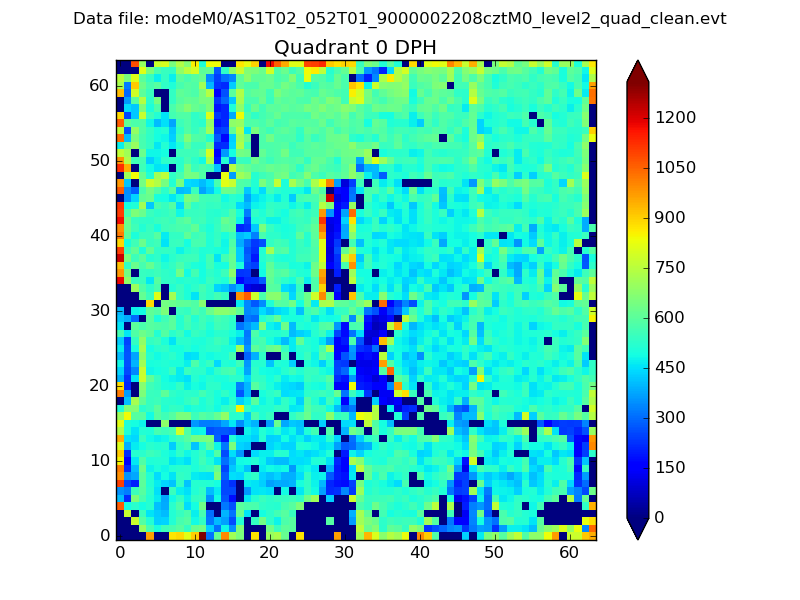 |
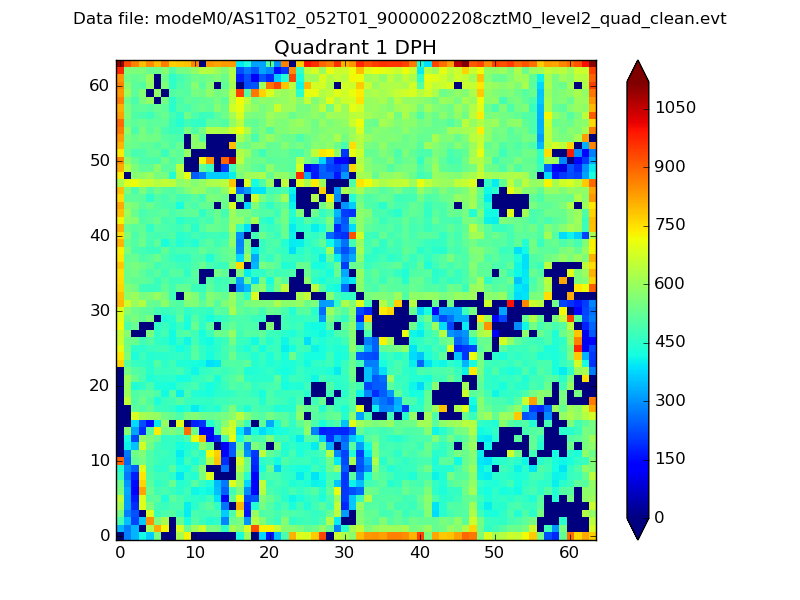 |
Quadrant B |
|---|---|---|---|
| Quadrant D | 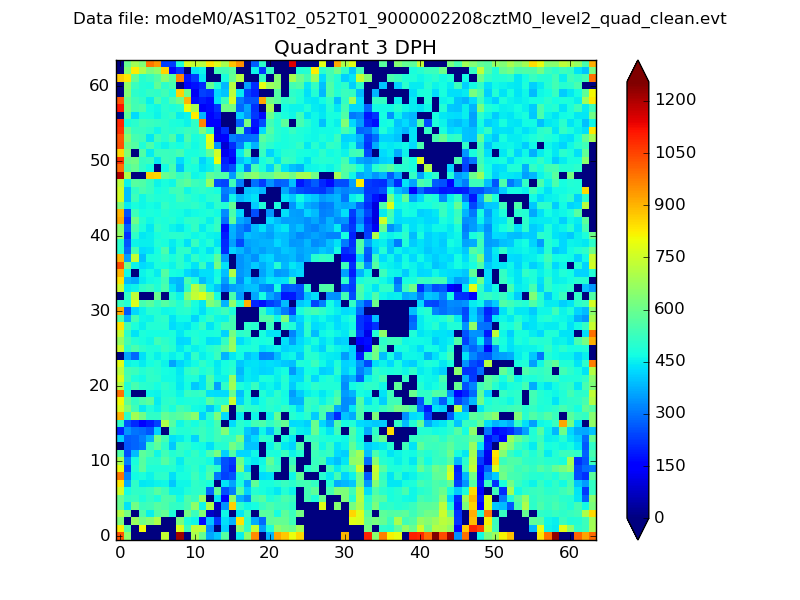 |
 |
Quadrant C |
| Plot type | Count rate plots | Images |
|---|---|---|
| Comparison with Poisson distribution Blue bars denote a histogram of data divided into 1 sec bins. Red curve is a Poisson curve with rate = median count rate of data. |
 |
 |
| Quadrant-wise count rates Data is divided into 100 sec bins |
 |
|
| Module-wise count rates for Quadrant A Data is divided into 100 sec bins |
 |
 |
| Module-wise count rates for Quadrant B Data is divided into 100 sec bins |
 |
 |
| Module-wise count rates for Quadrant C Data is divided into 100 sec bins |
 |
 |
| Module-wise count rates for Quadrant D Data is divided into 100 sec bins |
 |
 |
| Parameter | Plot |
|---|---|
| CZT HV Monitor |  |
| D_VDD | 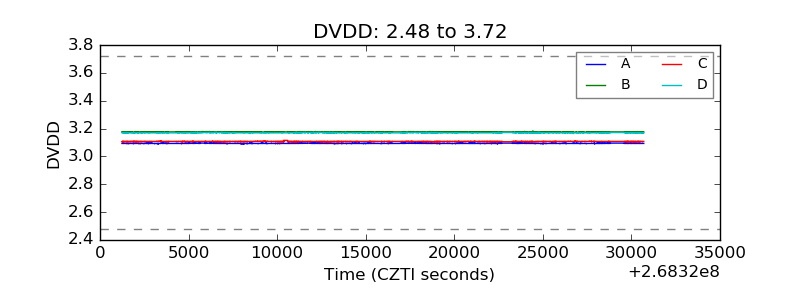 |
| Temperature 1 |  |
| Veto HV Monitor | 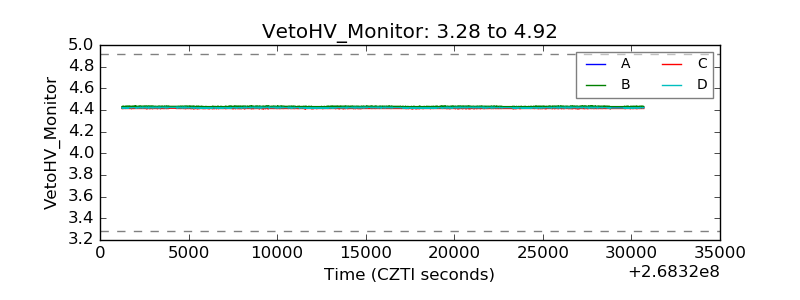 |
| Veto LLD | 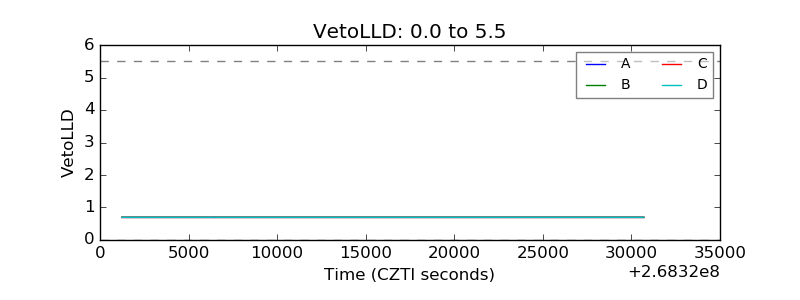 |
| Alpha Counter | 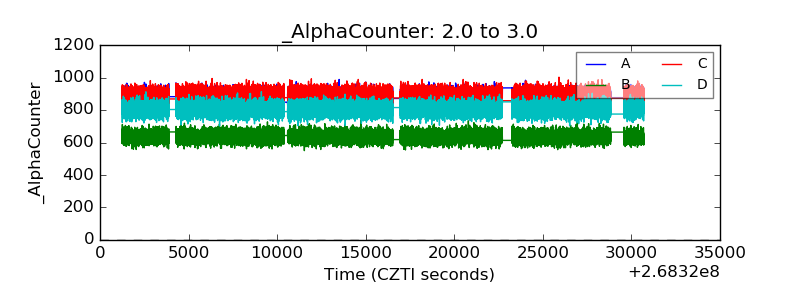 |
| _CPM_Rate | 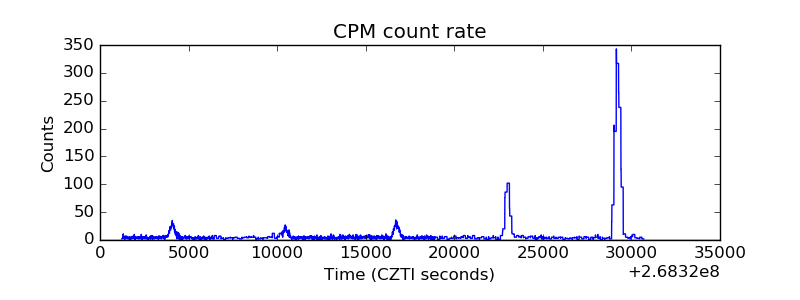 |
| CZT Counter | 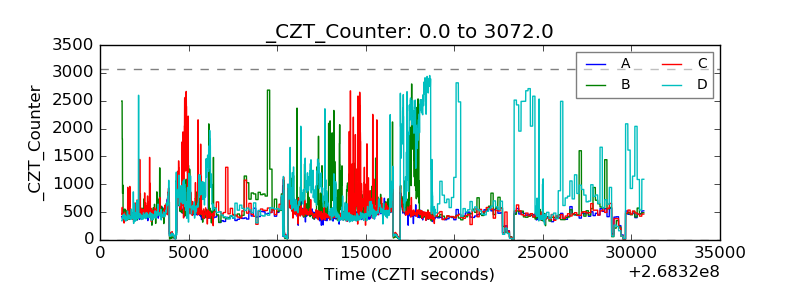 |
| +2.5 Volts monitor |  |
| +5 Volts monitor |  |
| _ROLL_ROT |  |
| _Roll_DEC | 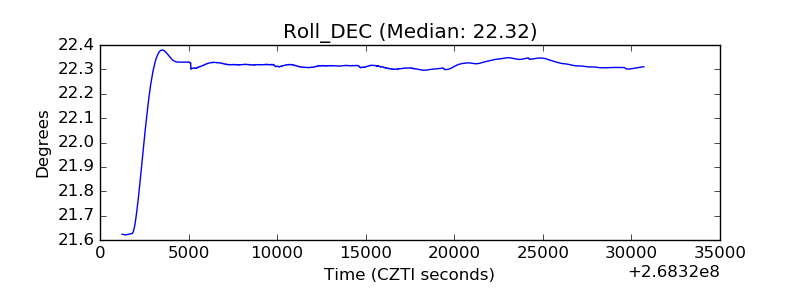 |
| _Roll_RA | 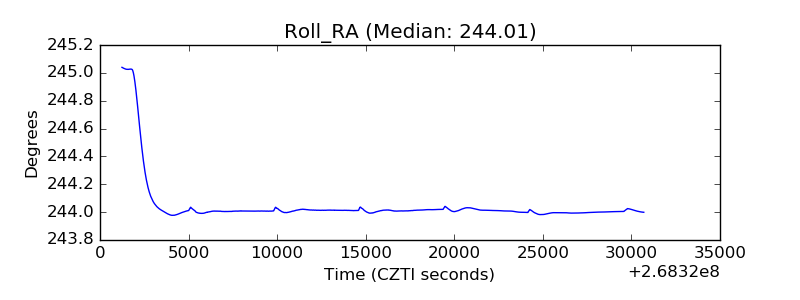 |
| Veto Counter | 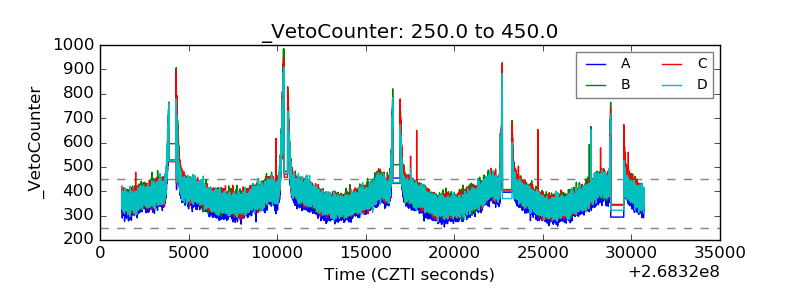 |