| Param | Original file | Final file |
|---|---|---|
| Filename | modeM0/AS1T02_052T01_9000002208_14942cztM0_level2.evt | modeM0/AS1T02_052T01_9000002208_14942cztM0_level2_quad_clean.evt |
| Size (bytes) | 606,222,720 | 98,951,040 |
| Size | 578.1 MB | 94.4 MB |
| Events in quadrant A | 3,489,126 | 647,010 |
| Events in quadrant B | 5,006,798 | 627,254 |
| Events in quadrant C | 4,411,466 | 611,087 |
| Events in quadrant D | 4,965,104 | 610,596 |
| Mode SS | |||
|---|---|---|---|
| Quadrant | BADHDUFLAG | Total packets | Discarded packets |
| A | 0 | 144 | 0 |
| B | 0 | 144 | 0 |
| C | 0 | 144 | 0 |
| D | 0 | 144 | 0 |
| Mode M9 | |||
|---|---|---|---|
| Quadrant | BADHDUFLAG | Total packets | Discarded packets |
| A | 0 | 2 | 0 |
| B | 0 | 2 | 0 |
| C | 0 | 2 | 0 |
| D | 0 | 2 | 0 |
| Mode M0 | |||
|---|---|---|---|
| Quadrant | BADHDUFLAG | Total packets | Discarded packets |
| A | 0 | 15045 | 2 |
| B | 0 | 19561 | 1 |
| C | 0 | 17527 | 1 |
| D | 0 | 19727 | 1 |
| Quadrant | Total seconds | Saturated seconds | Saturation percentage |
|---|---|---|---|
| A | 7189 | 134 | 1.863959% |
| B | 7189 | 437 | 6.078731% |
| C | 7189 | 315 | 4.381694% |
| D | 7189 | 163 | 2.267353% |
Noise dominated data is calculated using 1-second bins in cleaned event files. If a bin has >2000 counts, and if more than 50% of those come from <1% of pixels, then it is considered to be noise-dominated and hence unusable.
| Quadrant | # 1 sec bins | Bins with >0 counts | Bins with >2000 counts | High rate bins dominated by noise | Noise dominated (total time) | Noise dominated (detector-on time) | Marked lightcurve |
|---|---|---|---|---|---|---|---|
| A | 7420 | 7192 | 4 | 4 | 0.05% | 0.06% | 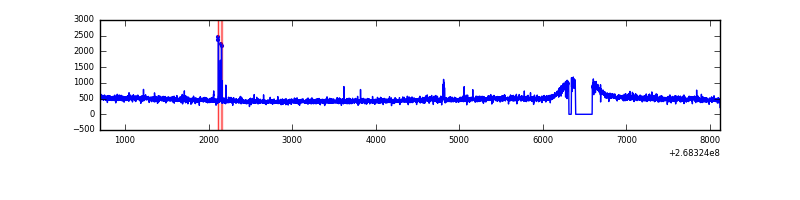 |
| B | 7420 | 7192 | 173 | 173 | 2.33% | 2.41% | 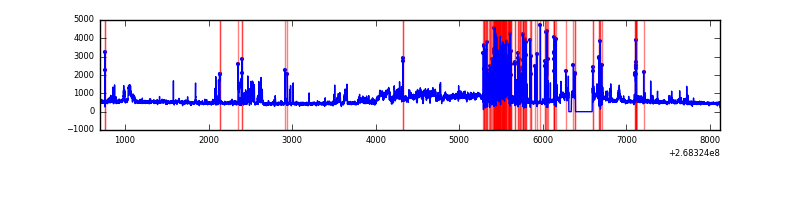 |
| C | 7420 | 7192 | 168 | 168 | 2.26% | 2.34% | 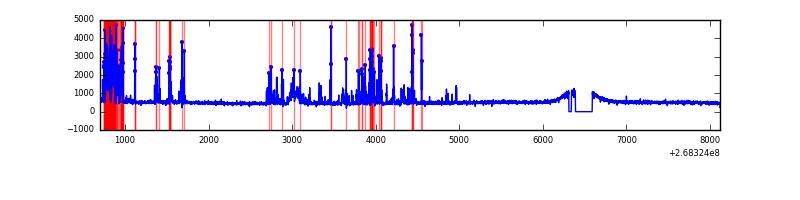 |
| D | 7420 | 7192 | 40 | 40 | 0.54% | 0.56% | 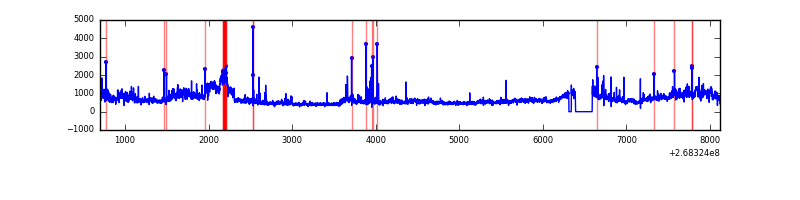 |
Top three noisy pixels from each quadrant. If the there are fewer than three noisy pixels in the level2.evt file, extra rows are filled as -1
| Pixel properties | Quadrant properties | ||||||
|---|---|---|---|---|---|---|---|
| Quadrant | DetID | PixID | Counts | Sigma | Mean | Median | Sigma |
| A | 15 | 69 | 22876 | 121.07 | 891 | 871 | 181.7 |
| A | 12 | 189 | 21113 | 111.37 | 891 | 871 | 181.7 |
| A | 4 | 2 | 12573 | 64.38 | 891 | 871 | 181.7 |
| B | 10 | 16 | 1364249 | 8171.69 | 856 | 834 | 166.8 |
| B | 0 | 189 | 144435 | 860.68 | 856 | 834 | 166.8 |
| B | 0 | 219 | 71075 | 420.99 | 856 | 834 | 166.8 |
| C | 9 | 236 | 908465 | 4549.18 | 848 | 853 | 199.5 |
| C | 3 | 233 | 191000 | 953.06 | 848 | 853 | 199.5 |
| C | 7 | 247 | 6758 | 29.6 | 848 | 853 | 199.5 |
| D | 7 | 254 | 1505019 | 7294.1 | 861 | 841 | 206.2 |
| D | 13 | 249 | 67015 | 320.89 | 861 | 841 | 206.2 |
| D | 10 | 70 | 42082 | 199.99 | 861 | 841 | 206.2 |
Histogram calculated using DETX and DETY for each event in the final _common_clean file
| Quadrant A |  |
 |
Quadrant B |
|---|---|---|---|
| Quadrant D |  |
 |
Quadrant C |
| Plot type | Count rate plots | Images |
|---|---|---|
| Comparison with Poisson distribution Blue bars denote a histogram of data divided into 1 sec bins. Red curve is a Poisson curve with rate = median count rate of data. |
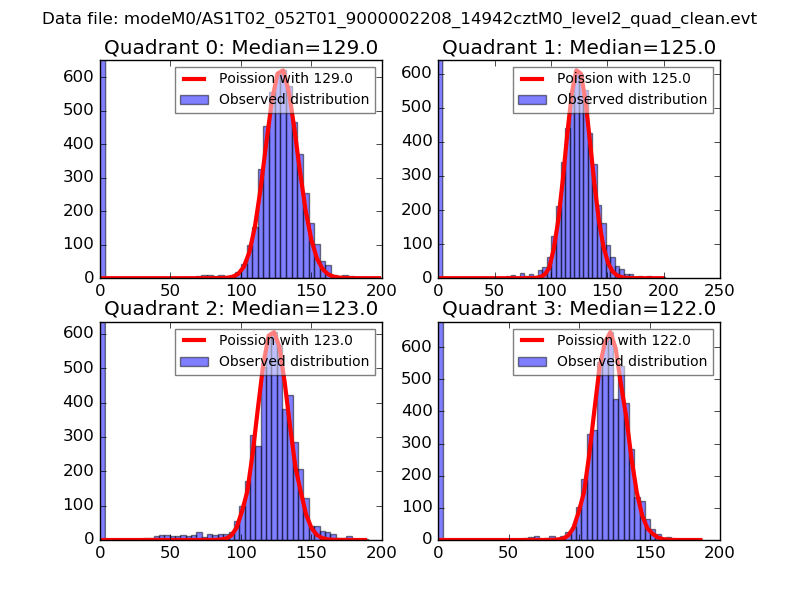 |
 |
| Quadrant-wise count rates Data is divided into 100 sec bins |
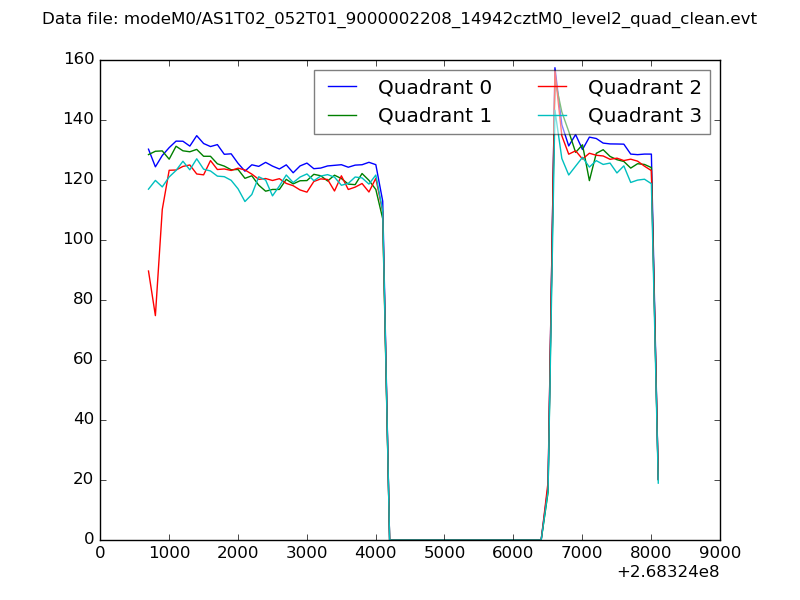 |
|
| Module-wise count rates for Quadrant A Data is divided into 100 sec bins |
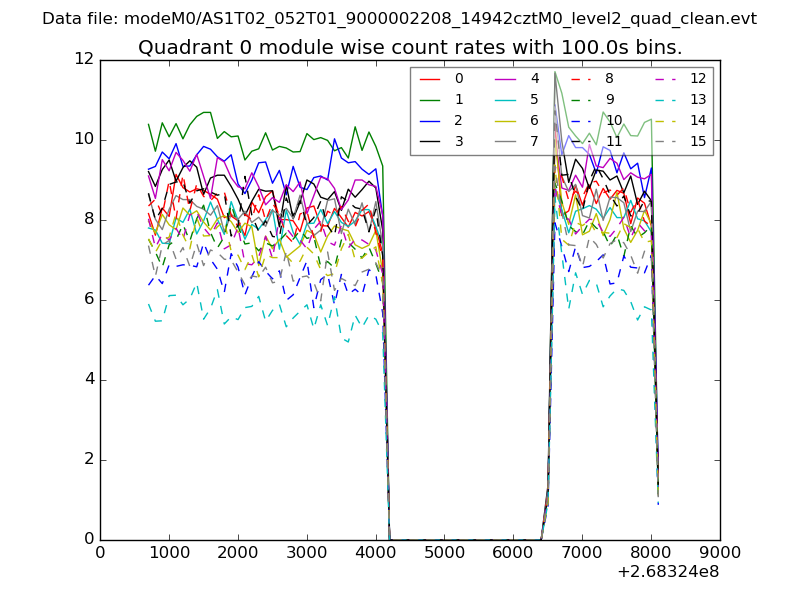 |
 |
| Module-wise count rates for Quadrant B Data is divided into 100 sec bins |
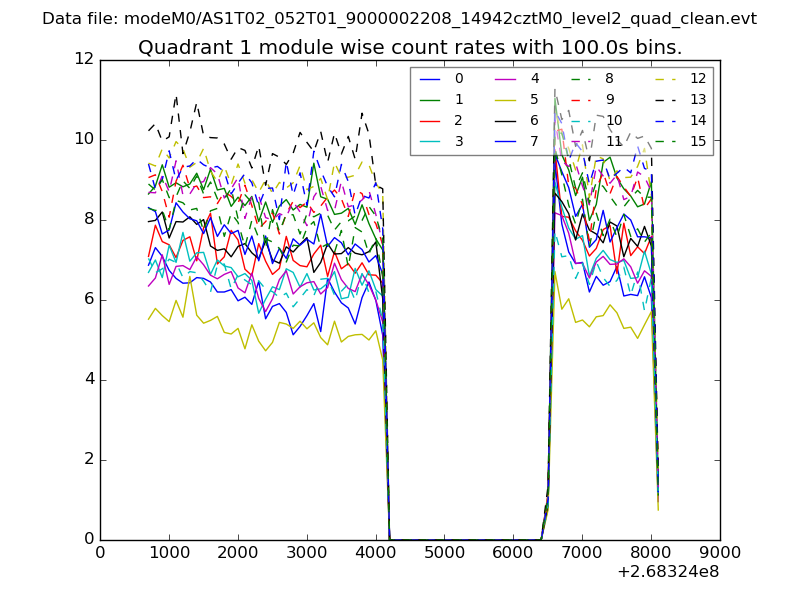 |
 |
| Module-wise count rates for Quadrant C Data is divided into 100 sec bins |
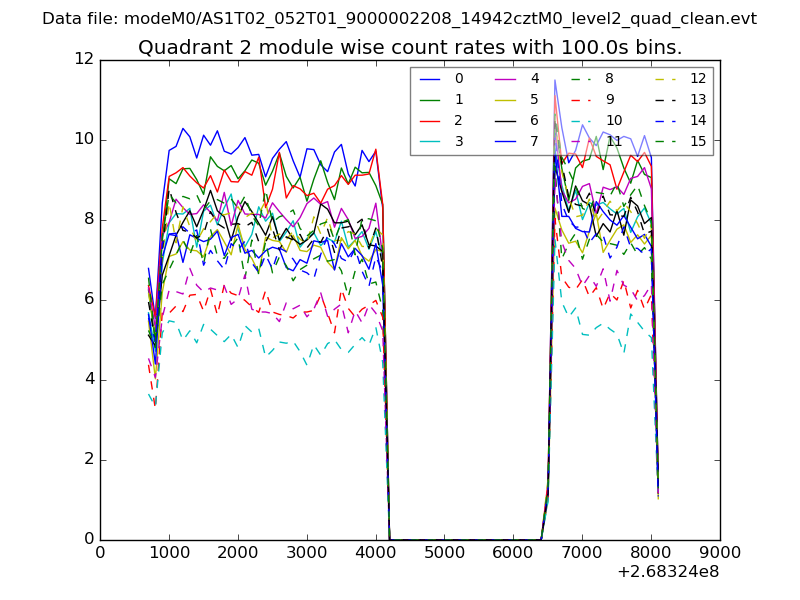 |
 |
| Module-wise count rates for Quadrant D Data is divided into 100 sec bins |
 |
 |
| Parameter | Plot |
|---|---|
| CZT HV Monitor | 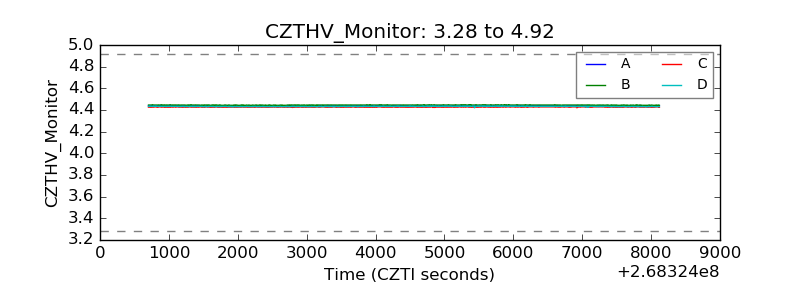 |
| D_VDD |  |
| Temperature 1 |  |
| Veto HV Monitor |  |
| Veto LLD |  |
| Alpha Counter | 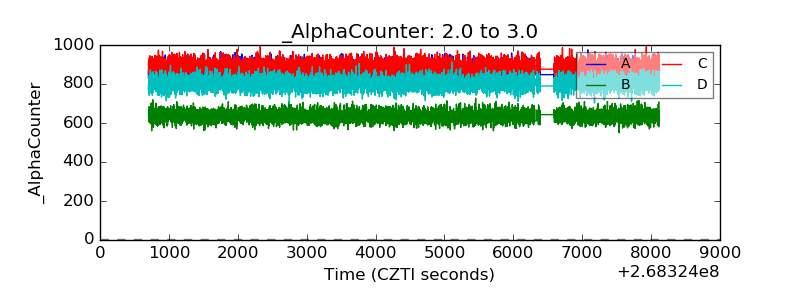 |
| _CPM_Rate | 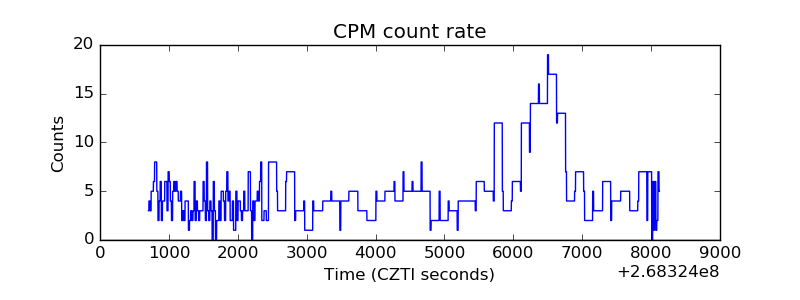 |
| CZT Counter |  |
| +2.5 Volts monitor |  |
| +5 Volts monitor |  |
| _ROLL_ROT |  |
| _Roll_DEC |  |
| _Roll_RA |  |
| Veto Counter | 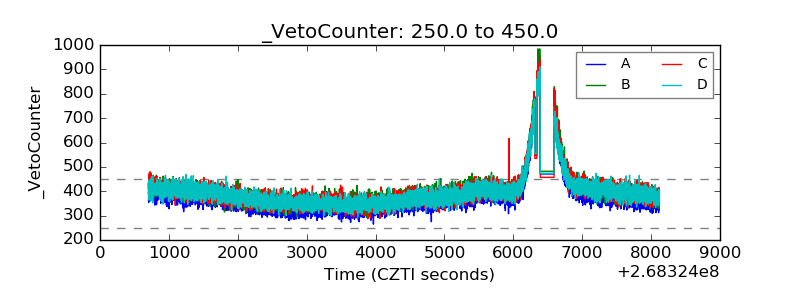 |