| Param | Original file | Final file |
|---|---|---|
| Filename | modeM0/AS1T02_052T01_9000002208_14943cztM0_level2.evt | modeM0/AS1T02_052T01_9000002208_14943cztM0_level2_quad_clean.evt |
| Size (bytes) | 661,265,280 | 96,436,800 |
| Size | 630.6 MB | 92.0 MB |
| Events in quadrant A | 3,396,434 | 640,501 |
| Events in quadrant B | 5,168,439 | 607,476 |
| Events in quadrant C | 4,126,572 | 623,474 |
| Events in quadrant D | 6,845,580 | 544,888 |
| Mode SS | |||
|---|---|---|---|
| Quadrant | BADHDUFLAG | Total packets | Discarded packets |
| A | 0 | 146 | 0 |
| B | 0 | 146 | 0 |
| C | 0 | 146 | 0 |
| D | 0 | 146 | 0 |
| Mode M9 | |||
|---|---|---|---|
| Quadrant | BADHDUFLAG | Total packets | Discarded packets |
| A | 0 | 4 | 0 |
| B | 0 | 4 | 0 |
| C | 0 | 4 | 0 |
| D | 0 | 4 | 0 |
| Mode M0 | |||
|---|---|---|---|
| Quadrant | BADHDUFLAG | Total packets | Discarded packets |
| A | 0 | 14842 | 2 |
| B | 0 | 20061 | 1 |
| C | 0 | 16849 | 1 |
| D | 0 | 25395 | 1 |
| Quadrant | Total seconds | Saturated seconds | Saturation percentage |
|---|---|---|---|
| A | 7233 | 37 | 0.511544% |
| B | 7233 | 341 | 4.714503% |
| C | 7233 | 89 | 1.230471% |
| D | 7233 | 1226 | 16.950090% |
Noise dominated data is calculated using 1-second bins in cleaned event files. If a bin has >2000 counts, and if more than 50% of those come from <1% of pixels, then it is considered to be noise-dominated and hence unusable.
| Quadrant | # 1 sec bins | Bins with >0 counts | Bins with >2000 counts | High rate bins dominated by noise | Noise dominated (total time) | Noise dominated (detector-on time) | Marked lightcurve |
|---|---|---|---|---|---|---|---|
| A | 7649 | 7235 | 0 | 0 | 0.00% | 0.00% | 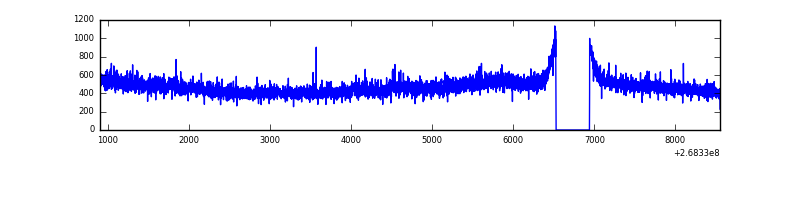 |
| B | 7649 | 7235 | 198 | 198 | 2.59% | 2.74% | 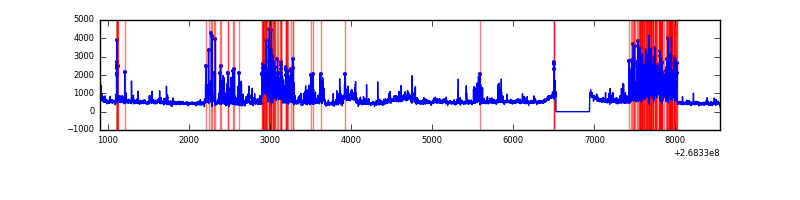 |
| C | 7649 | 7235 | 63 | 63 | 0.82% | 0.87% | 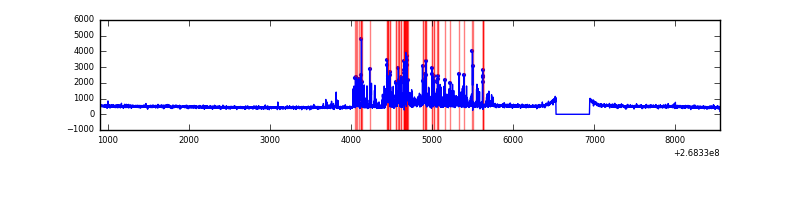 |
| D | 7648 | 7234 | 1084 | 1084 | 14.17% | 14.98% | 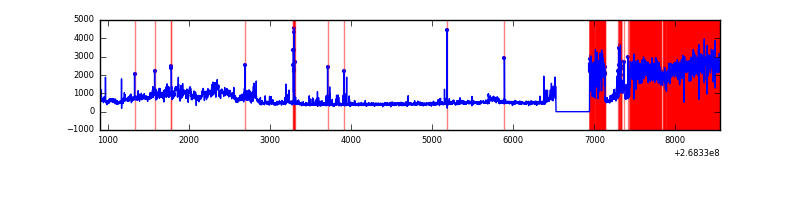 |
Top three noisy pixels from each quadrant. If the there are fewer than three noisy pixels in the level2.evt file, extra rows are filled as -1
| Pixel properties | Quadrant properties | ||||||
|---|---|---|---|---|---|---|---|
| Quadrant | DetID | PixID | Counts | Sigma | Mean | Median | Sigma |
| A | 12 | 189 | 43793 | 242.57 | 869 | 849 | 177.0 |
| A | 0 | 226 | 7584 | 38.04 | 869 | 849 | 177.0 |
| A | 1 | 162 | 6977 | 34.61 | 869 | 849 | 177.0 |
| B | 10 | 16 | 1665452 | 10189.27 | 847 | 826 | 163.4 |
| B | 0 | 189 | 69371 | 419.57 | 847 | 826 | 163.4 |
| B | 0 | 219 | 64458 | 389.49 | 847 | 826 | 163.4 |
| C | 9 | 236 | 657232 | 3338.86 | 838 | 844 | 196.6 |
| C | 3 | 233 | 191917 | 971.94 | 838 | 844 | 196.6 |
| C | 7 | 247 | 8611 | 39.51 | 838 | 844 | 196.6 |
| D | 7 | 254 | 3669969 | 19160.29 | 795 | 776 | 191.5 |
| D | 10 | 70 | 43031 | 220.65 | 795 | 776 | 191.5 |
| D | 13 | 249 | 41294 | 211.58 | 795 | 776 | 191.5 |
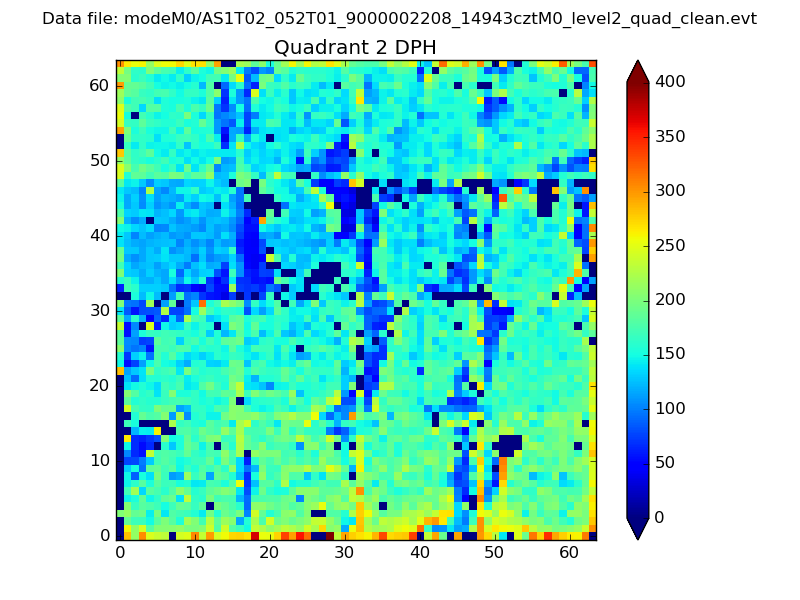
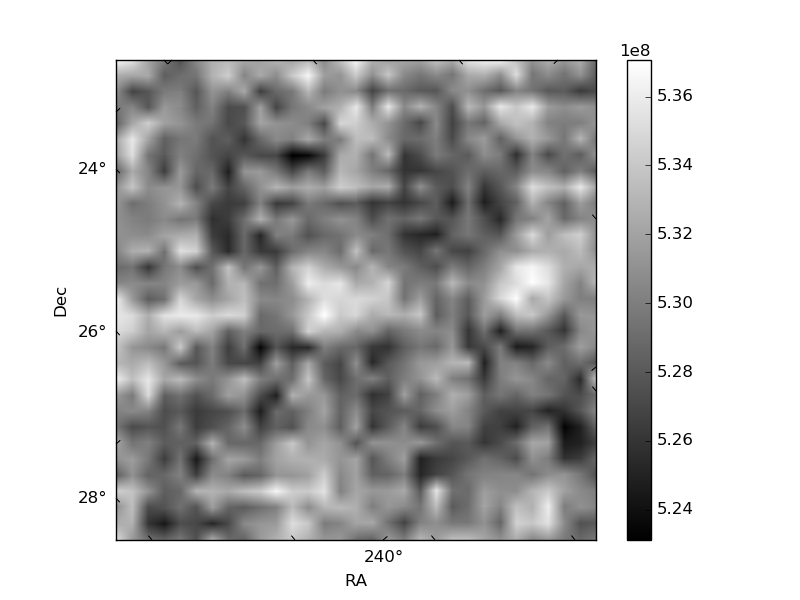
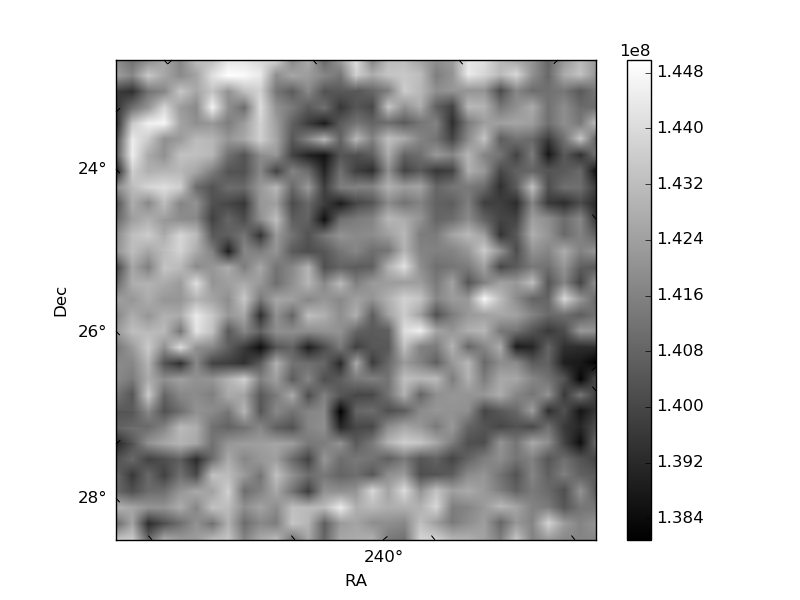
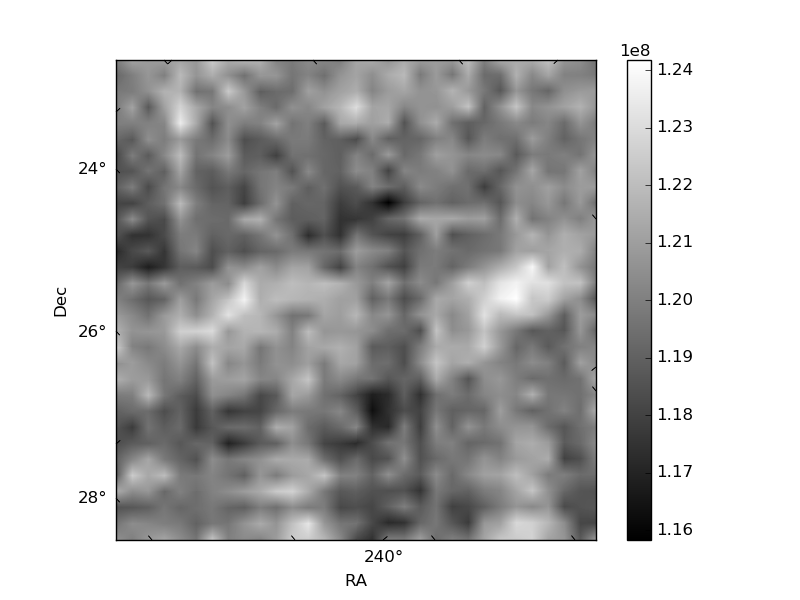
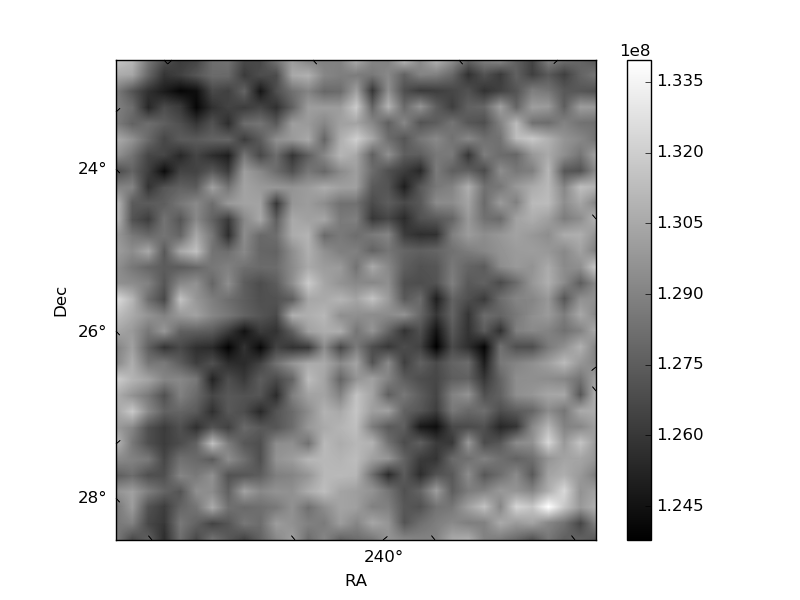
Histogram calculated using DETX and DETY for each event in the final _common_clean file
| Quadrant A | 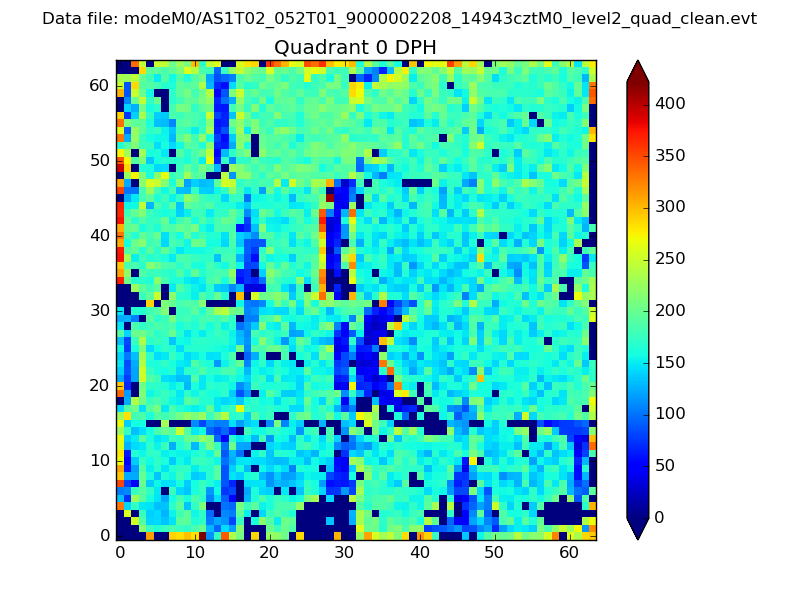 |
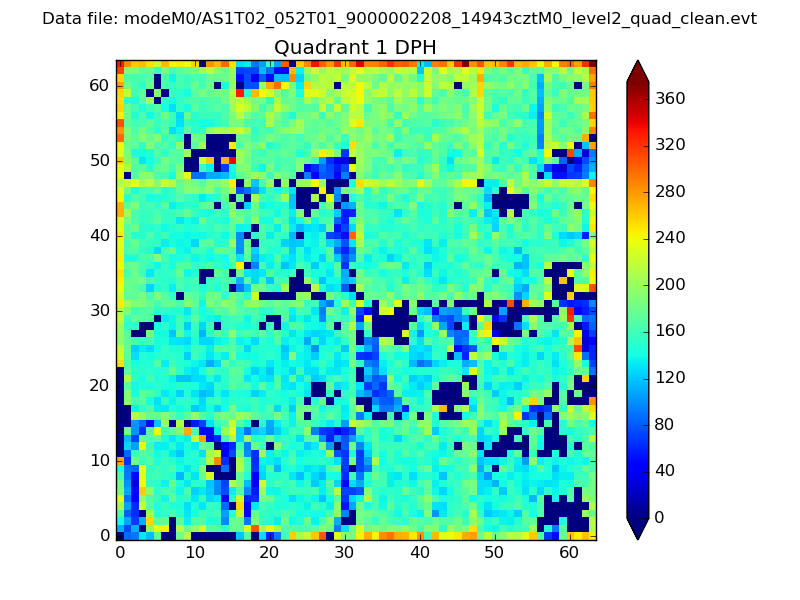 |
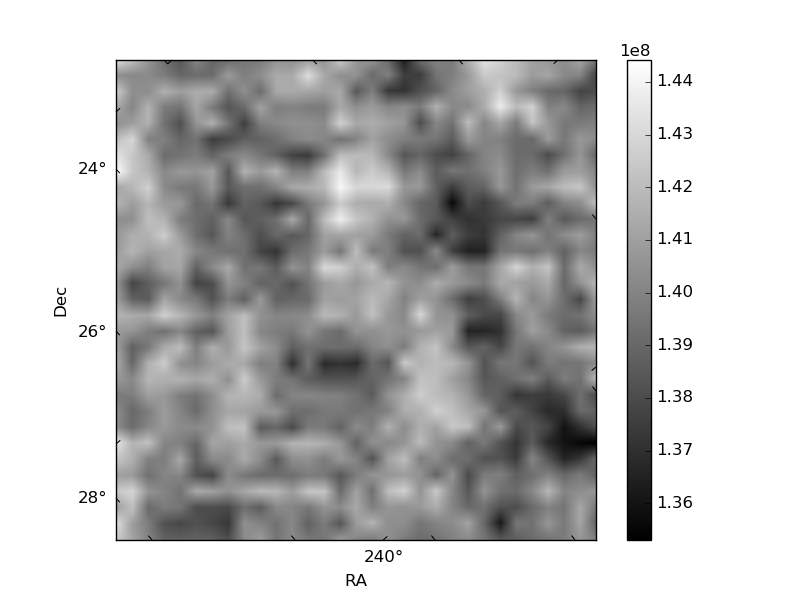
Quadrant B |
|---|---|---|---|
| Quadrant D | 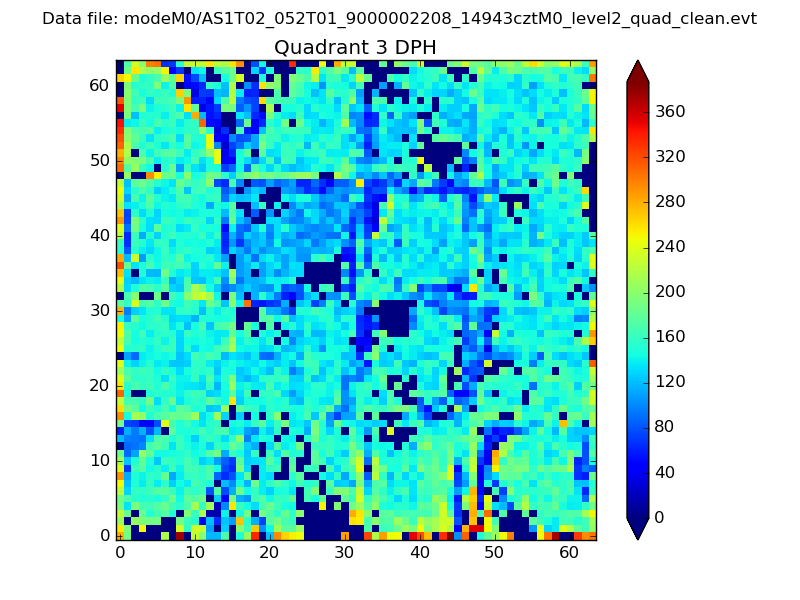 |
 |
Quadrant C |
| Plot type | Count rate plots | Images |
|---|---|---|
| Comparison with Poisson distribution Blue bars denote a histogram of data divided into 1 sec bins. Red curve is a Poisson curve with rate = median count rate of data. |
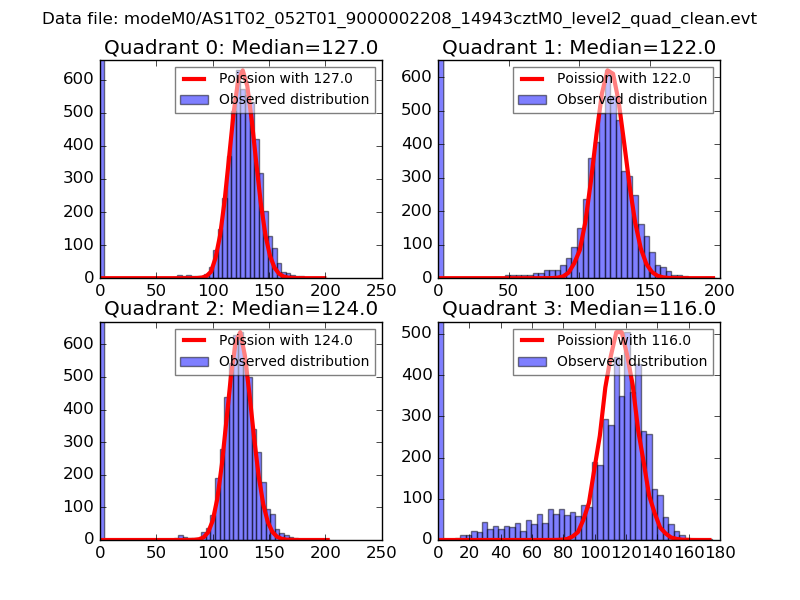 |
 |
| Quadrant-wise count rates Data is divided into 100 sec bins |
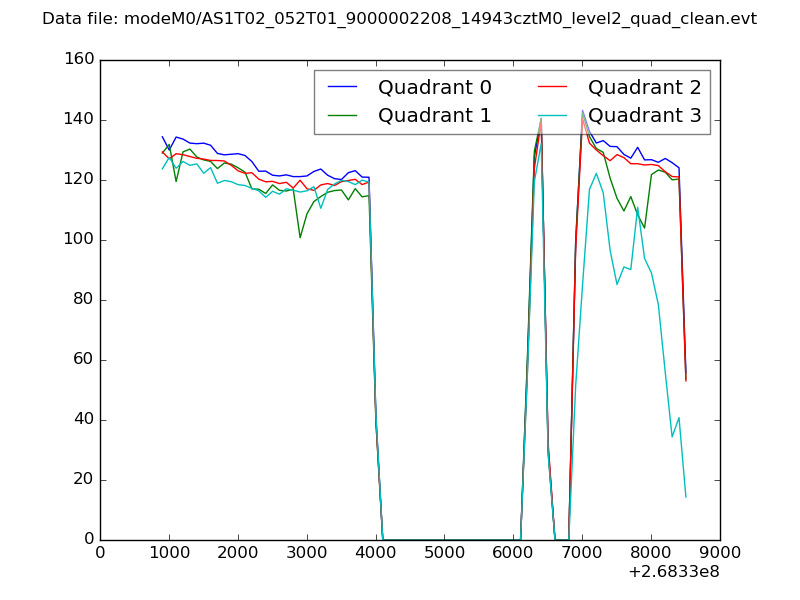 |
|
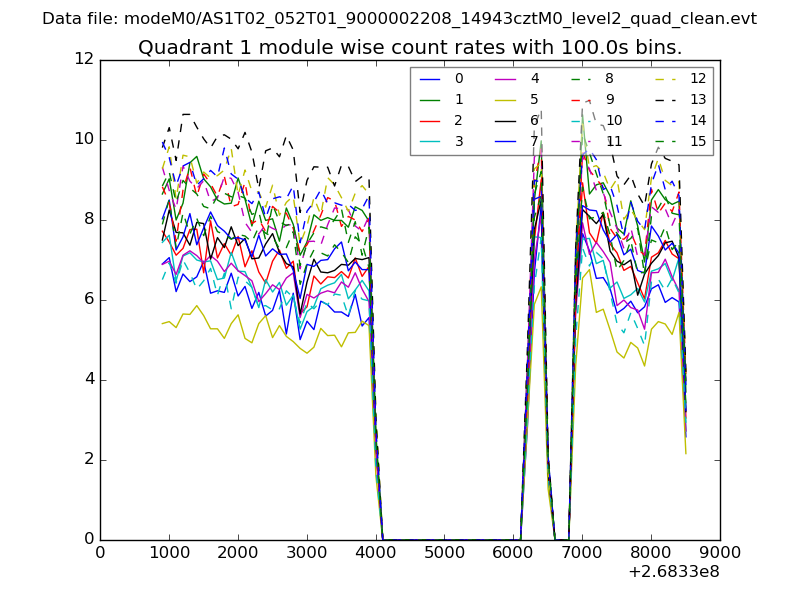
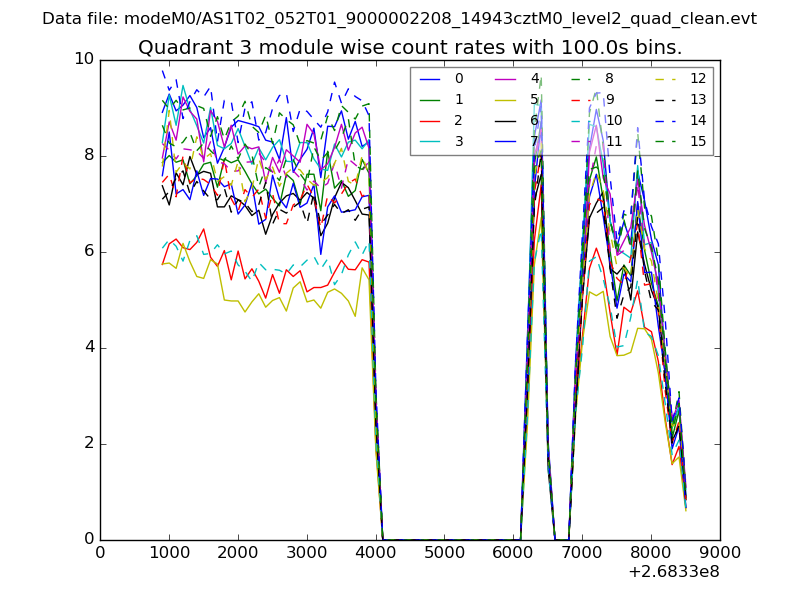
| Module-wise count rates for Quadrant A Data is divided into 100 sec bins |
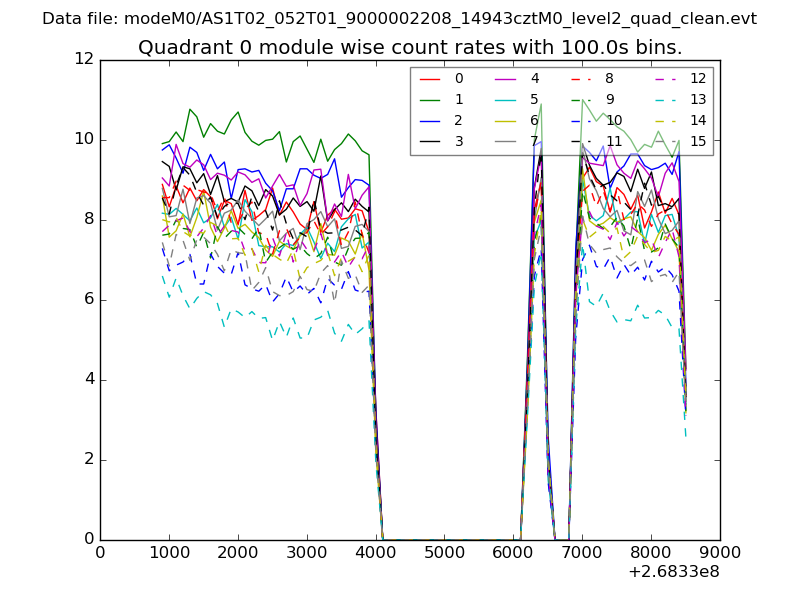 |
 |
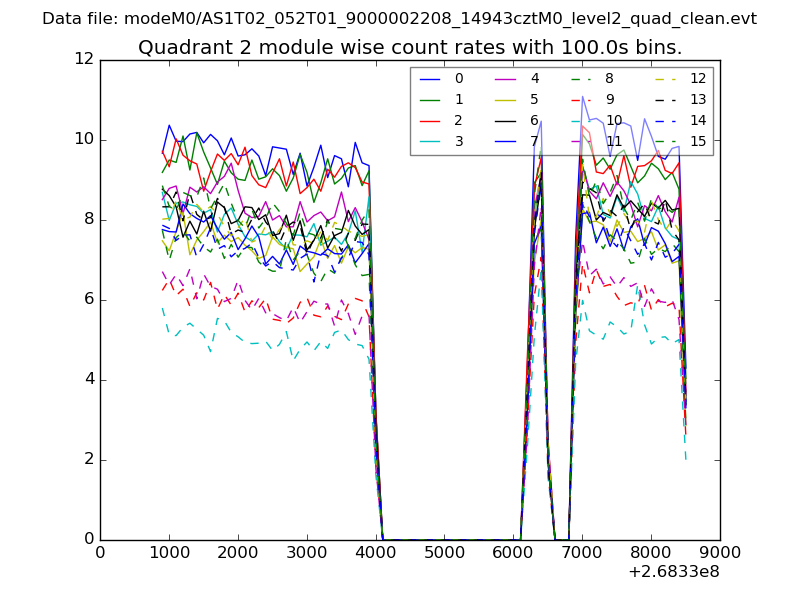
| Module-wise count rates for Quadrant B Data is divided into 100 sec bins |
 |
 |
| Module-wise count rates for Quadrant C Data is divided into 100 sec bins |
 |
 |
| Module-wise count rates for Quadrant D Data is divided into 100 sec bins |
 |
 |
| Parameter | Plot |
|---|---|
| CZT HV Monitor | 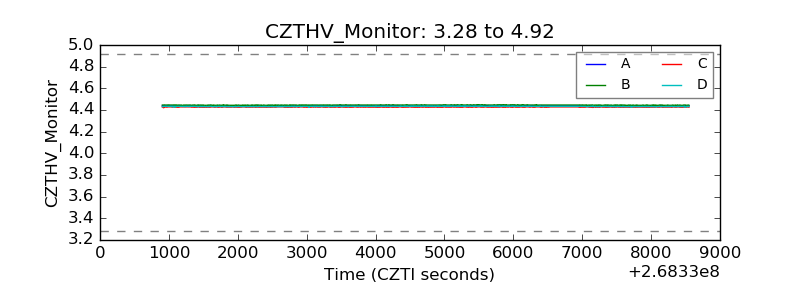 |
| D_VDD | 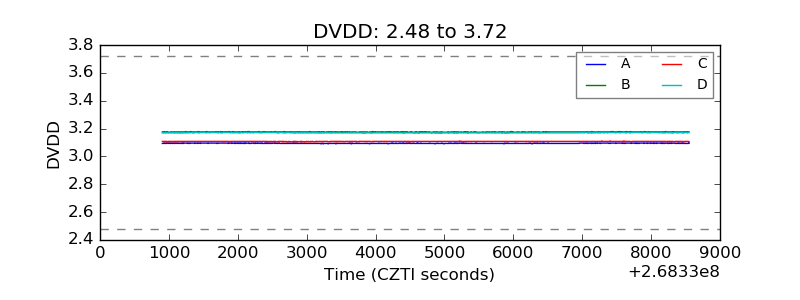 |
| Temperature 1 | 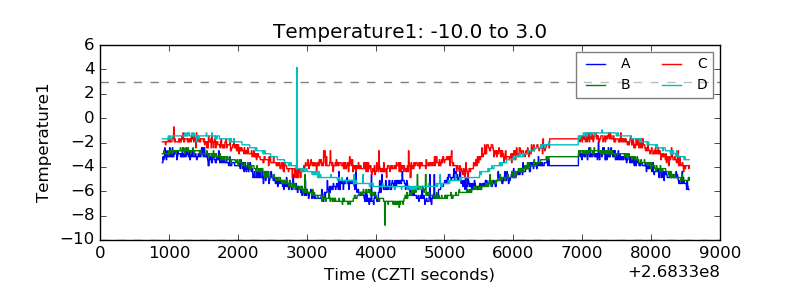 |
| Veto HV Monitor | 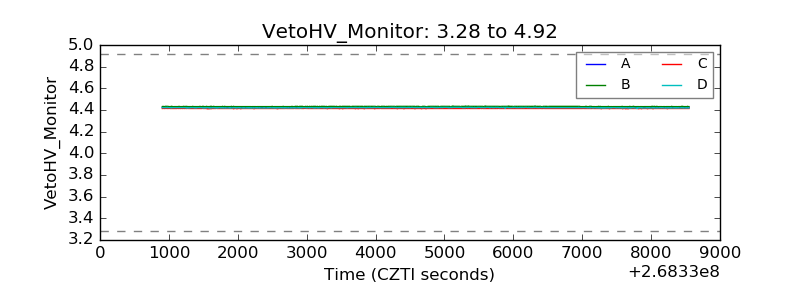 |
| Veto LLD | 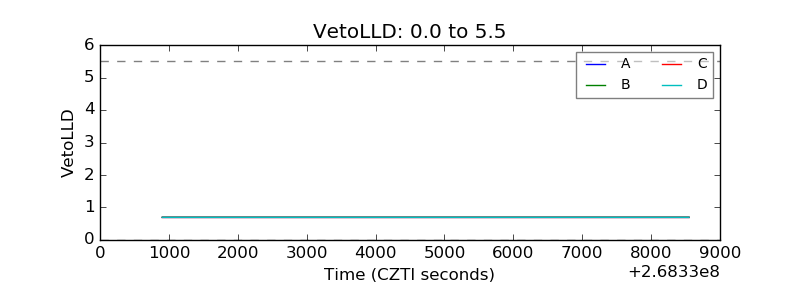 |
| Alpha Counter | 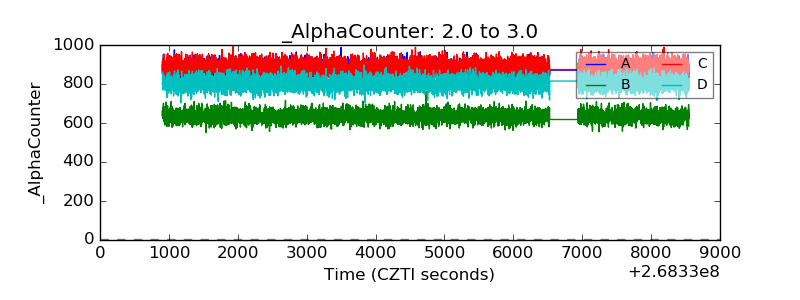 |
| _CPM_Rate | 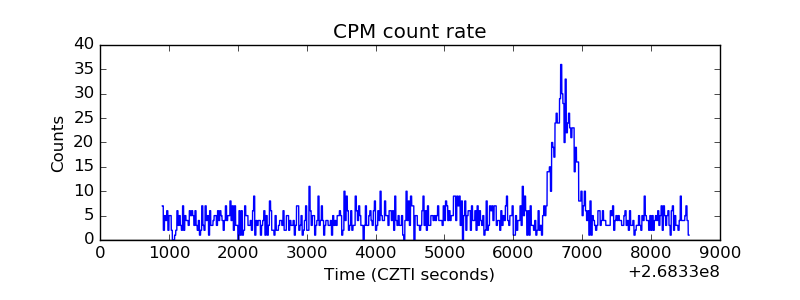 |
| CZT Counter | 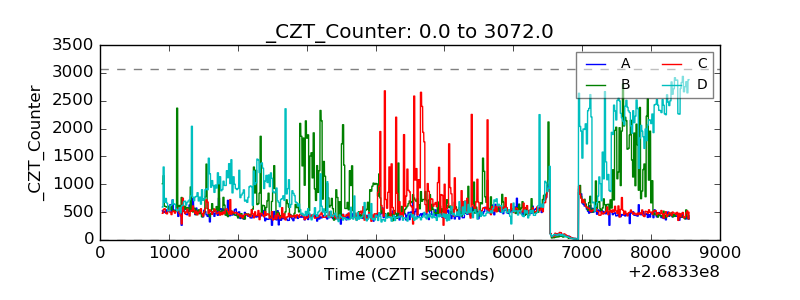 |
| +2.5 Volts monitor |  |
| +5 Volts monitor |  |
| _ROLL_ROT | 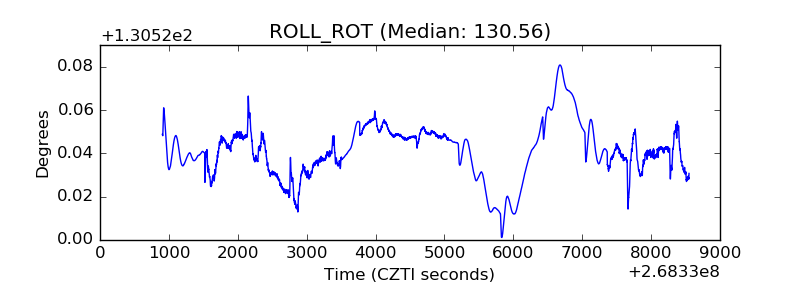 |
| _Roll_DEC | 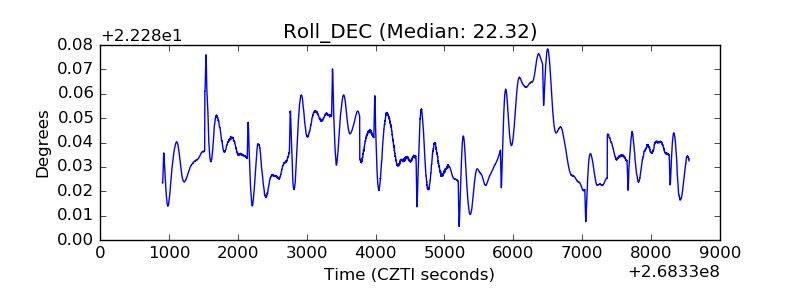 |
| _Roll_RA | 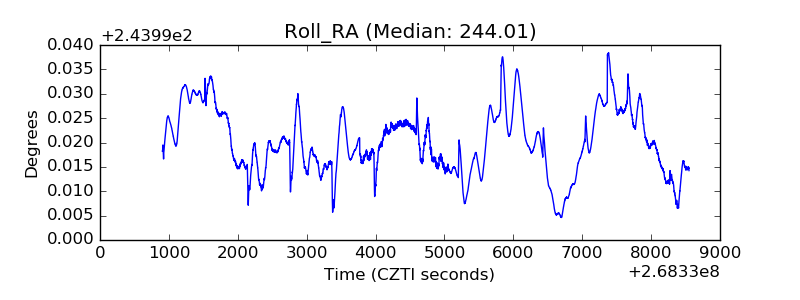 |
| Veto Counter |  |