| Param | Original file | Final file |
|---|---|---|
| Filename | modeM0/AS1T02_052T01_9000002208_14946cztM0_level2.evt | modeM0/AS1T02_052T01_9000002208_14946cztM0_level2_quad_clean.evt |
| Size (bytes) | 1,101,101,760 | 151,197,120 |
| Size | 1.0 GB | 144.2 MB |
| Events in quadrant A | 5,640,290 | 989,435 |
| Events in quadrant B | 6,656,921 | 959,639 |
| Events in quadrant C | 5,838,146 | 972,276 |
| Events in quadrant D | 14,385,164 | 810,669 |
| Mode SS | |||
|---|---|---|---|
| Quadrant | BADHDUFLAG | Total packets | Discarded packets |
| A | 0 | 252 | 0 |
| B | 0 | 252 | 0 |
| C | 0 | 252 | 0 |
| D | 0 | 252 | 0 |
| Mode M9 | |||
|---|---|---|---|
| Quadrant | BADHDUFLAG | Total packets | Discarded packets |
| A | 0 | 12 | 0 |
| B | 0 | 12 | 0 |
| C | 0 | 12 | 0 |
| D | 0 | 12 | 0 |
| Mode M0 | |||
|---|---|---|---|
| Quadrant | BADHDUFLAG | Total packets | Discarded packets |
| A | 0 | 25008 | 2 |
| B | 0 | 27947 | 2 |
| C | 0 | 25178 | 2 |
| D | 0 | 51253 | 2 |
| Quadrant | Total seconds | Saturated seconds | Saturation percentage |
|---|---|---|---|
| A | 12224 | 60 | 0.490838% |
| B | 12224 | 287 | 2.347840% |
| C | 12224 | 53 | 0.433573% |
| D | 12224 | 2791 | 22.832134% |
Noise dominated data is calculated using 1-second bins in cleaned event files. If a bin has >2000 counts, and if more than 50% of those come from <1% of pixels, then it is considered to be noise-dominated and hence unusable.
| Quadrant | # 1 sec bins | Bins with >0 counts | Bins with >2000 counts | High rate bins dominated by noise | Noise dominated (total time) | Noise dominated (detector-on time) | Marked lightcurve |
|---|---|---|---|---|---|---|---|
| A | 13511 | 12227 | 0 | 0 | 0.00% | 0.00% | 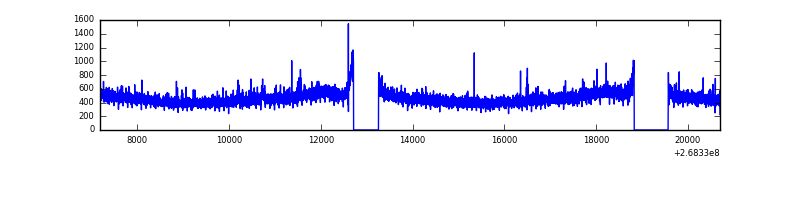 |
| B | 13511 | 12227 | 127 | 127 | 0.94% | 1.04% | 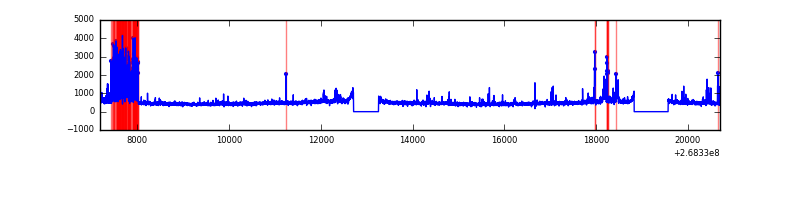 |
| C | 13511 | 12227 | 11 | 11 | 0.08% | 0.09% | 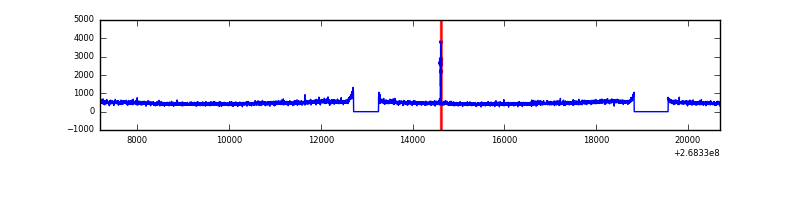 |
| D | 13511 | 12227 | 2632 | 2632 | 19.48% | 21.53% | 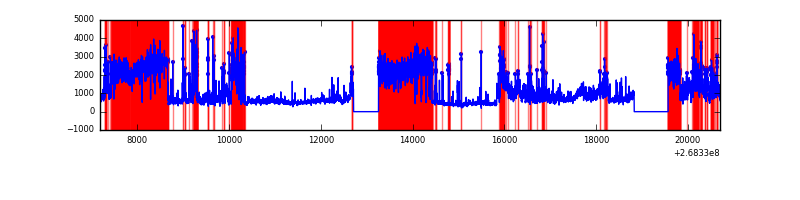 |
Top three noisy pixels from each quadrant. If the there are fewer than three noisy pixels in the level2.evt file, extra rows are filled as -1
| Pixel properties | Quadrant properties | ||||||
|---|---|---|---|---|---|---|---|
| Quadrant | DetID | PixID | Counts | Sigma | Mean | Median | Sigma |
| A | 12 | 189 | 49748 | 164.93 | 1447 | 1417 | 293.0 |
| A | 0 | 226 | 12846 | 39.0 | 1447 | 1417 | 293.0 |
| A | 12 | 194 | 10648 | 31.5 | 1447 | 1417 | 293.0 |
| B | 10 | 16 | 676906 | 2468.25 | 1429 | 1389 | 273.7 |
| B | 0 | 189 | 146643 | 530.74 | 1429 | 1389 | 273.7 |
| B | 0 | 219 | 92611 | 333.31 | 1429 | 1389 | 273.7 |
| C | 3 | 233 | 308678 | 939.59 | 1406 | 1412 | 327.0 |
| C | 10 | 22 | 38100 | 112.19 | 1406 | 1412 | 327.0 |
| C | 7 | 247 | 11678 | 31.39 | 1406 | 1412 | 327.0 |
| D | 7 | 254 | 9045112 | 29194.37 | 1291 | 1258 | 309.8 |
| D | 10 | 70 | 235307 | 755.53 | 1291 | 1258 | 309.8 |
| D | 7 | 223 | 80029 | 254.28 | 1291 | 1258 | 309.8 |
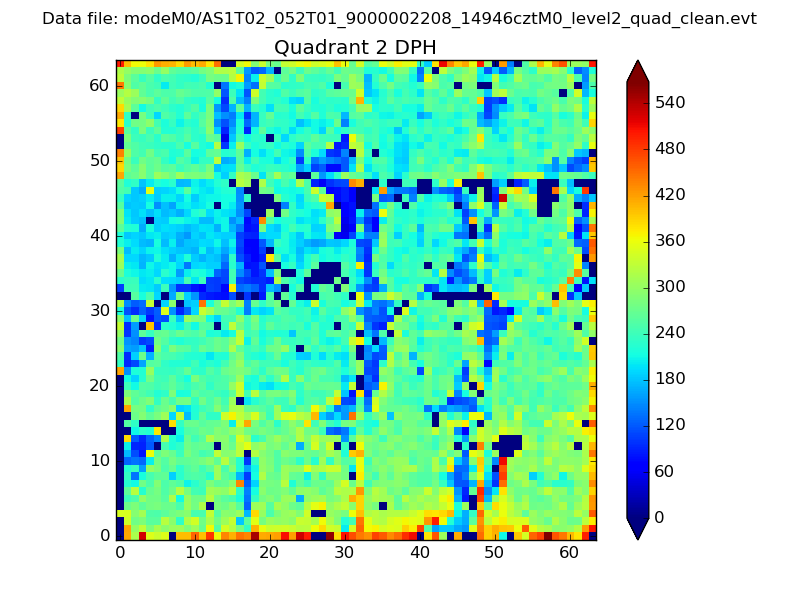
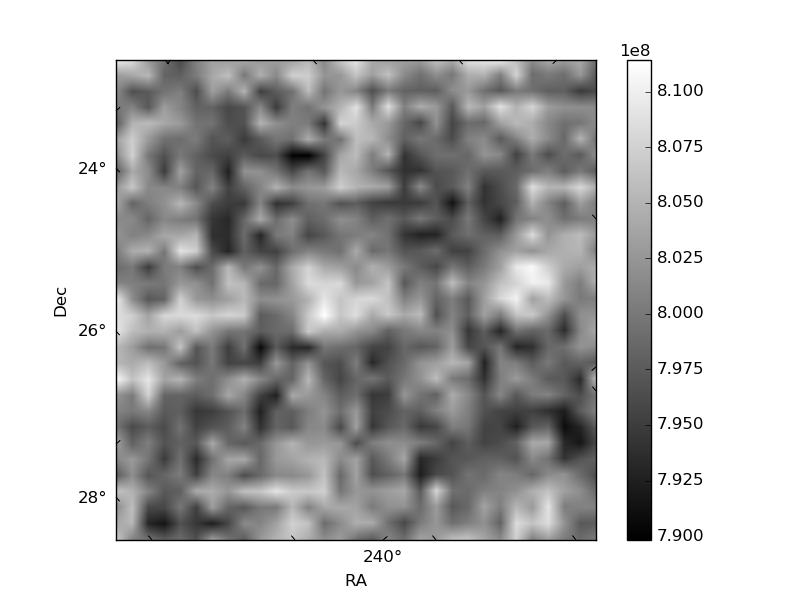
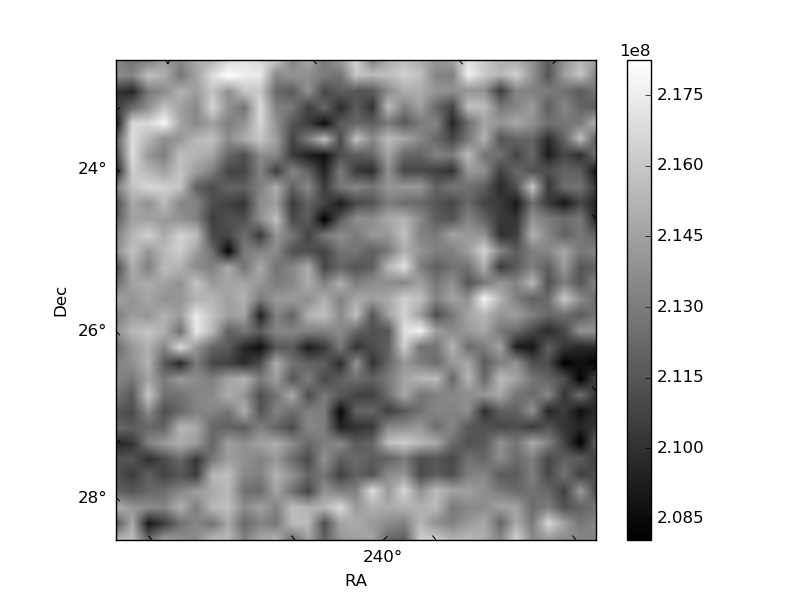
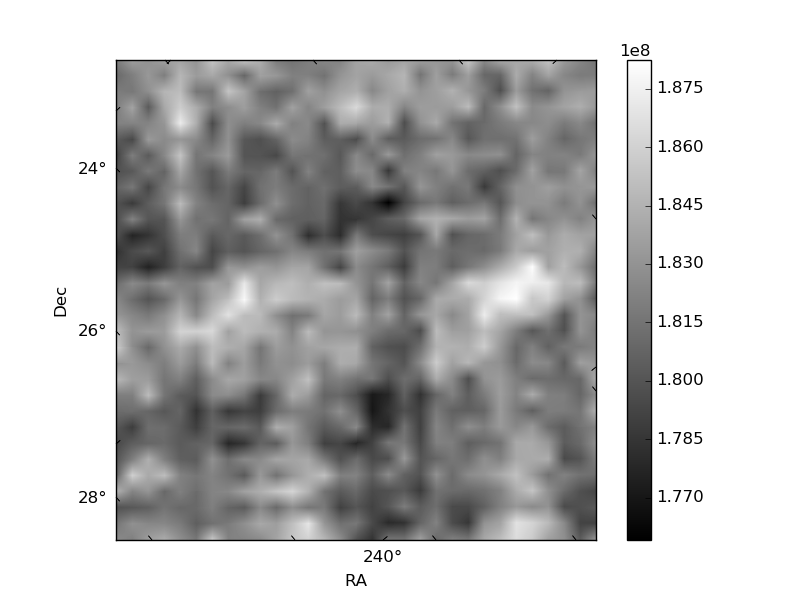
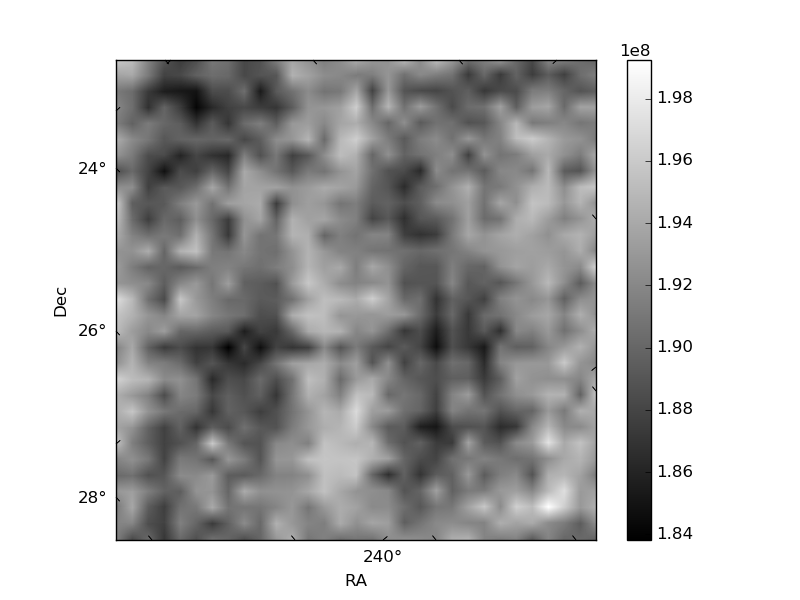
Histogram calculated using DETX and DETY for each event in the final _common_clean file
| Quadrant A | 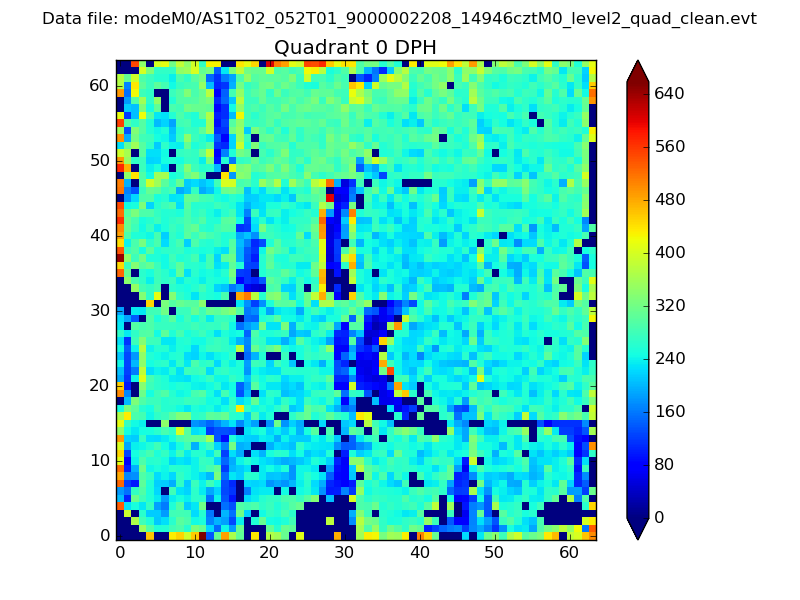 |
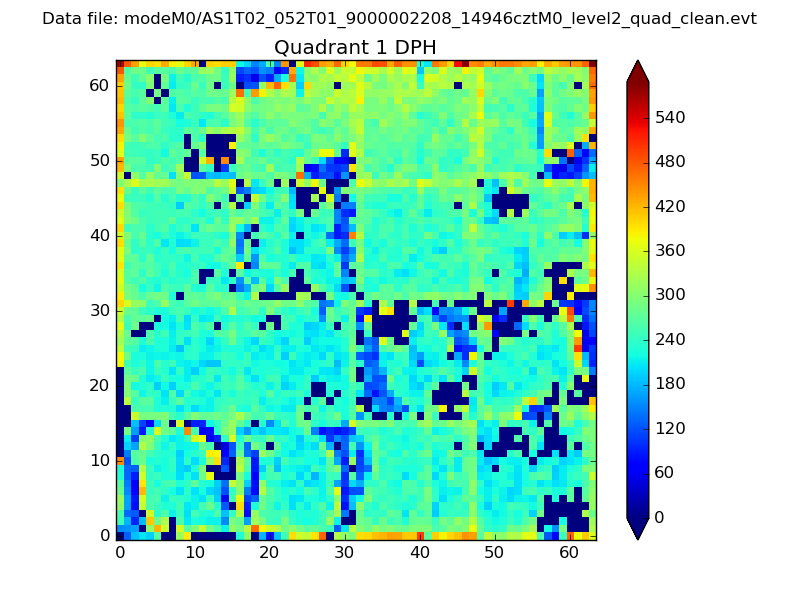 |
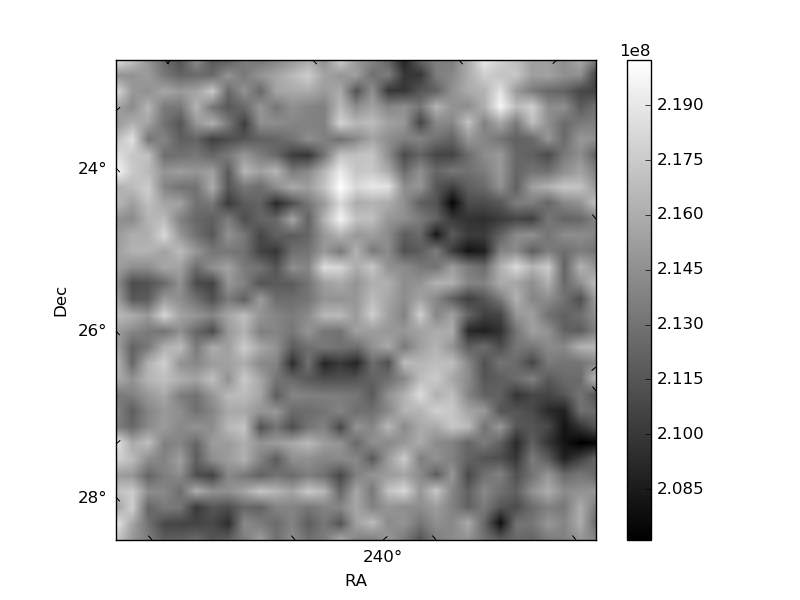
Quadrant B |
|---|---|---|---|
| Quadrant D | 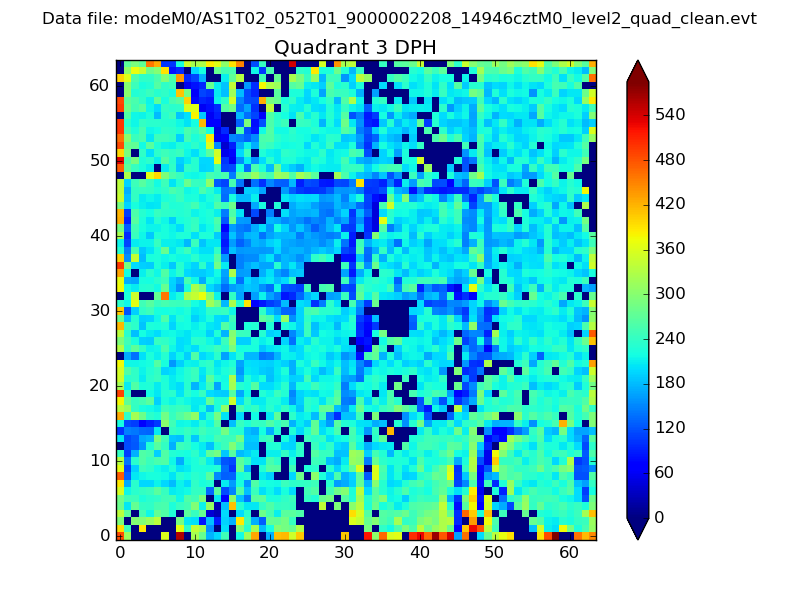 |
 |
Quadrant C |
| Plot type | Count rate plots | Images |
|---|---|---|
| Comparison with Poisson distribution Blue bars denote a histogram of data divided into 1 sec bins. Red curve is a Poisson curve with rate = median count rate of data. |
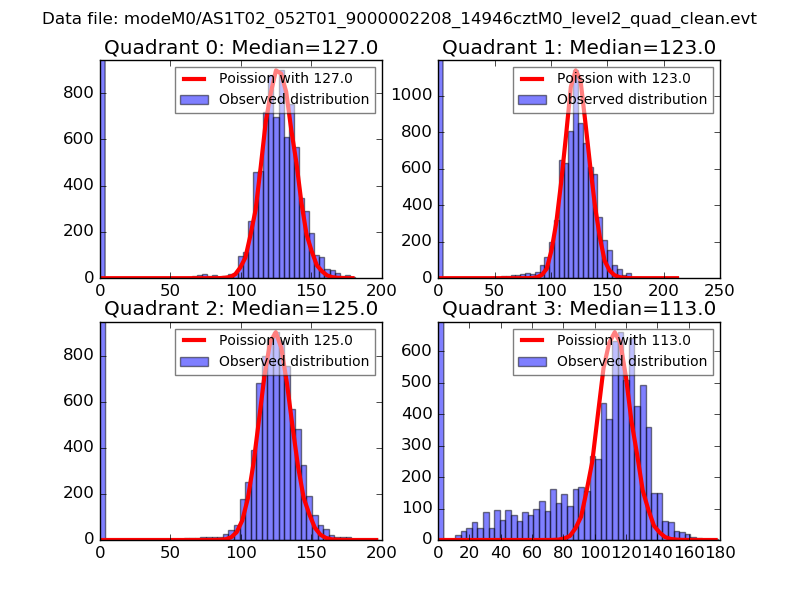 |
 |
| Quadrant-wise count rates Data is divided into 100 sec bins |
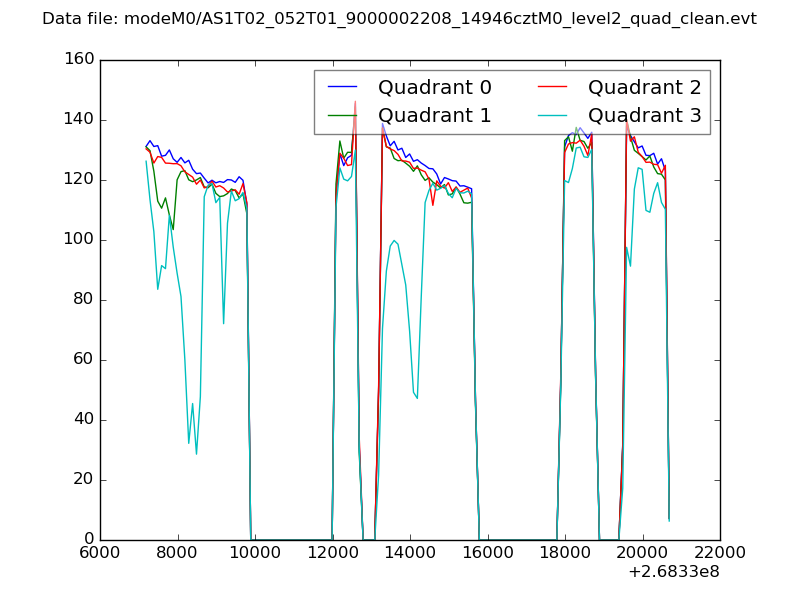 |
|
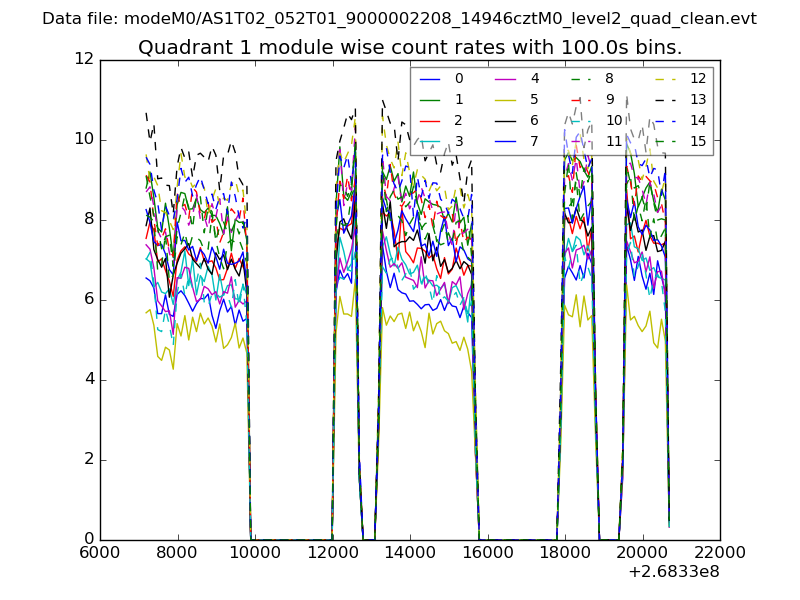
| Module-wise count rates for Quadrant A Data is divided into 100 sec bins |
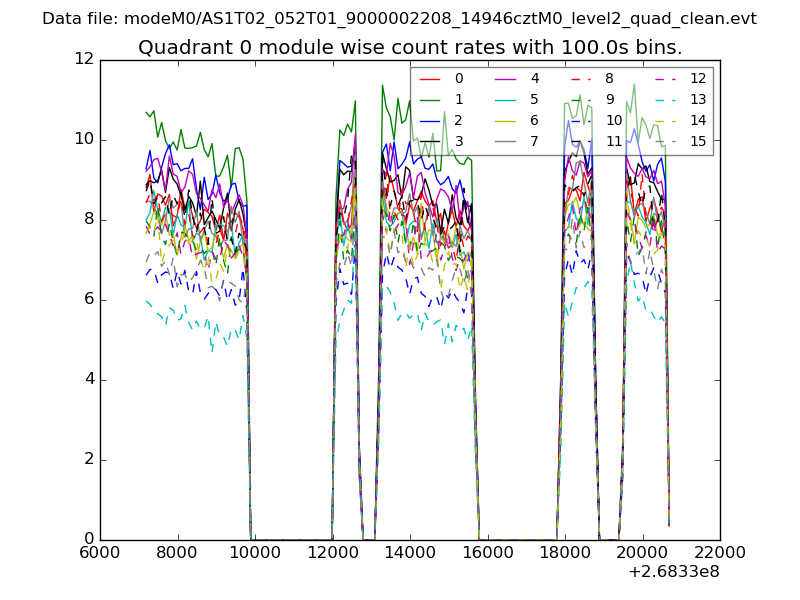 |
 |
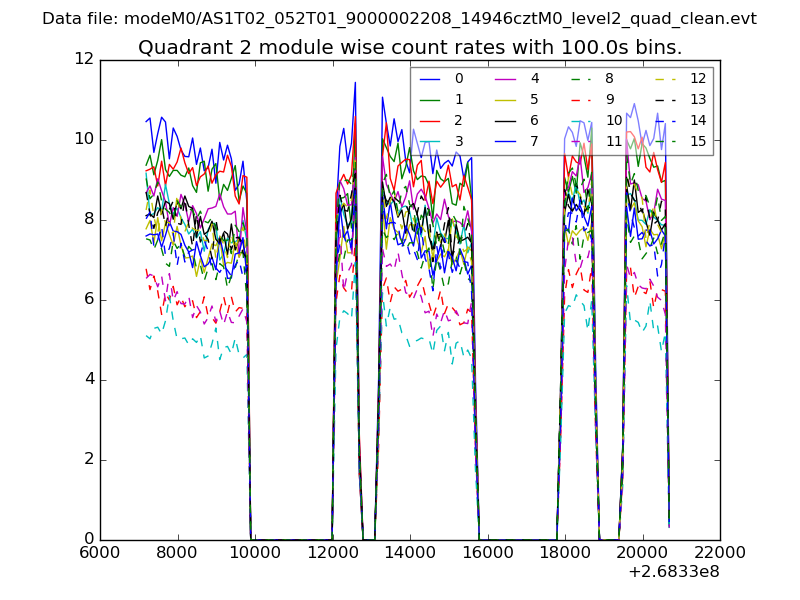
| Module-wise count rates for Quadrant B Data is divided into 100 sec bins |
 |
 |
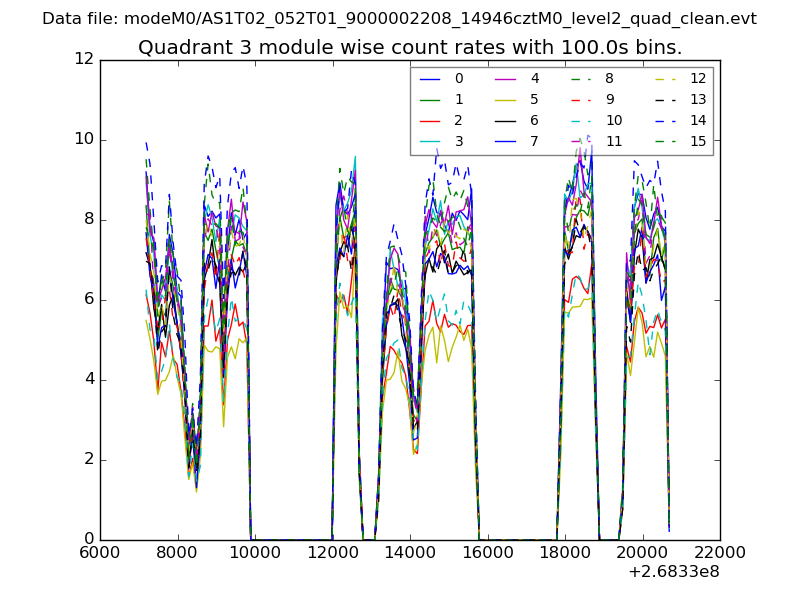
| Module-wise count rates for Quadrant C Data is divided into 100 sec bins |
 |
 |
| Module-wise count rates for Quadrant D Data is divided into 100 sec bins |
 |
 |
| Parameter | Plot |
|---|---|
| CZT HV Monitor | 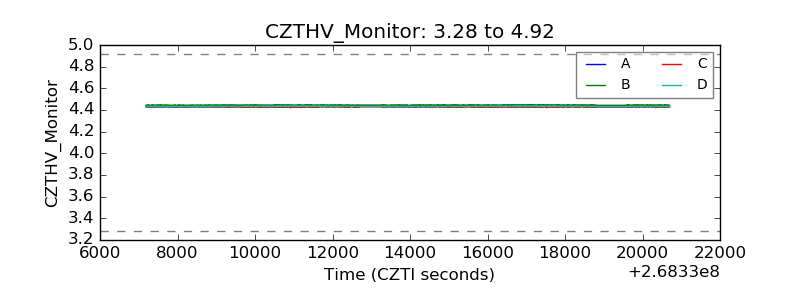 |
| D_VDD | 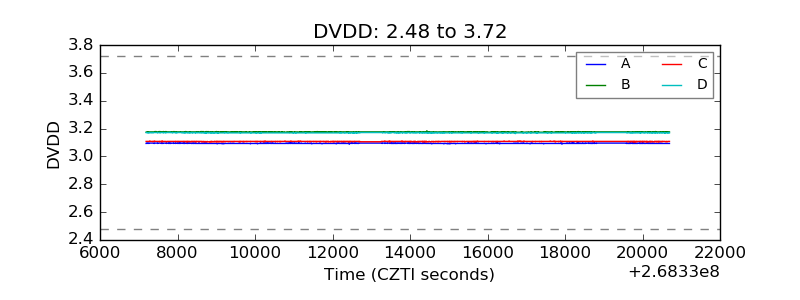 |
| Temperature 1 |  |
| Veto HV Monitor | 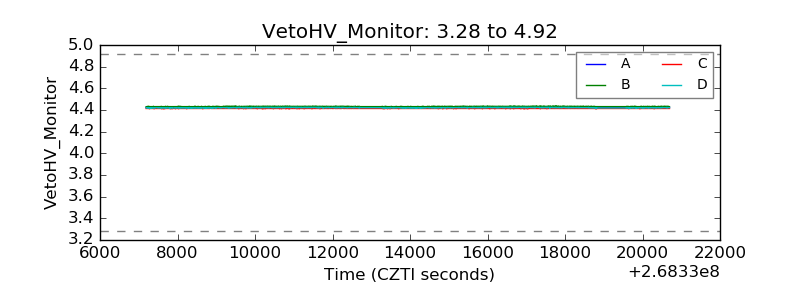 |
| Veto LLD | 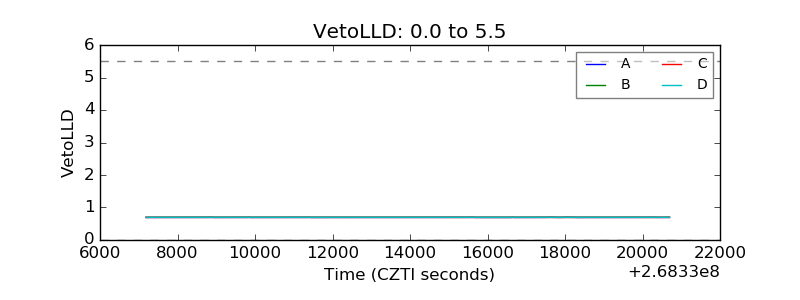 |
| Alpha Counter | 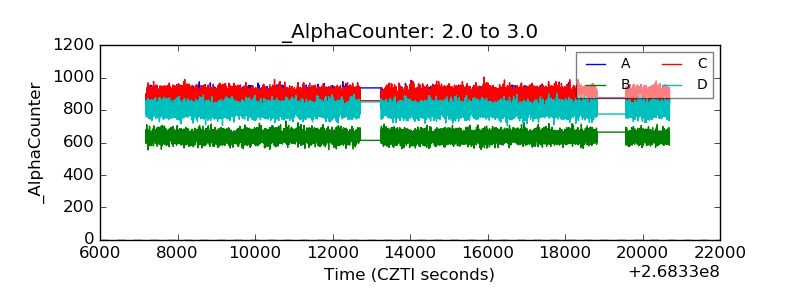 |
| _CPM_Rate | 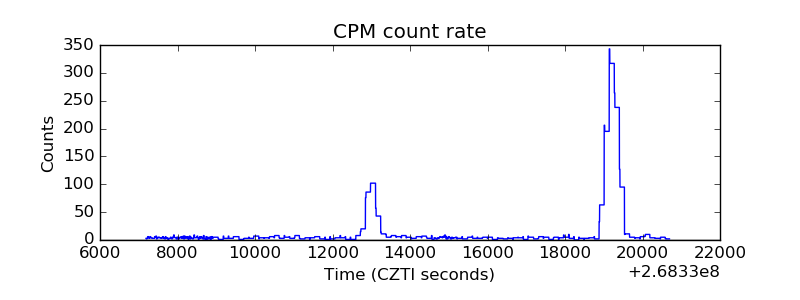 |
| CZT Counter | 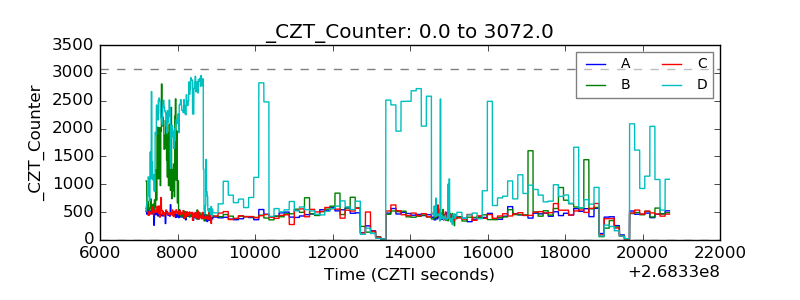 |
| +2.5 Volts monitor |  |
| +5 Volts monitor |  |
| _ROLL_ROT | 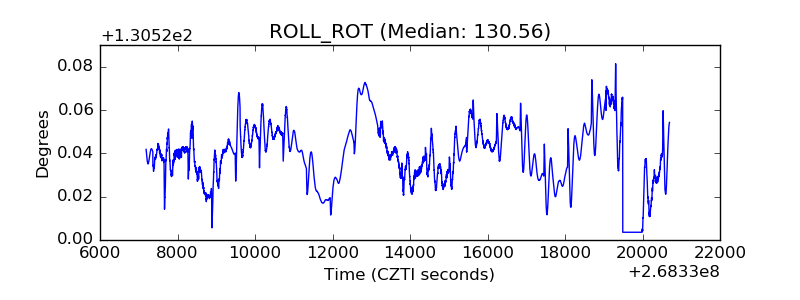 |
| _Roll_DEC |  |
| _Roll_RA | 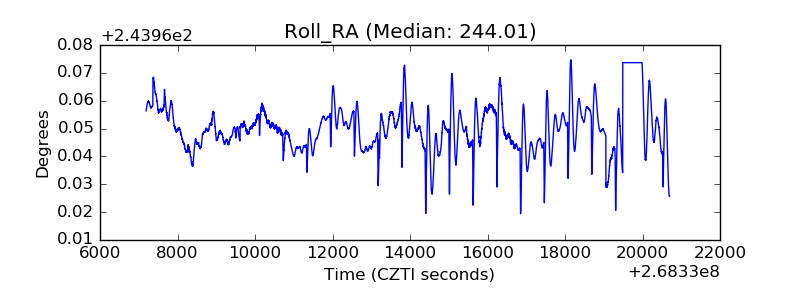 |
| Veto Counter | 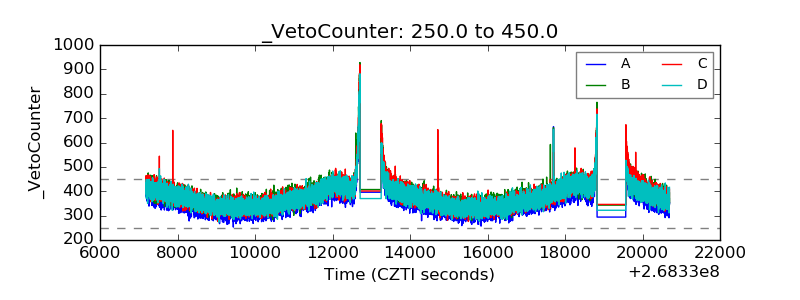 |