| Param | Original file | Final file |
|---|---|---|
| Filename | modeM0/AS1T02_056T01_9000002210cztM0_level2.fits | modeM0/AS1T02_056T01_9000002210cztM0_level2_quad_clean.evt |
| Size (bytes) | 3,156,837,120 | 3,140,012,160 |
| Size | 2.9 GB | 2.9 GB |
| Events in quadrant A | 19,661,294 | 19,533,343 |
| Events in quadrant B | 18,656,780 | 19,119,562 |
| Events in quadrant C | 19,036,368 | 18,252,300 |
| Events in quadrant D | 15,686,848 | 15,649,678 |
| Mode M0 | |||
|---|---|---|---|
| Quadrant | BADHDUFLAG | Total packets | Discarded packets |
| A | 0 | 728098 | 0 |
| B | 0 | 768047 | 0 |
| C | 0 | 687804 | 0 |
| D | 0 | 1057939 | 0 |
| Mode M9 | |||
|---|---|---|---|
| Quadrant | BADHDUFLAG | Total packets | Discarded packets |
| A | 0 | 549 | 0 |
| B | 0 | 549 | 0 |
| C | 0 | 549 | 0 |
| D | 0 | 549 | 0 |
| Mode SS | |||
|---|---|---|---|
| Quadrant | BADHDUFLAG | Total packets | Discarded packets |
| A | 0 | 6718 | 0 |
| B | 0 | 6718 | 0 |
| C | 0 | 6718 | 0 |
| D | 0 | 6718 | 0 |
| Quadrant | Total seconds | Saturated seconds | Saturation percentage |
|---|---|---|---|
| A | 329168 | 4694 | 1.426020% |
| B | 329168 | 10068 | 3.058621% |
| C | 329168 | 2509 | 0.762225% |
| D | 329144 | 41357 | 12.565017% |
Noise dominated data is calculated using 1-second bins in cleaned event files. If a bin has >2000 counts, and if more than 50% of those come from <1% of pixels, then it is considered to be noise-dominated and hence unusable.
| Quadrant | # 1 sec bins | Bins with >0 counts | Bins with >2000 counts | High rate bins dominated by noise | Noise dominated (total time) | Noise dominated (detector-on time) | Marked lightcurve |
|---|---|---|---|---|---|---|---|
| A | 384566 | 329140 | 0 | 0 | 0.00% | 0.00% | 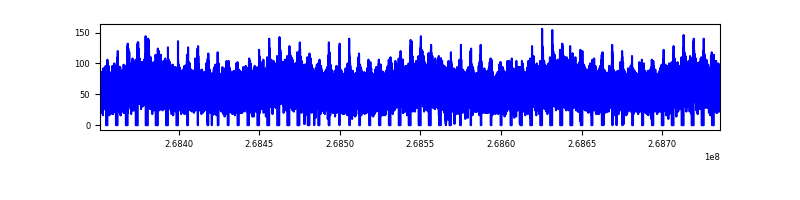 |
| B | 384566 | 328943 | 0 | 0 | 0.00% | 0.00% | 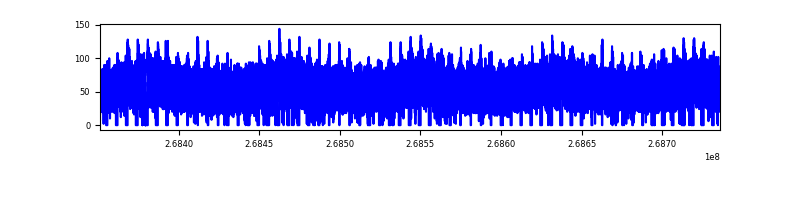 |
| C | 384566 | 329164 | 0 | 0 | 0.00% | 0.00% | 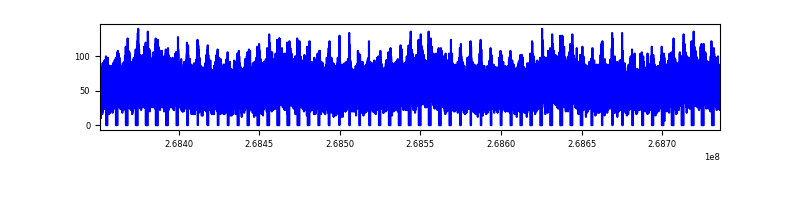 |
| D | 384566 | 328971 | 0 | 0 | 0.00% | 0.00% | 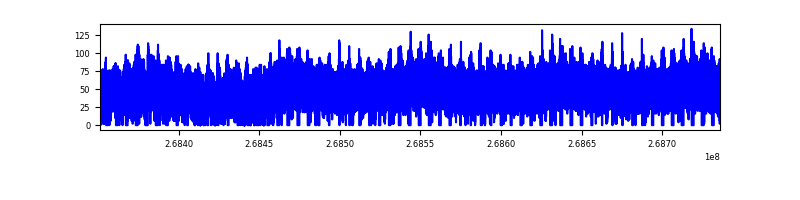 |
Top three noisy pixels from each quadrant. If the there are fewer than three noisy pixels in the level2.evt file, extra rows are filled as -1
| Pixel properties | Quadrant properties | ||||||
|---|---|---|---|---|---|---|---|
| Quadrant | DetID | PixID | Counts | Sigma | Mean | Median | Sigma |
| A | 0 | 29 | 18927 | 11.26 | 5127 | 4797 | 1255.2 |
| A | 7 | 110 | 15771 | 8.74 | 5127 | 4797 | 1255.2 |
| A | 9 | 19 | 14707 | 7.9 | 5127 | 4797 | 1255.2 |
| B | 2 | 9 | 16142 | 12.09 | 4934 | 4714 | 945.6 |
| B | 5 | 128 | 12223 | 7.94 | 4934 | 4714 | 945.6 |
| B | 14 | 254 | 12220 | 7.94 | 4934 | 4714 | 945.6 |
| C | 12 | 241 | 13353 | 6.72 | 5035 | 4682 | 1290.7 |
| C | 2 | 191 | 12821 | 6.31 | 5035 | 4682 | 1290.7 |
| C | 3 | 126 | 12735 | 6.24 | 5035 | 4682 | 1290.7 |
| D | 6 | 231 | 11525 | 6.21 | 4491 | 4083 | 1198.0 |
| D | 3 | 14 | 11403 | 6.11 | 4491 | 4083 | 1198.0 |
| D | 7 | 5 | 10774 | 5.58 | 4491 | 4083 | 1198.0 |
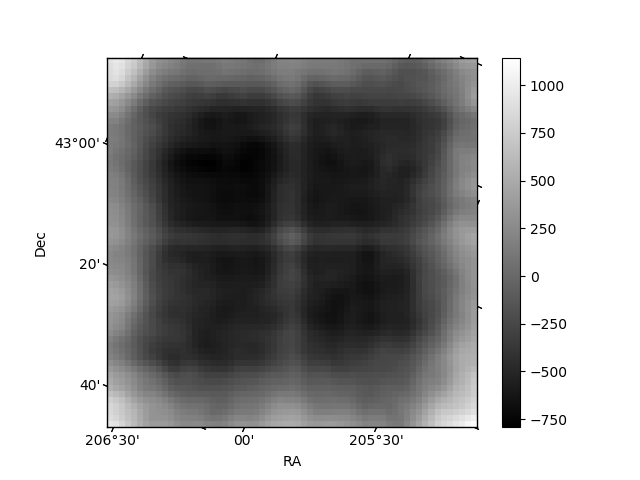
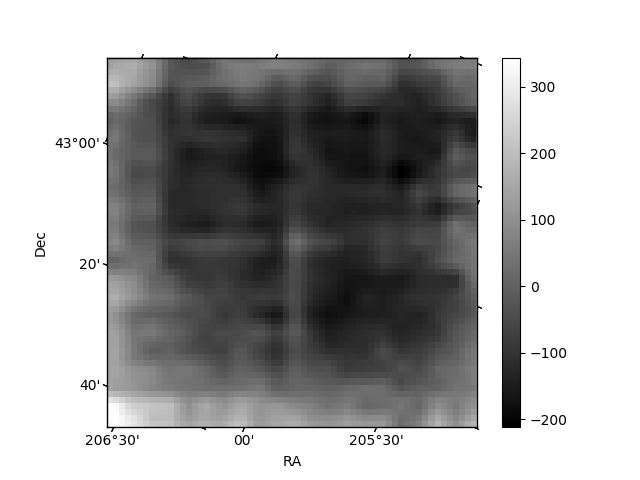
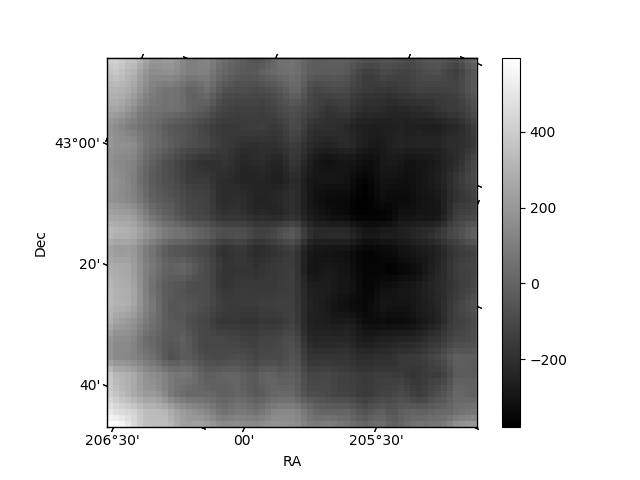
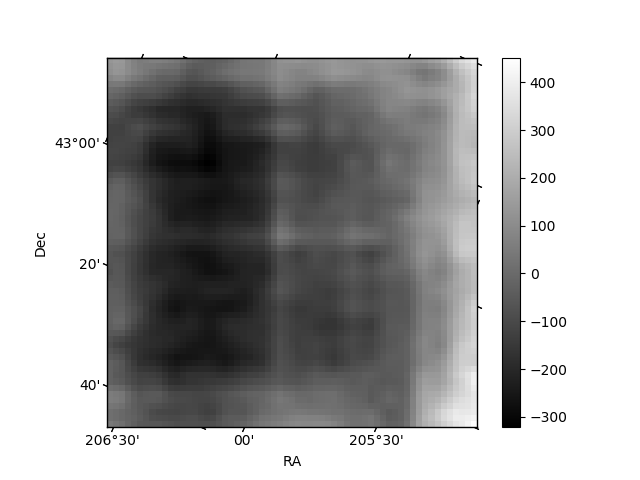
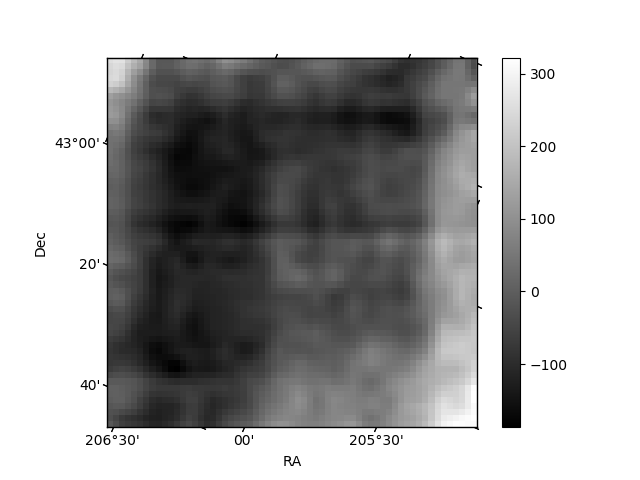
Histogram calculated using DETX and DETY for each event in the final _common_clean file
| Quadrant A | 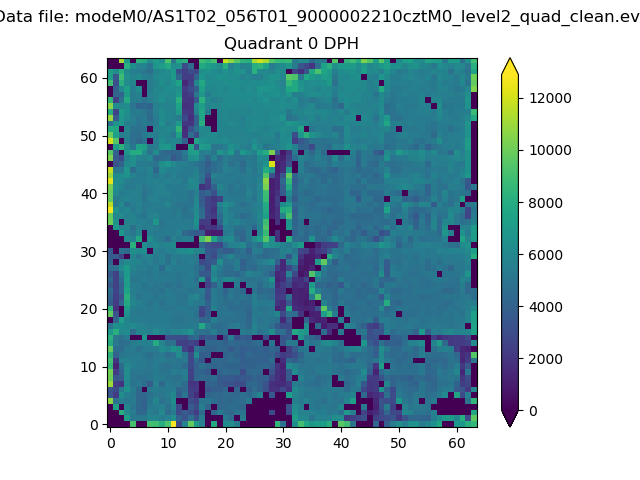 |
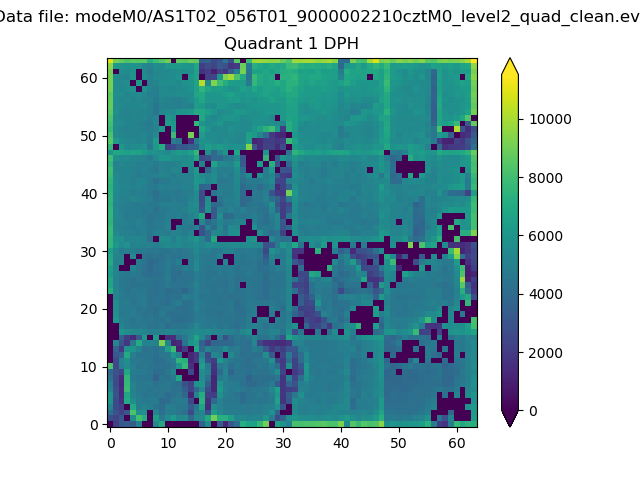 |
Quadrant B |
|---|---|---|---|
| Quadrant D | 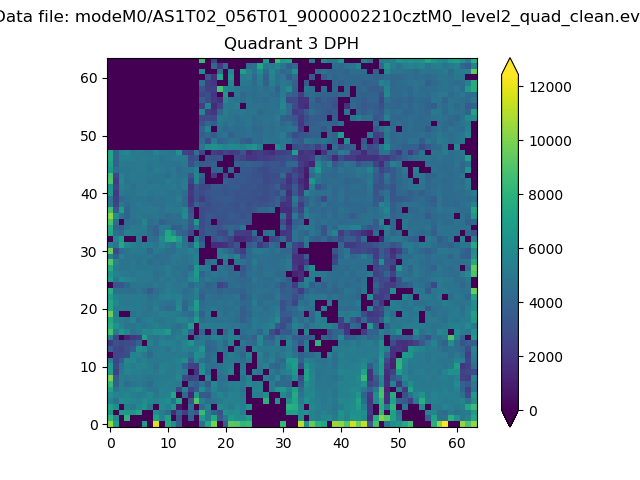 |
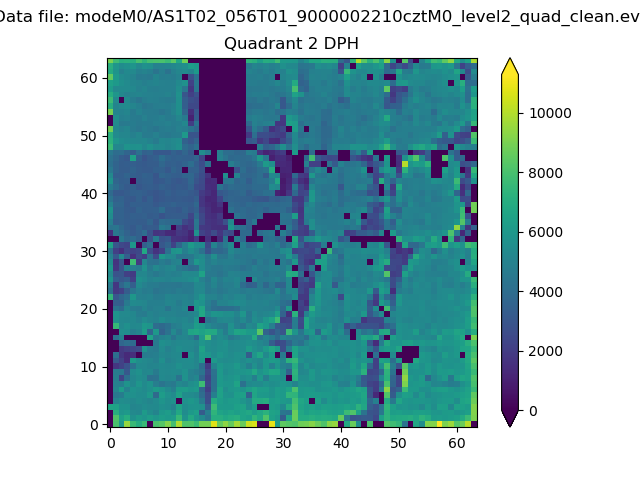 |
Quadrant C |
| Plot type | Count rate plots | Images |
|---|---|---|
| Comparison with Poisson distribution Blue bars denote a histogram of data divided into 1 sec bins. Red curve is a Poisson curve with rate = median count rate of data. |
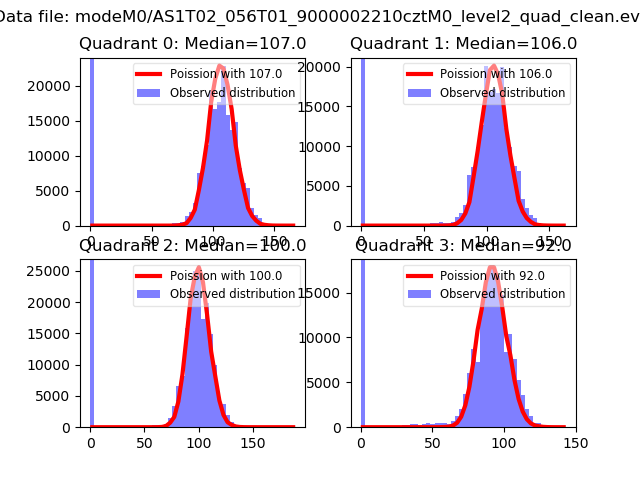 |
 |
| Quadrant-wise count rates Data is divided into 100 sec bins |
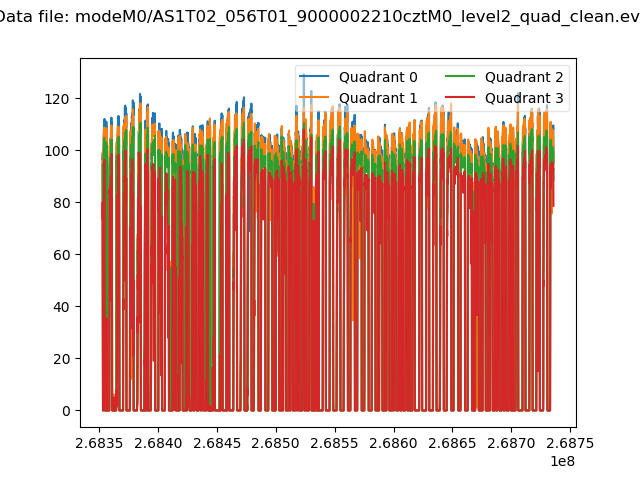 |
|
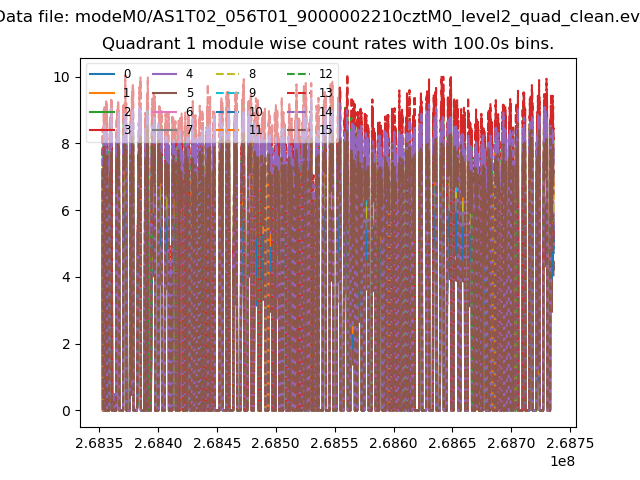
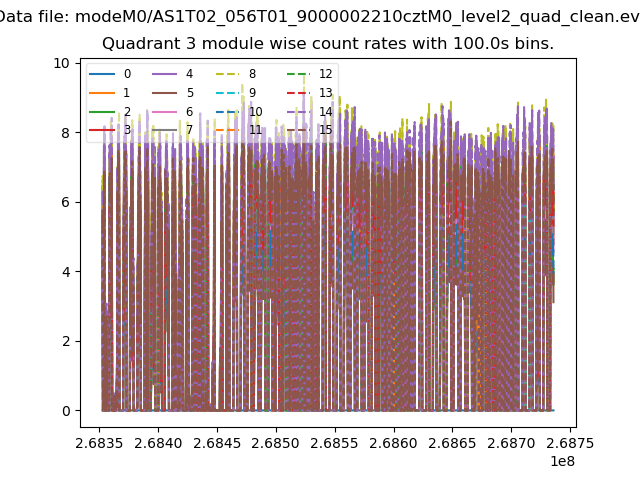
| Module-wise count rates for Quadrant A Data is divided into 100 sec bins |
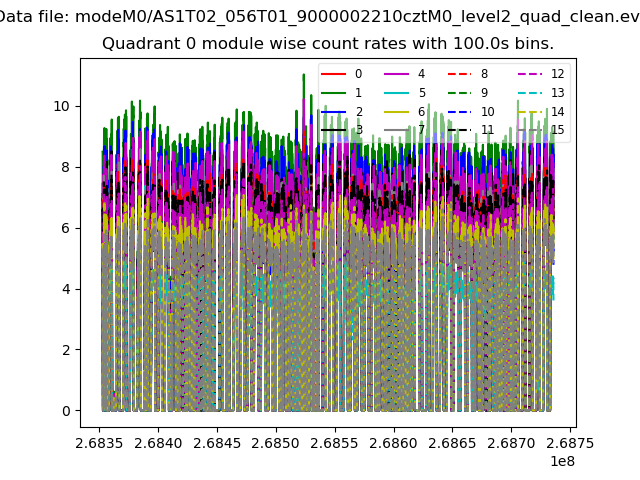 |
 |
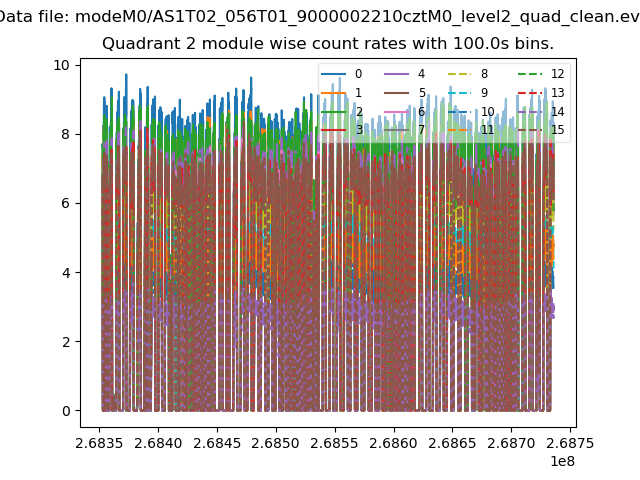
| Module-wise count rates for Quadrant B Data is divided into 100 sec bins |
 |
 |
| Module-wise count rates for Quadrant C Data is divided into 100 sec bins |
 |
 |
| Module-wise count rates for Quadrant D Data is divided into 100 sec bins |
 |
 |
| Parameter | Plot |
|---|---|
| CZT HV Monitor | 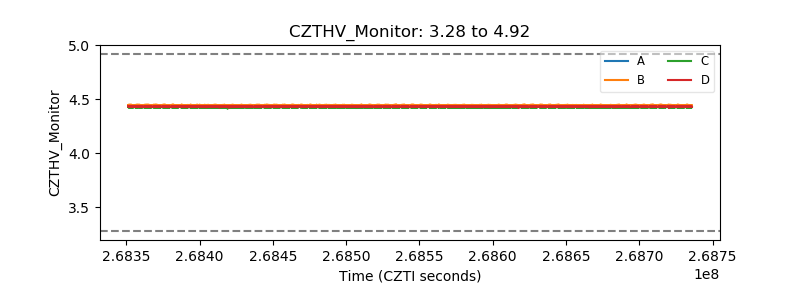 |
| D_VDD | 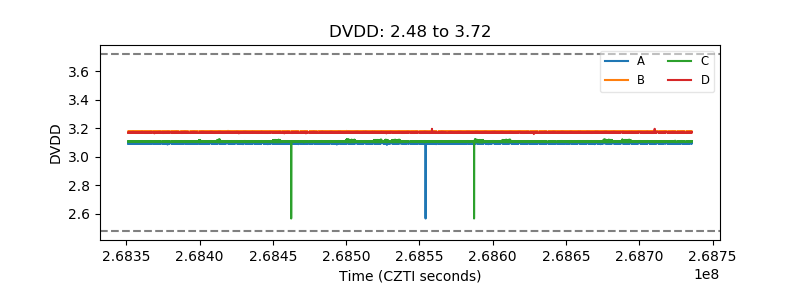 |
| Temperature 1 | 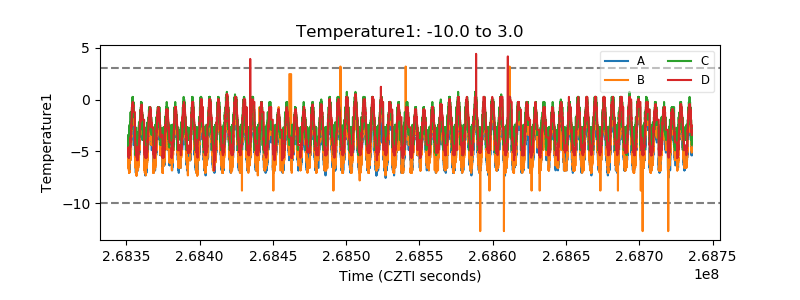 |
| Veto HV Monitor | 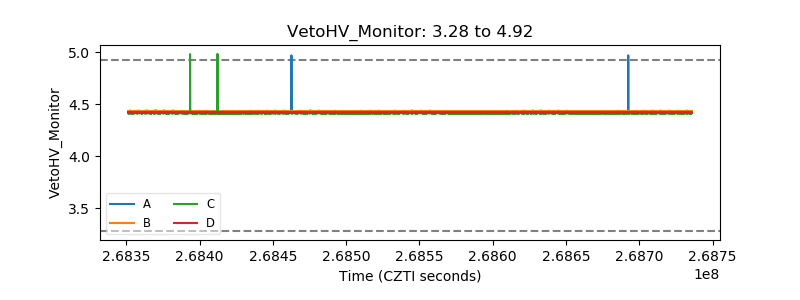 |
| Veto LLD | 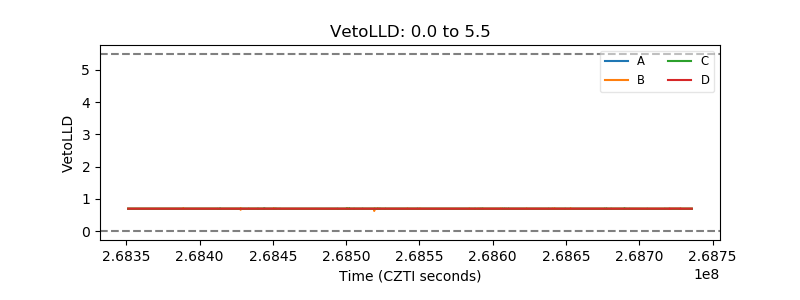 |
| Alpha Counter | 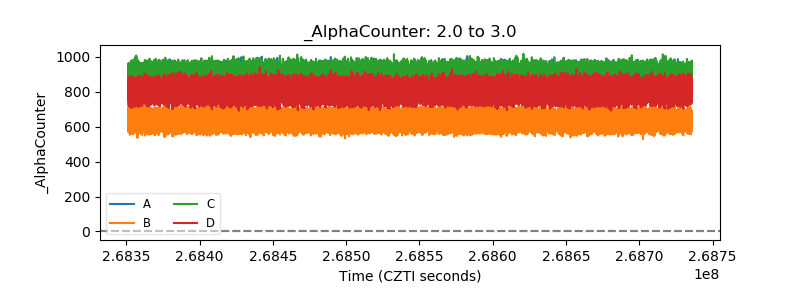 |
| _CPM_Rate | 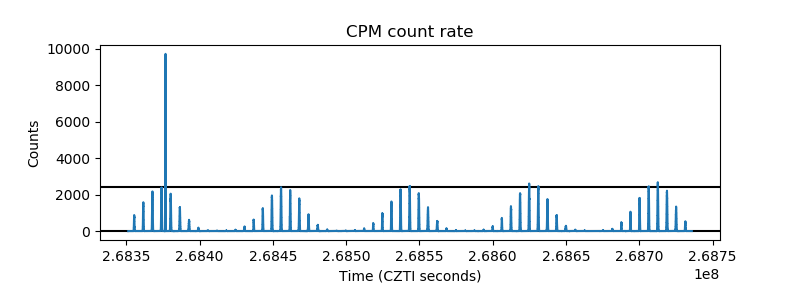 |
| CZT Counter | 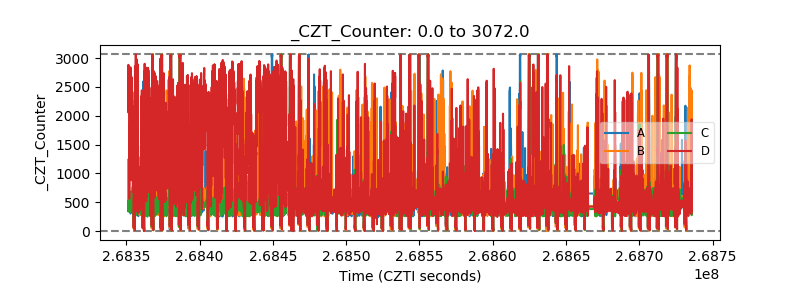 |
| +2.5 Volts monitor | 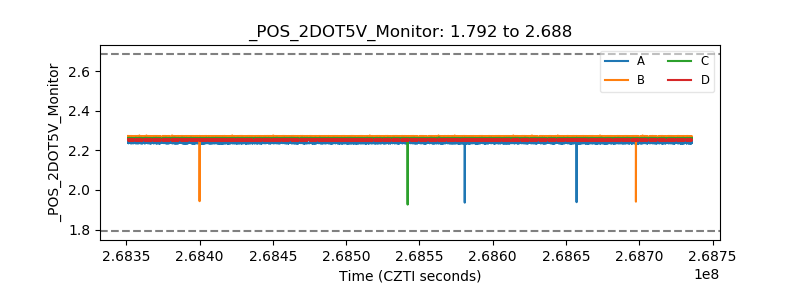 |
| +5 Volts monitor | 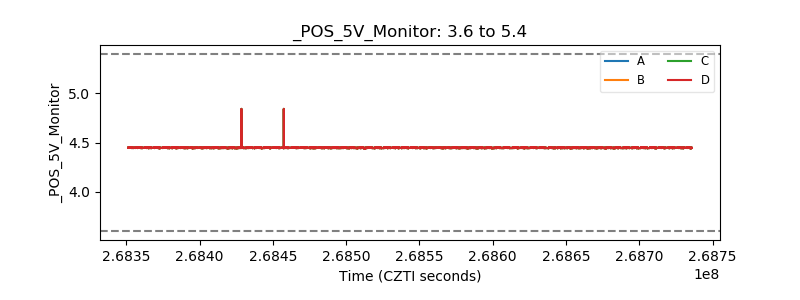 |
| _ROLL_ROT | 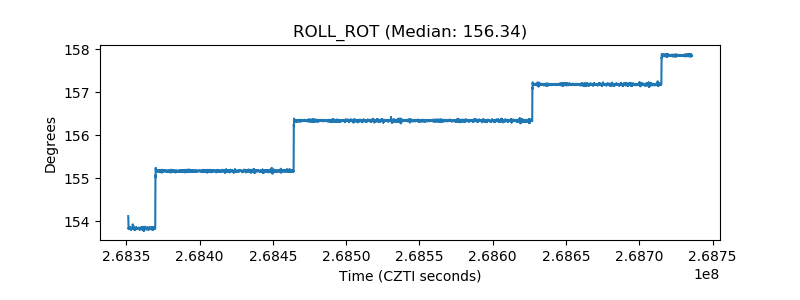 |
| _Roll_DEC | 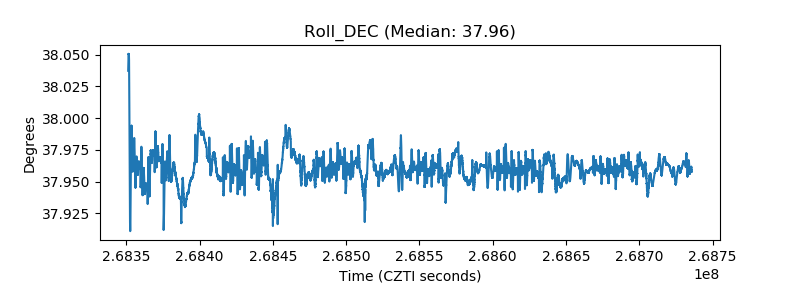 |
| _Roll_RA | 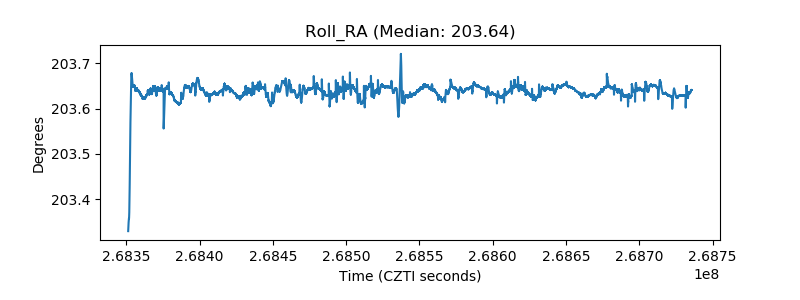 |
| Veto Counter | 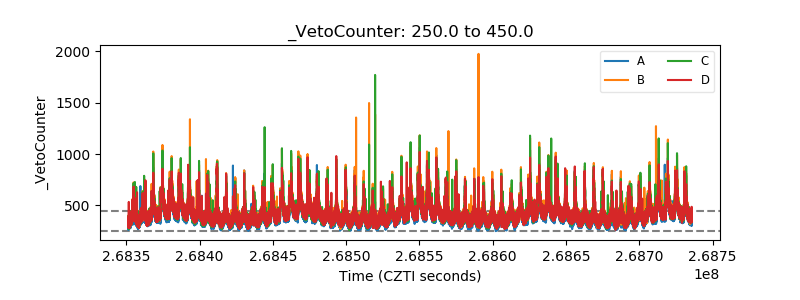 |