| Param | Original file | Final file |
|---|---|---|
| Filename | modeM0/AS1T02_056T01_9000002210_14946cztM0_level2.evt | modeM0/AS1T02_056T01_9000002210_14946cztM0_level2_quad_clean.evt |
| Size (bytes) | 579,222,720 | 56,764,800 |
| Size | 552.4 MB | 54.1 MB |
| Events in quadrant A | 2,409,679 | 371,331 |
| Events in quadrant B | 2,585,239 | 371,120 |
| Events in quadrant C | 2,492,873 | 365,488 |
| Events in quadrant D | 9,709,690 | 253,873 |
| Mode M0 | |||
|---|---|---|---|
| Quadrant | BADHDUFLAG | Total packets | Discarded packets |
| A | 0 | 10492 | 2 |
| B | 0 | 11019 | 1 |
| C | 0 | 10619 | 1 |
| D | 0 | 32327 | 1 |
| Mode M9 | |||
|---|---|---|---|
| Quadrant | BADHDUFLAG | Total packets | Discarded packets |
| A | 0 | 9 | 0 |
| B | 0 | 9 | 0 |
| C | 0 | 9 | 0 |
| D | 0 | 9 | 0 |
| Mode SS | |||
|---|---|---|---|
| Quadrant | BADHDUFLAG | Total packets | Discarded packets |
| A | 0 | 104 | 0 |
| B | 0 | 104 | 0 |
| C | 0 | 104 | 0 |
| D | 0 | 104 | 0 |
| Quadrant | Total seconds | Saturated seconds | Saturation percentage |
|---|---|---|---|
| A | 5078 | 27 | 0.531705% |
| B | 5078 | 49 | 0.964947% |
| C | 5078 | 39 | 0.768019% |
| D | 5078 | 2660 | 52.382828% |
Noise dominated data is calculated using 1-second bins in cleaned event files. If a bin has >2000 counts, and if more than 50% of those come from <1% of pixels, then it is considered to be noise-dominated and hence unusable.
| Quadrant | # 1 sec bins | Bins with >0 counts | Bins with >2000 counts | High rate bins dominated by noise | Noise dominated (total time) | Noise dominated (detector-on time) | Marked lightcurve |
|---|---|---|---|---|---|---|---|
| A | 5959 | 5080 | 1 | 1 | 0.02% | 0.02% | 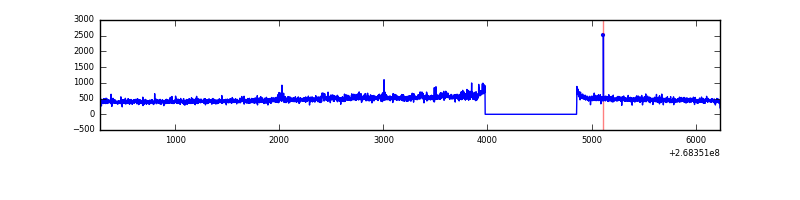 |
| B | 5959 | 5080 | 9 | 9 | 0.15% | 0.18% | 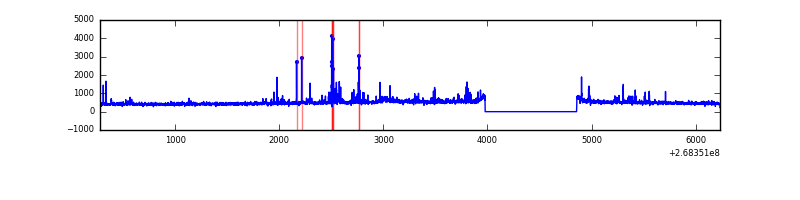 |
| C | 5959 | 5080 | 24 | 24 | 0.40% | 0.47% | 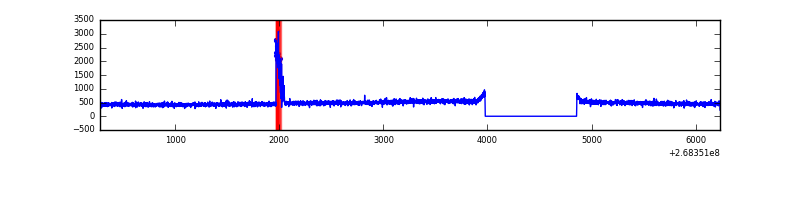 |
| D | 5959 | 5080 | 2474 | 2474 | 41.52% | 48.70% | 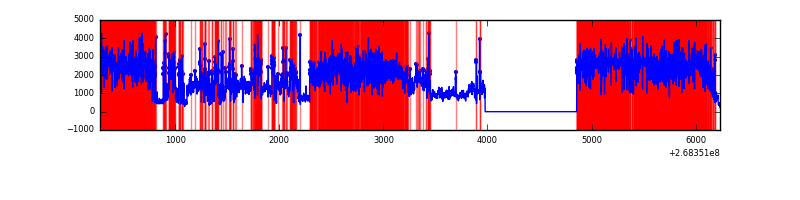 |
Top three noisy pixels from each quadrant. If the there are fewer than three noisy pixels in the level2.evt file, extra rows are filled as -1
| Pixel properties | Quadrant properties | ||||||
|---|---|---|---|---|---|---|---|
| Quadrant | DetID | PixID | Counts | Sigma | Mean | Median | Sigma |
| A | 12 | 189 | 71834 | 574.08 | 602 | 588 | 124.1 |
| A | 3 | 1 | 5828 | 42.22 | 602 | 588 | 124.1 |
| A | 9 | 143 | 5637 | 40.68 | 602 | 588 | 124.1 |
| B | 10 | 16 | 63811 | 544.19 | 599 | 584 | 116.2 |
| B | 0 | 189 | 51851 | 441.25 | 599 | 584 | 116.2 |
| B | 3 | 64 | 42447 | 360.31 | 599 | 584 | 116.2 |
| C | 3 | 233 | 132105 | 966.5 | 583 | 586 | 136.1 |
| C | 10 | 22 | 87430 | 638.19 | 583 | 586 | 136.1 |
| C | 13 | 61 | 4189 | 26.48 | 583 | 586 | 136.1 |
| D | 7 | 254 | 7778400 | 69756.24 | 464 | 452 | 111.5 |
| D | 7 | 223 | 45604 | 404.94 | 464 | 452 | 111.5 |
| D | 13 | 249 | 36757 | 325.6 | 464 | 452 | 111.5 |
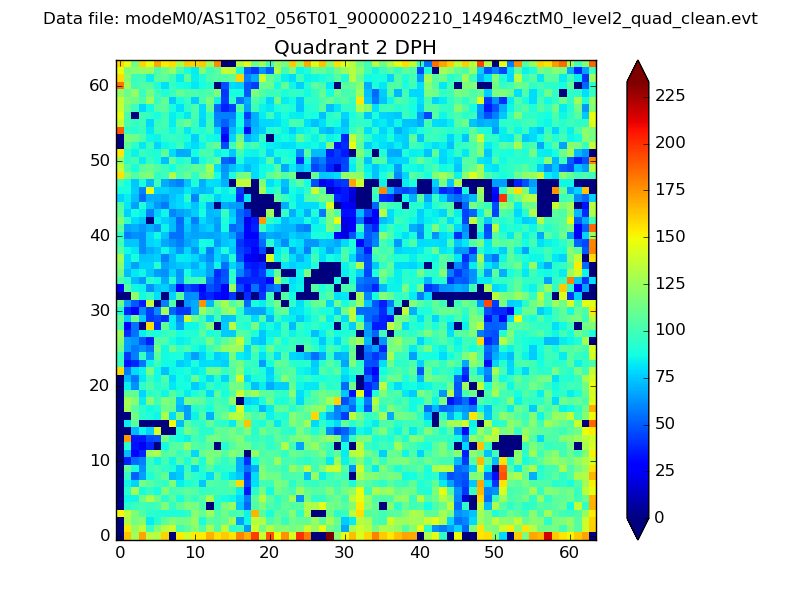
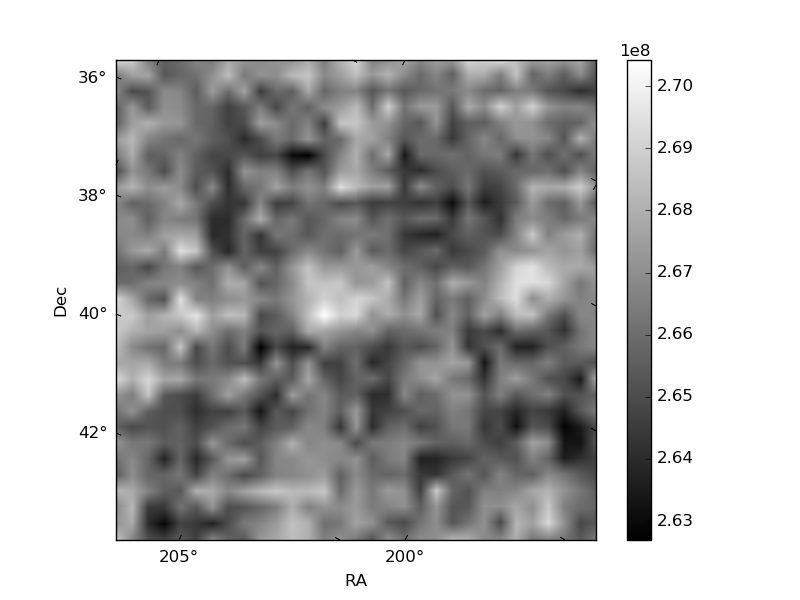
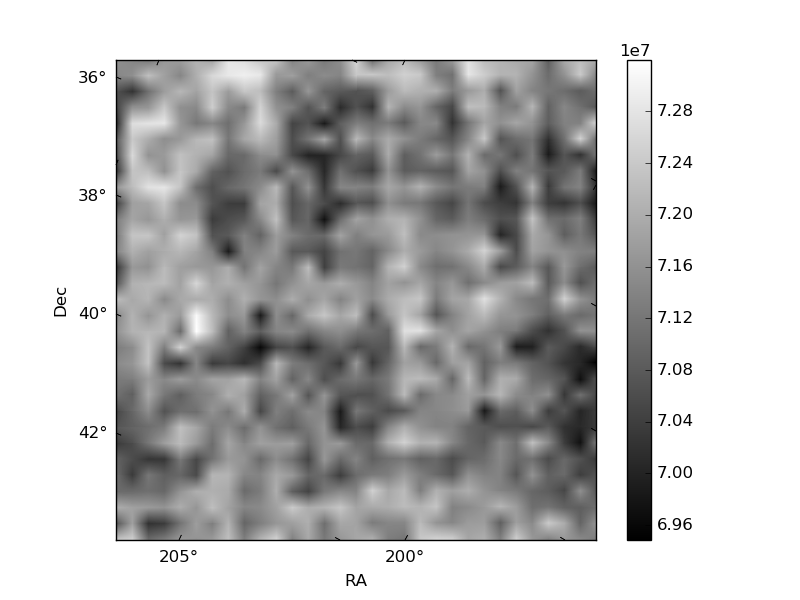
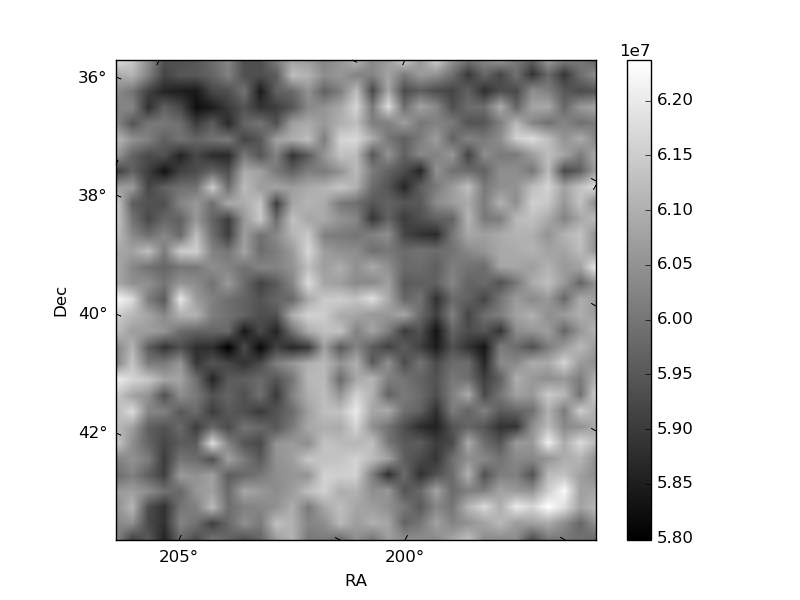
Histogram calculated using DETX and DETY for each event in the final _common_clean file
| Quadrant A | 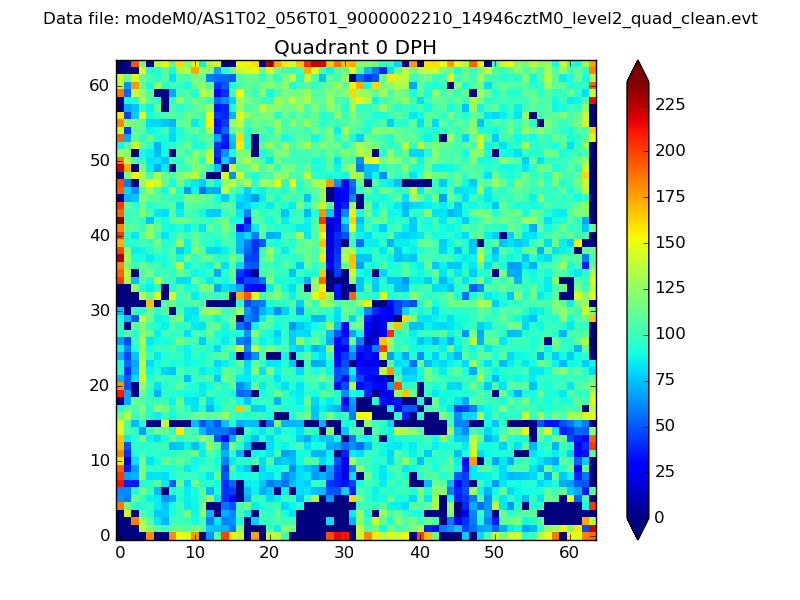 |
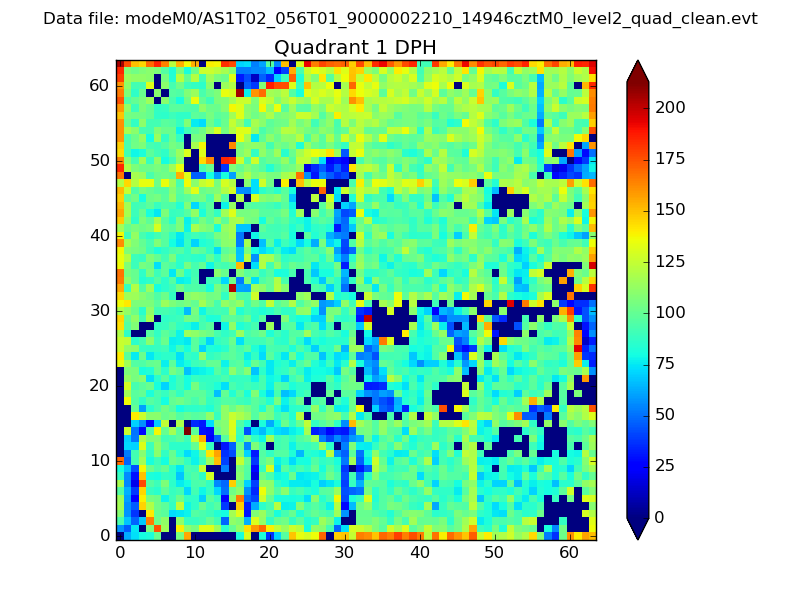 |
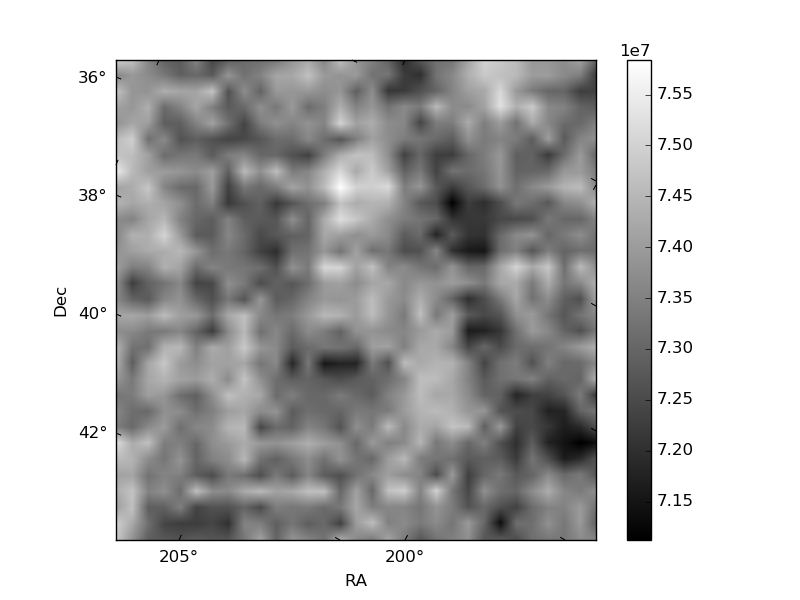
Quadrant B |
|---|---|---|---|
| Quadrant D | 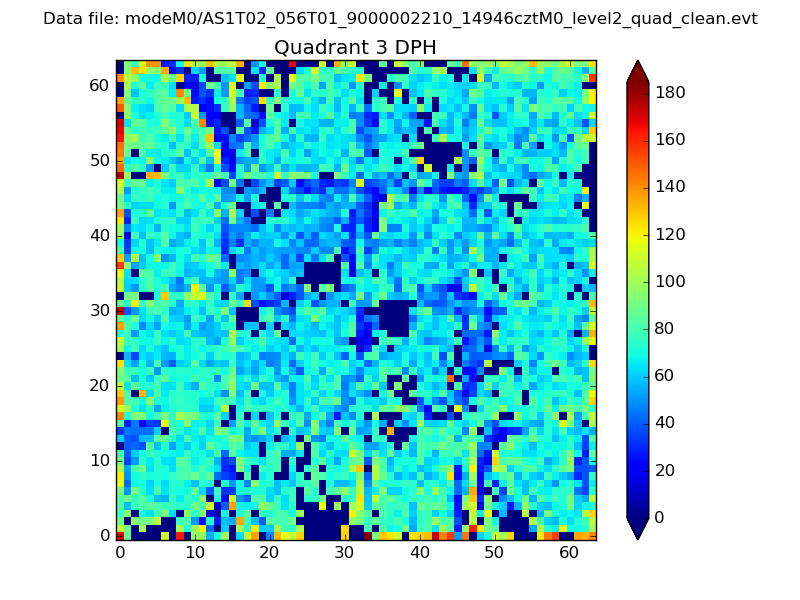 |
 |
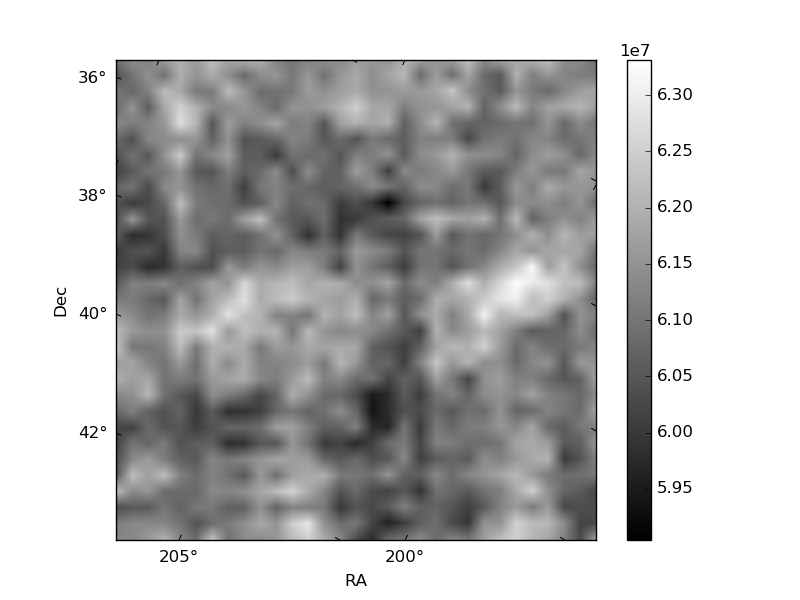
Quadrant C |
| Plot type | Count rate plots | Images |
|---|---|---|
| Comparison with Poisson distribution Blue bars denote a histogram of data divided into 1 sec bins. Red curve is a Poisson curve with rate = median count rate of data. |
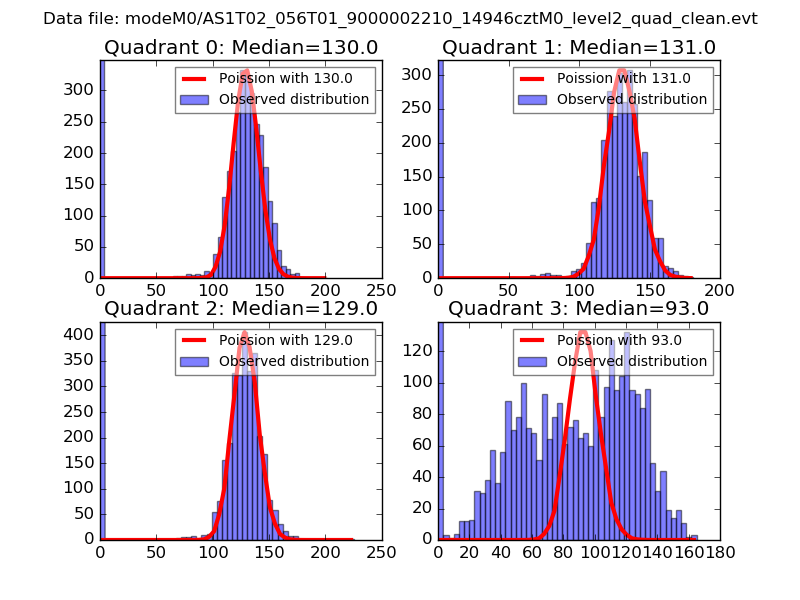 |
 |
| Quadrant-wise count rates Data is divided into 100 sec bins |
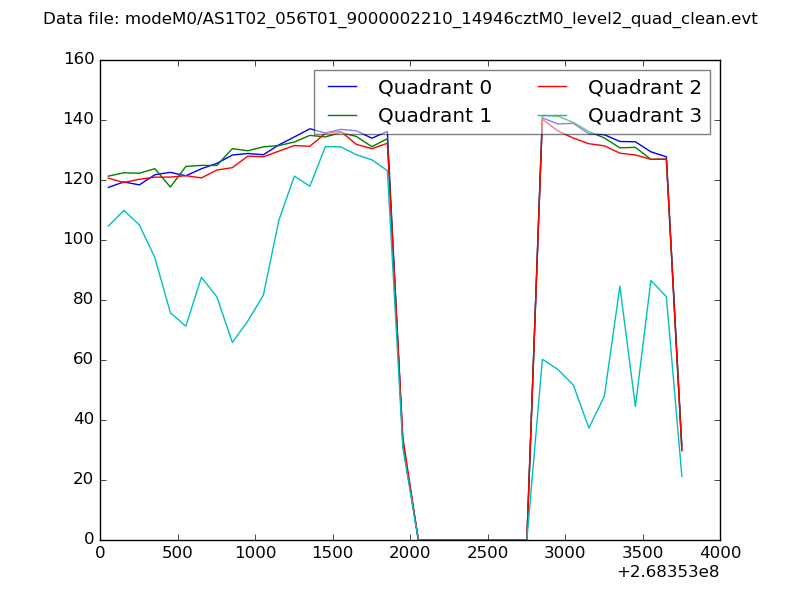 |
|
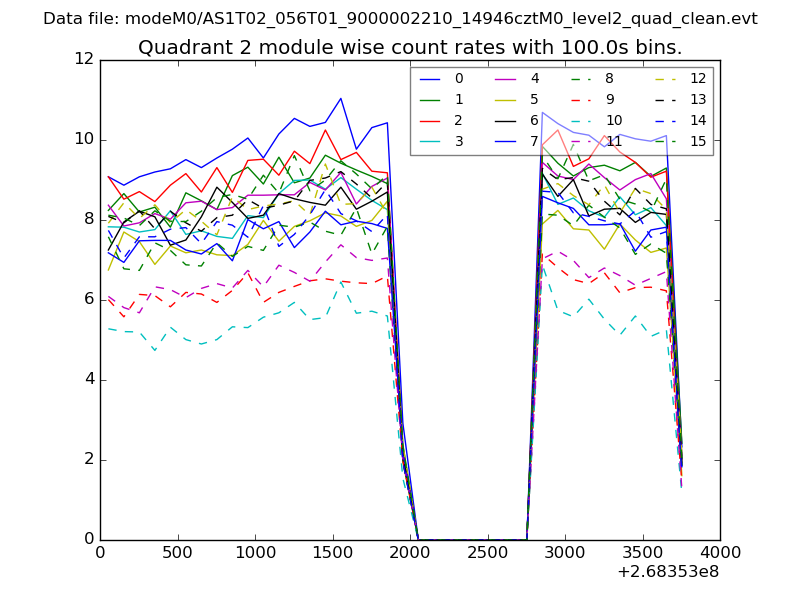
| Module-wise count rates for Quadrant A Data is divided into 100 sec bins |
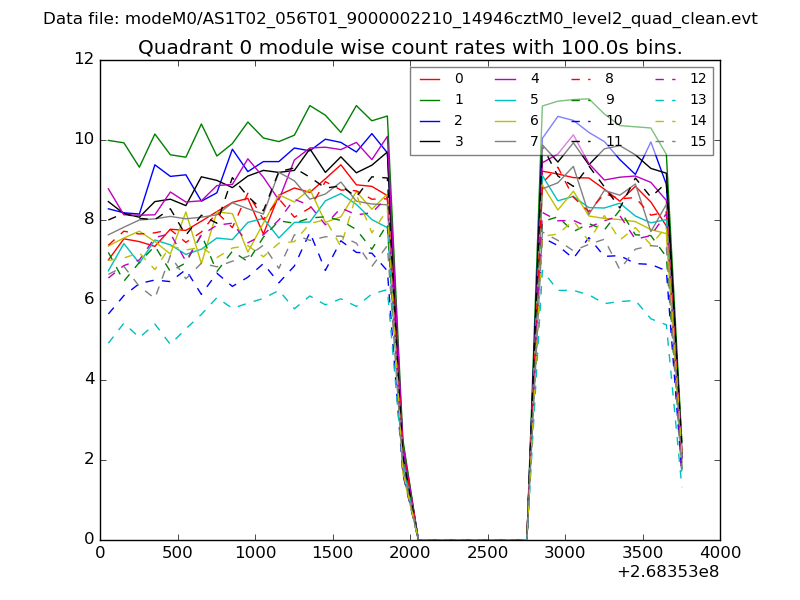 |
 |
| Module-wise count rates for Quadrant B Data is divided into 100 sec bins |
 |
 |
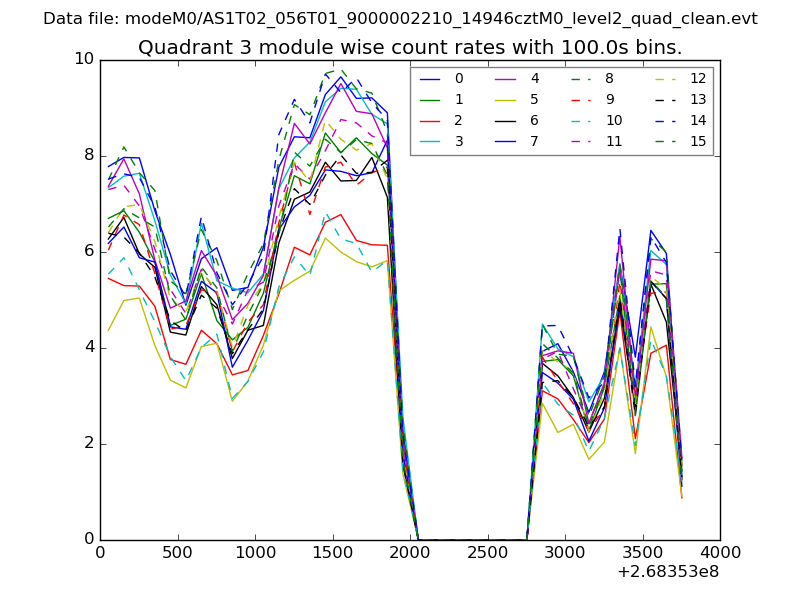
| Module-wise count rates for Quadrant C Data is divided into 100 sec bins |
 |
 |
| Module-wise count rates for Quadrant D Data is divided into 100 sec bins |
 |
 |
| Parameter | Plot |
|---|---|
| CZT HV Monitor | 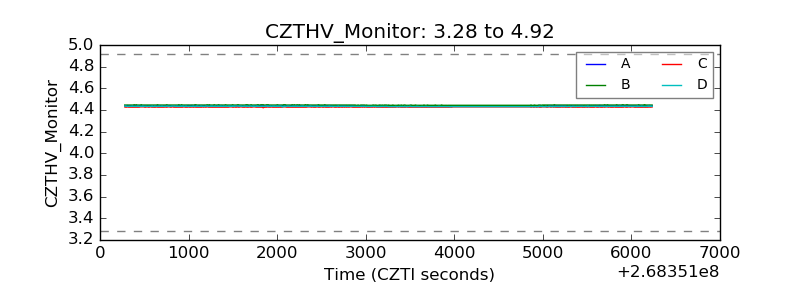 |
| D_VDD | 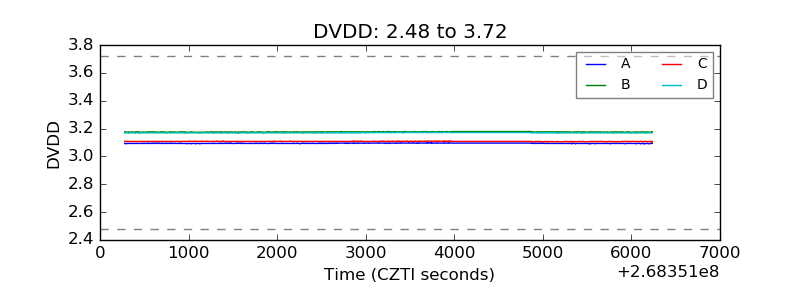 |
| Temperature 1 | 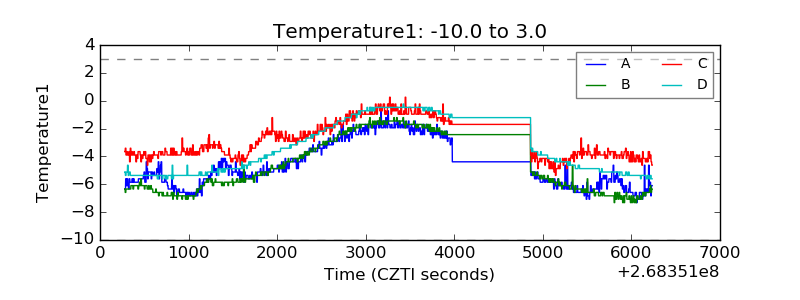 |
| Veto HV Monitor | 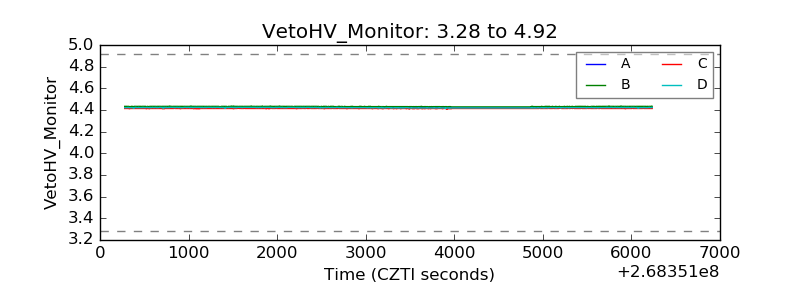 |
| Veto LLD |  |
| Alpha Counter | 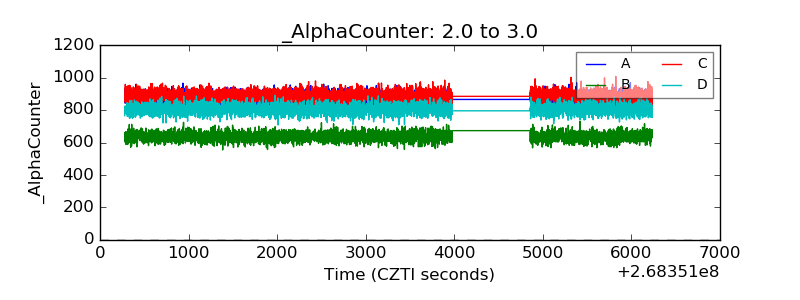 |
| _CPM_Rate | 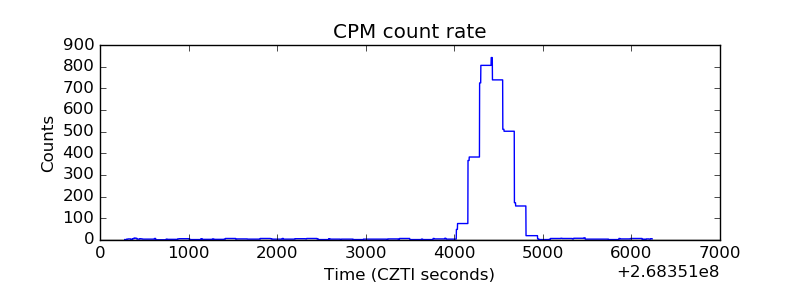 |
| CZT Counter | 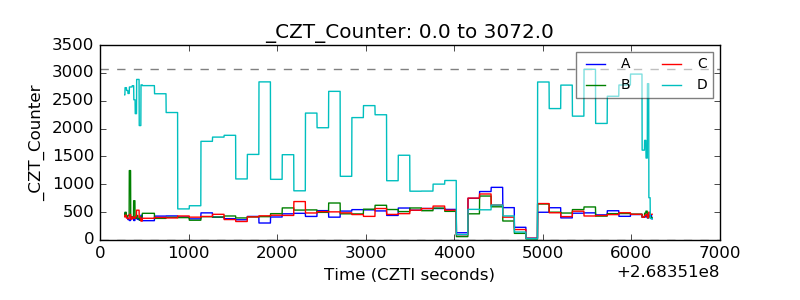 |
| +2.5 Volts monitor |  |
| +5 Volts monitor |  |
| _ROLL_ROT | 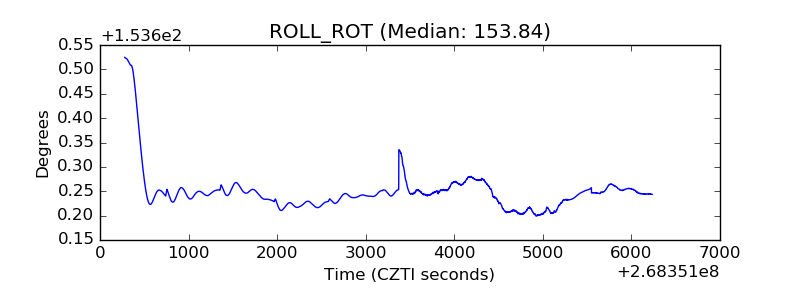 |
| _Roll_DEC | 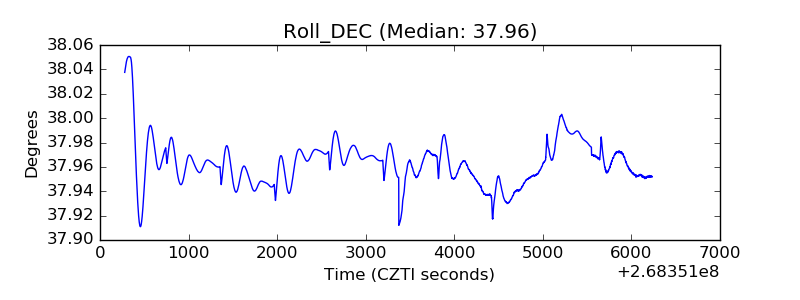 |
| _Roll_RA | 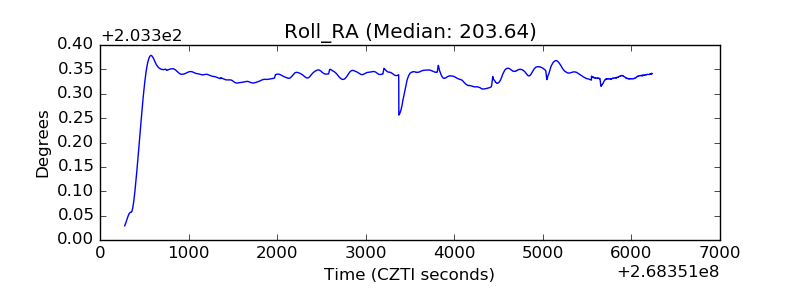 |
| Veto Counter | 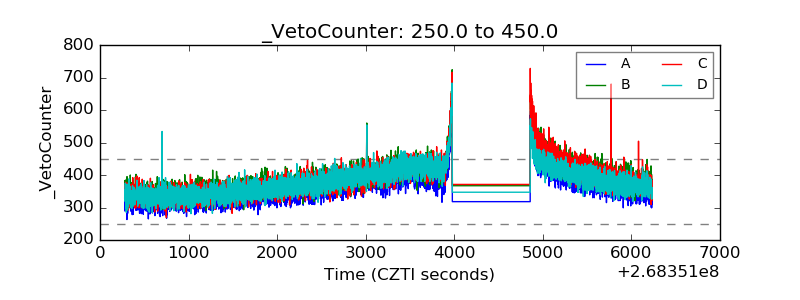 |