| Param | Original file | Final file |
|---|---|---|
| Filename | modeM0/AS1T02_056T01_9000002210_14947cztM0_level2.evt | modeM0/AS1T02_056T01_9000002210_14947cztM0_level2_quad_clean.evt |
| Size (bytes) | 661,867,200 | 74,658,240 |
| Size | 631.2 MB | 71.2 MB |
| Events in quadrant A | 3,151,032 | 483,716 |
| Events in quadrant B | 3,368,423 | 481,610 |
| Events in quadrant C | 3,147,318 | 471,417 |
| Events in quadrant D | 9,930,210 | 362,522 |
| Mode M0 | |||
|---|---|---|---|
| Quadrant | BADHDUFLAG | Total packets | Discarded packets |
| A | 0 | 13578 | 3 |
| B | 0 | 14138 | 2 |
| C | 0 | 13475 | 2 |
| D | 0 | 34196 | 2 |
| Mode M9 | |||
|---|---|---|---|
| Quadrant | BADHDUFLAG | Total packets | Discarded packets |
| A | 0 | 19 | 0 |
| B | 0 | 19 | 0 |
| C | 0 | 19 | 0 |
| D | 0 | 19 | 0 |
| Mode SS | |||
|---|---|---|---|
| Quadrant | BADHDUFLAG | Total packets | Discarded packets |
| A | 0 | 136 | 0 |
| B | 0 | 136 | 0 |
| C | 0 | 136 | 0 |
| D | 0 | 136 | 0 |
| Quadrant | Total seconds | Saturated seconds | Saturation percentage |
|---|---|---|---|
| A | 6607 | 32 | 0.484335% |
| B | 6607 | 54 | 0.817315% |
| C | 6607 | 21 | 0.317845% |
| D | 6607 | 2652 | 40.139246% |
Noise dominated data is calculated using 1-second bins in cleaned event files. If a bin has >2000 counts, and if more than 50% of those come from <1% of pixels, then it is considered to be noise-dominated and hence unusable.
| Quadrant | # 1 sec bins | Bins with >0 counts | Bins with >2000 counts | High rate bins dominated by noise | Noise dominated (total time) | Noise dominated (detector-on time) | Marked lightcurve |
|---|---|---|---|---|---|---|---|
| A | 8538 | 6610 | 1 | 1 | 0.01% | 0.02% | 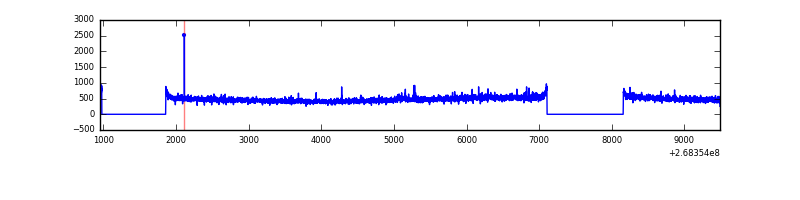 |
| B | 8538 | 6610 | 8 | 8 | 0.09% | 0.12% |  |
| C | 8538 | 6610 | 0 | 0 | 0.00% | 0.00% | 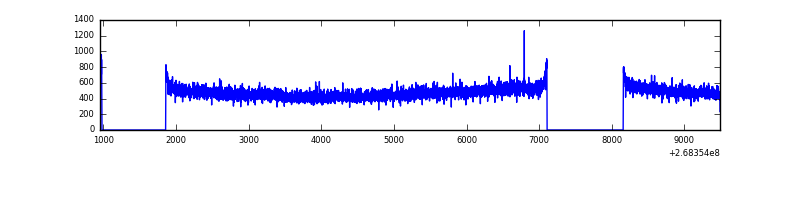 |
| D | 8538 | 6610 | 2520 | 2520 | 29.52% | 38.12% | 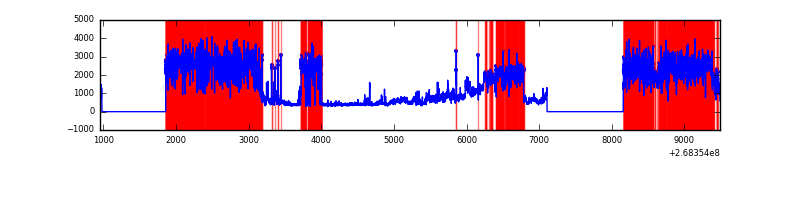 |
Top three noisy pixels from each quadrant. If the there are fewer than three noisy pixels in the level2.evt file, extra rows are filled as -1
| Pixel properties | Quadrant properties | ||||||
|---|---|---|---|---|---|---|---|
| Quadrant | DetID | PixID | Counts | Sigma | Mean | Median | Sigma |
| A | 12 | 189 | 48713 | 295.03 | 794 | 778 | 162.5 |
| A | 3 | 1 | 27406 | 163.89 | 794 | 778 | 162.5 |
| A | 1 | 162 | 9774 | 55.37 | 794 | 778 | 162.5 |
| B | 0 | 189 | 71416 | 462.53 | 794 | 774 | 152.7 |
| B | 10 | 16 | 65943 | 426.69 | 794 | 774 | 152.7 |
| B | 0 | 229 | 31974 | 204.28 | 794 | 774 | 152.7 |
| C | 3 | 233 | 147594 | 825.73 | 769 | 775 | 177.8 |
| C | 13 | 61 | 5494 | 26.54 | 769 | 775 | 177.8 |
| C | 8 | 222 | 2446 | 9.4 | 769 | 775 | 177.8 |
| D | 7 | 254 | 6684735 | 42703.48 | 653 | 636 | 156.5 |
| D | 7 | 223 | 661266 | 4220.64 | 653 | 636 | 156.5 |
| D | 13 | 249 | 49745 | 313.75 | 653 | 636 | 156.5 |
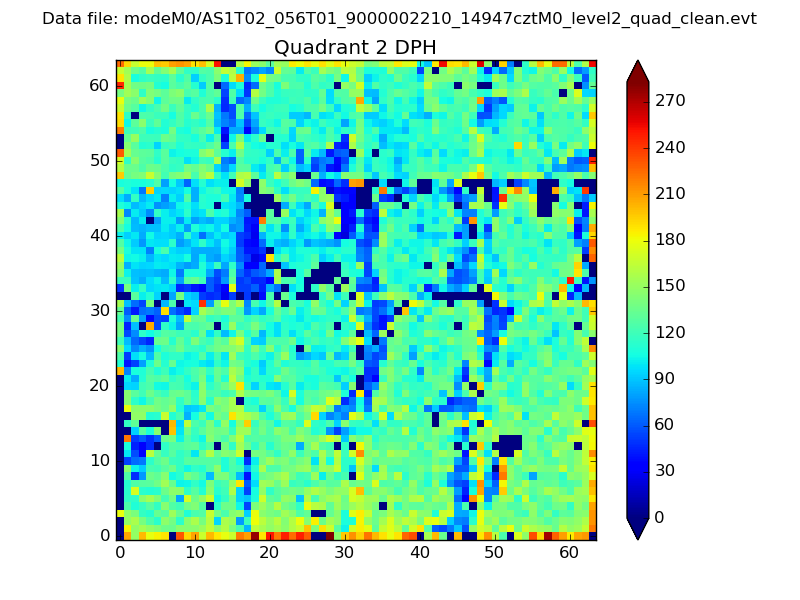
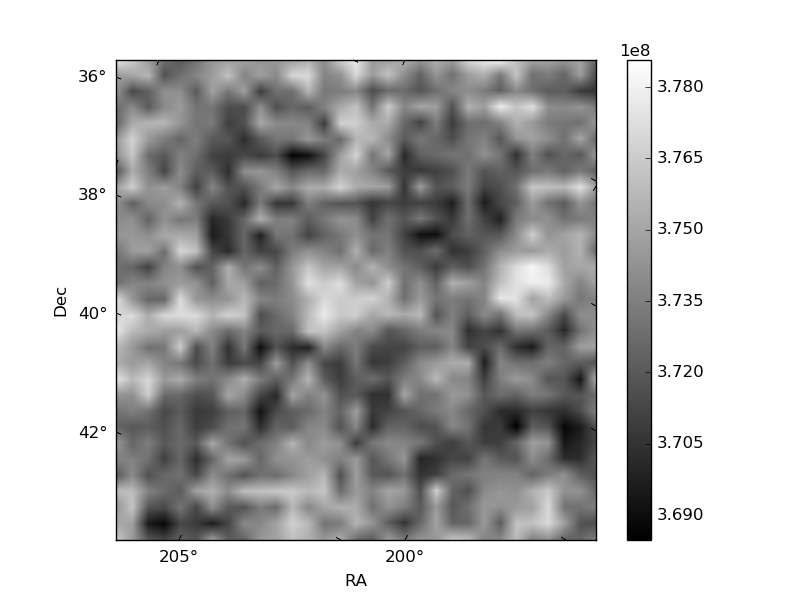
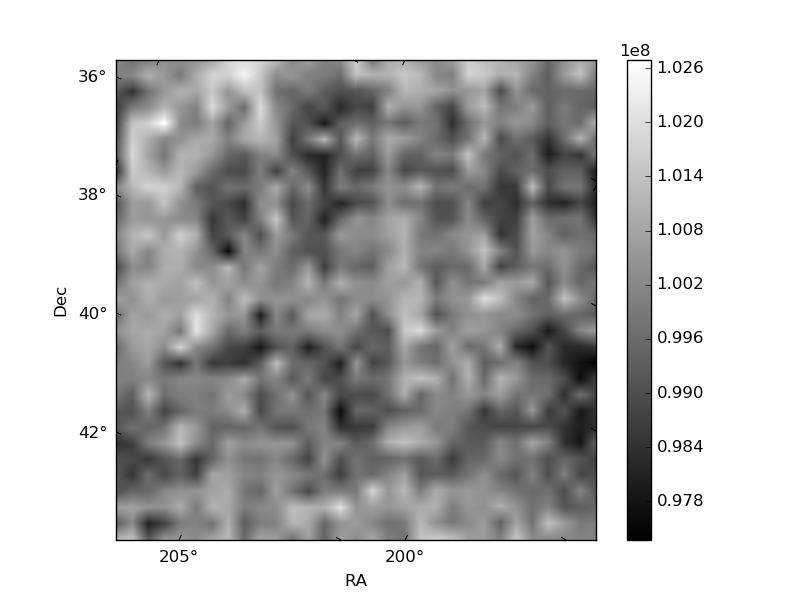
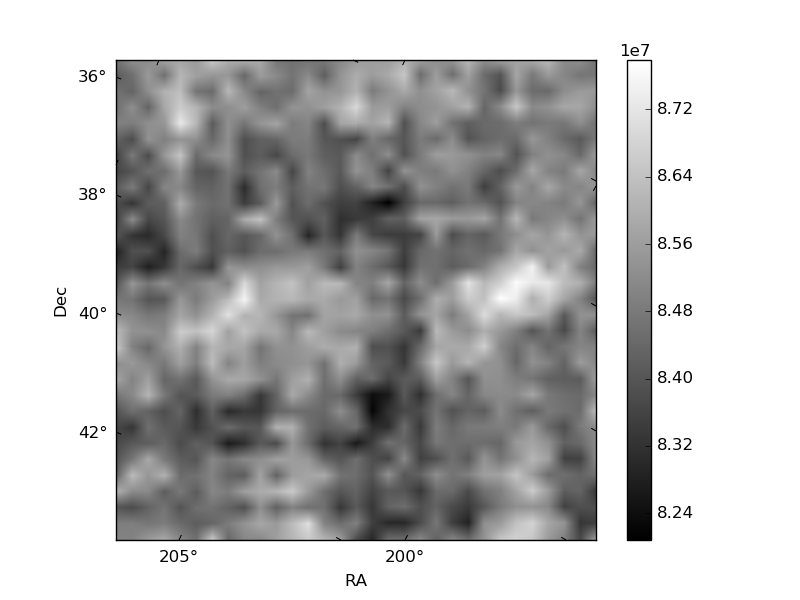
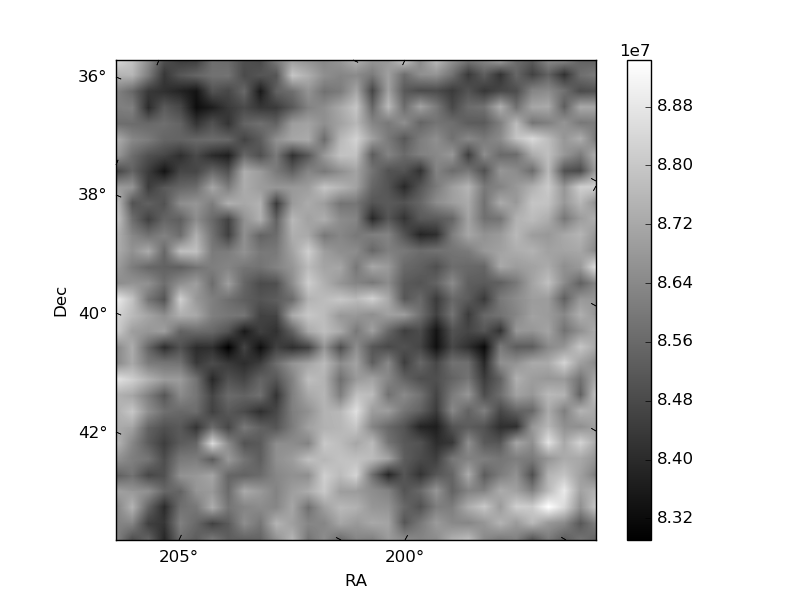
Histogram calculated using DETX and DETY for each event in the final _common_clean file
| Quadrant A |  |
 |
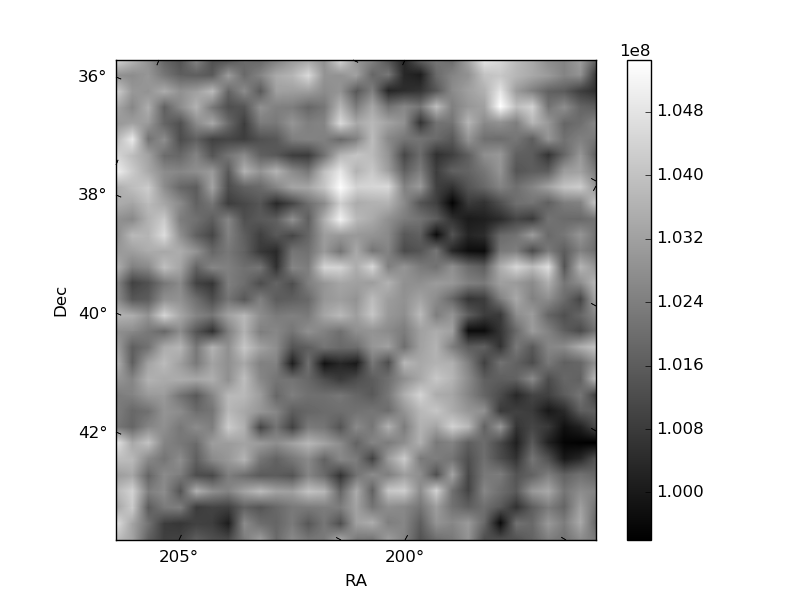
Quadrant B |
|---|---|---|---|
| Quadrant D |  |
 |
Quadrant C |
| Plot type | Count rate plots | Images |
|---|---|---|
| Comparison with Poisson distribution Blue bars denote a histogram of data divided into 1 sec bins. Red curve is a Poisson curve with rate = median count rate of data. |
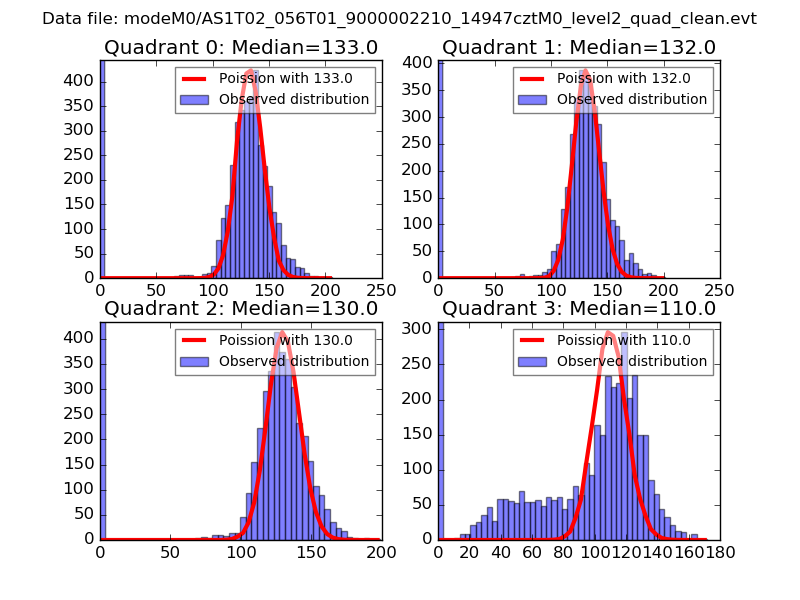 |
 |
| Quadrant-wise count rates Data is divided into 100 sec bins |
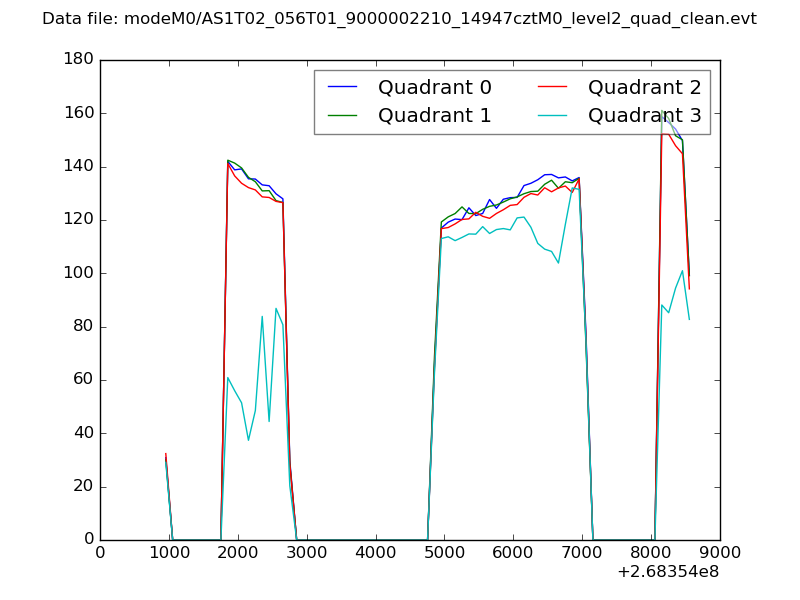 |
|
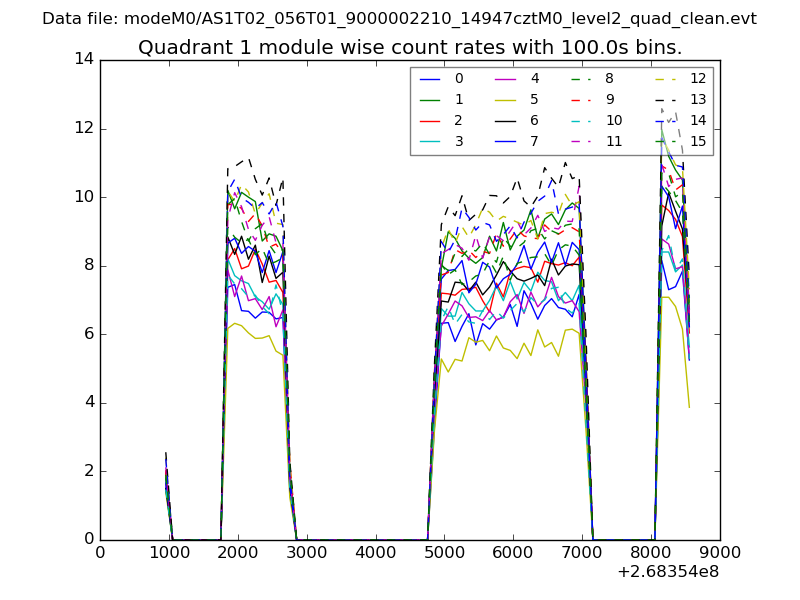
| Module-wise count rates for Quadrant A Data is divided into 100 sec bins |
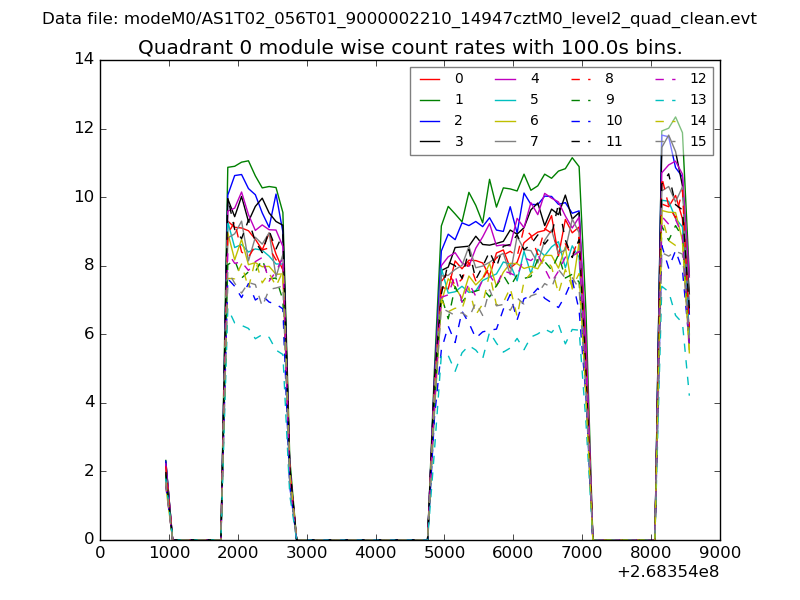 |
 |
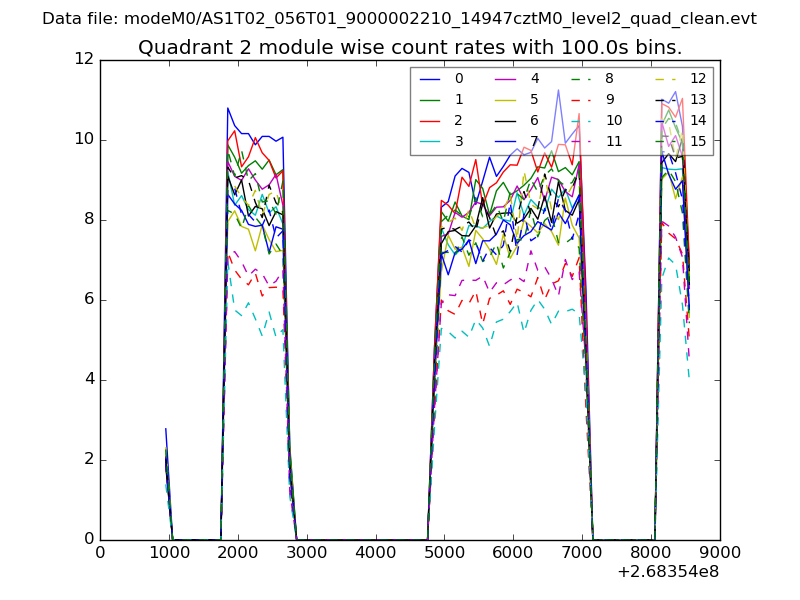
| Module-wise count rates for Quadrant B Data is divided into 100 sec bins |
 |
 |
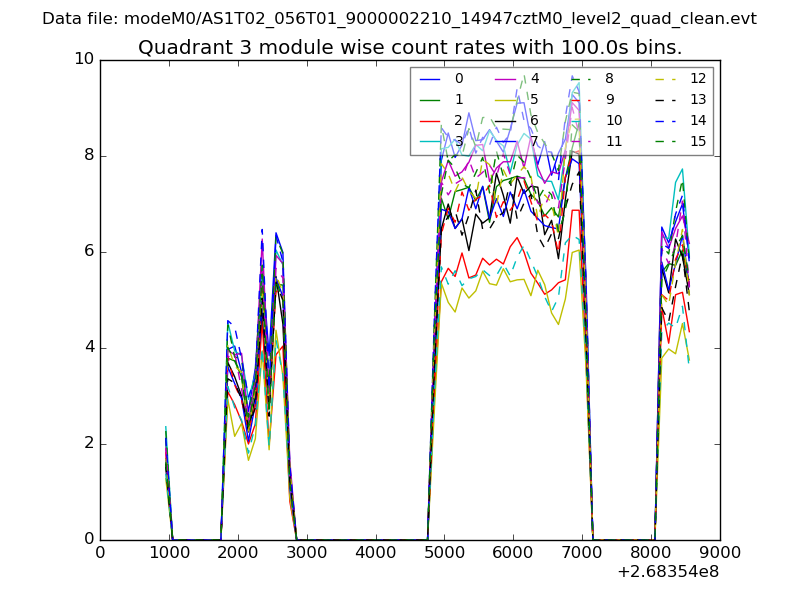
| Module-wise count rates for Quadrant C Data is divided into 100 sec bins |
 |
 |
| Module-wise count rates for Quadrant D Data is divided into 100 sec bins |
 |
 |
| Parameter | Plot |
|---|---|
| CZT HV Monitor | 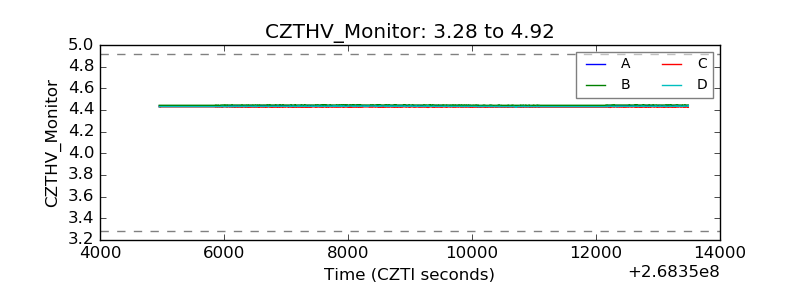 |
| D_VDD | 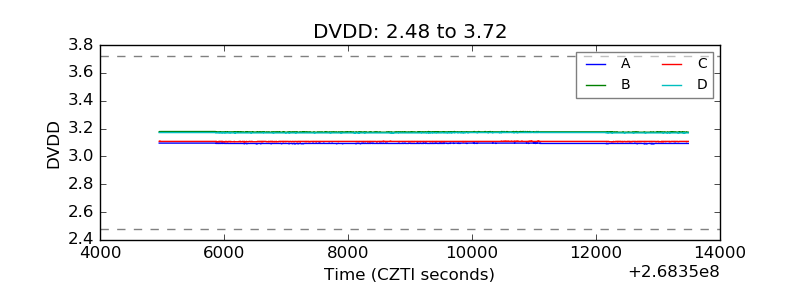 |
| Temperature 1 | 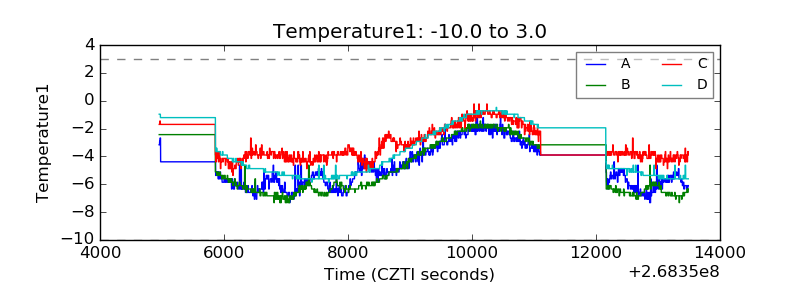 |
| Veto HV Monitor | 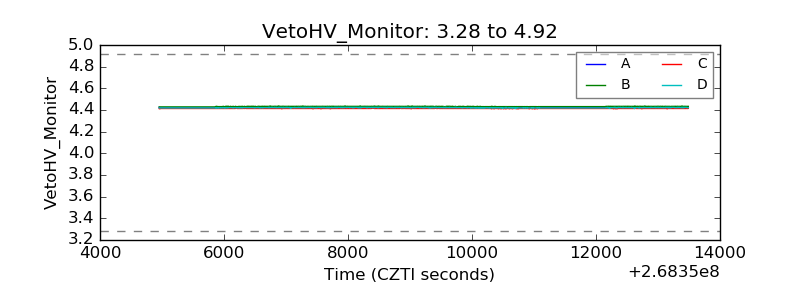 |
| Veto LLD | 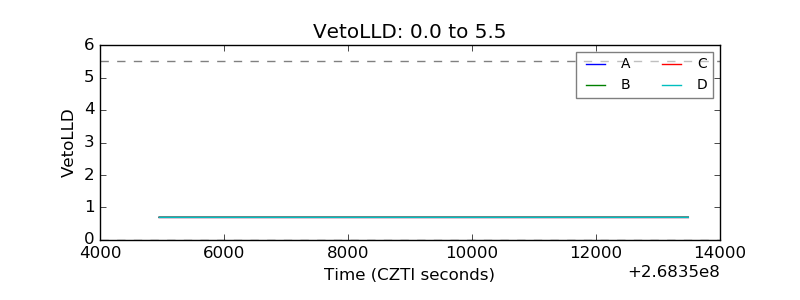 |
| Alpha Counter | 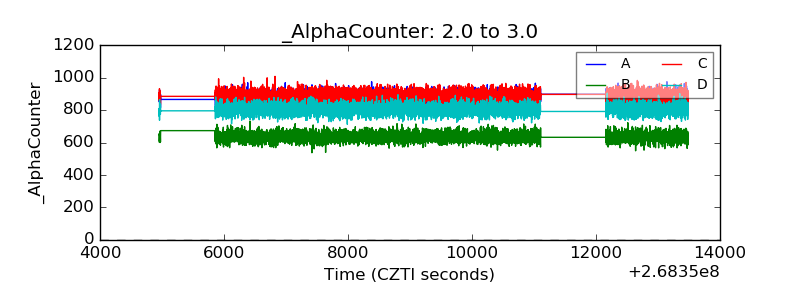 |
| _CPM_Rate | 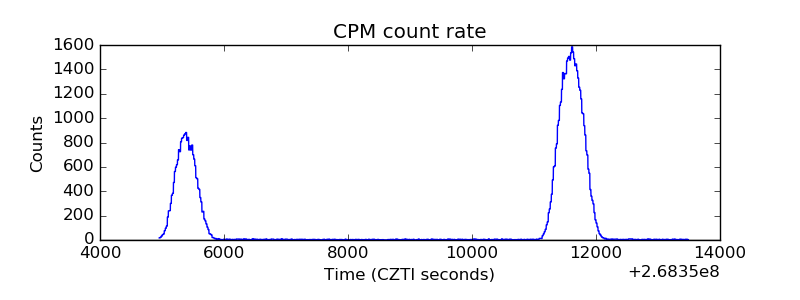 |
| CZT Counter | 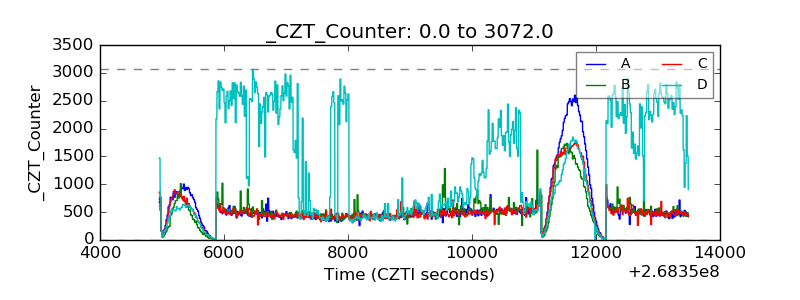 |
| +2.5 Volts monitor |  |
| +5 Volts monitor | 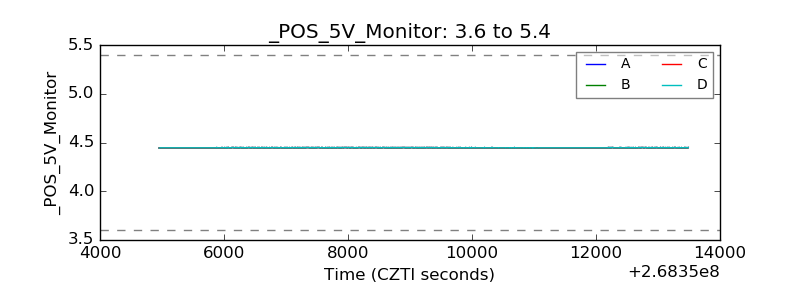 |
| _ROLL_ROT | 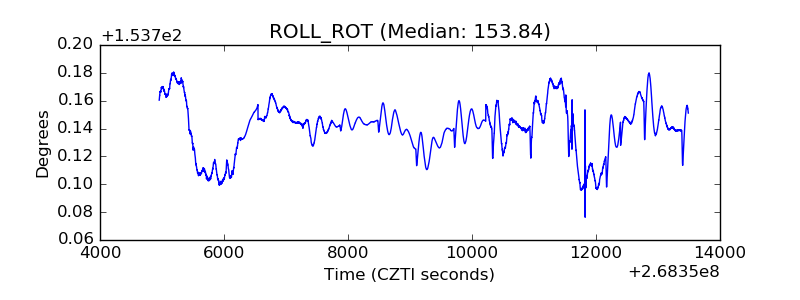 |
| _Roll_DEC | 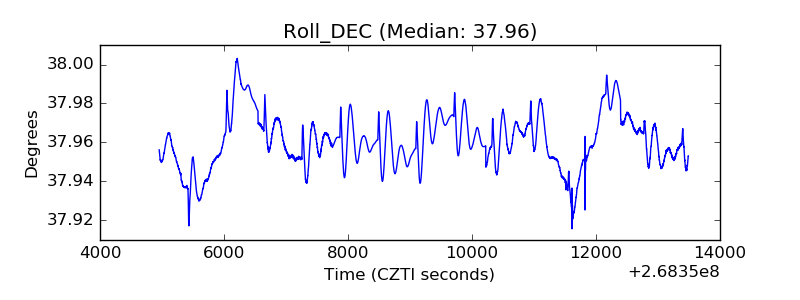 |
| _Roll_RA | 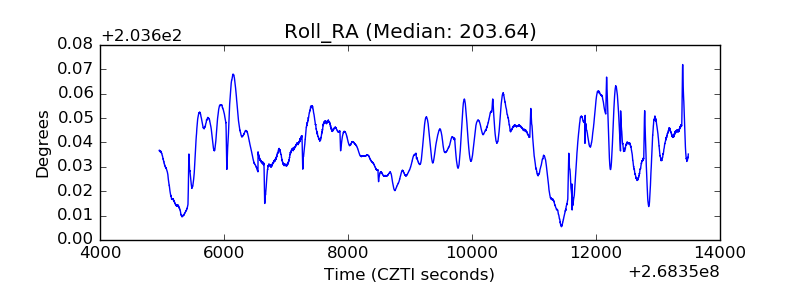 |
| Veto Counter | 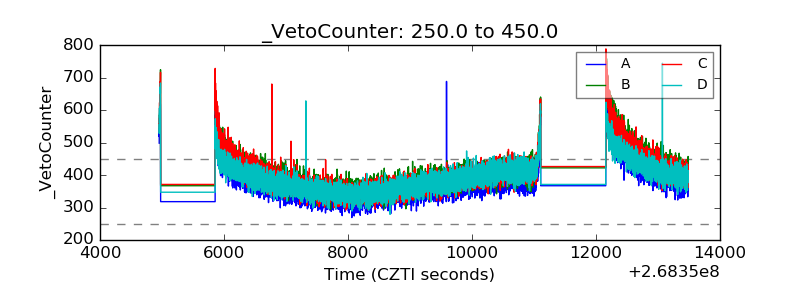 |