| Param | Original file | Final file |
|---|---|---|
| Filename | modeM0/AS1T02_056T01_9000002210_14948cztM0_level2.evt | modeM0/AS1T02_056T01_9000002210_14948cztM0_level2_quad_clean.evt |
| Size (bytes) | 730,229,760 | 66,323,520 |
| Size | 696.4 MB | 63.3 MB |
| Events in quadrant A | 3,259,985 | 411,654 |
| Events in quadrant B | 3,337,241 | 410,747 |
| Events in quadrant C | 3,258,057 | 401,082 |
| Events in quadrant D | 11,812,688 | 323,048 |
| Mode M0 | |||
|---|---|---|---|
| Quadrant | BADHDUFLAG | Total packets | Discarded packets |
| A | 0 | 13774 | 3 |
| B | 0 | 13973 | 2 |
| C | 0 | 13679 | 2 |
| D | 0 | 39538 | 2 |
| Mode M9 | |||
|---|---|---|---|
| Quadrant | BADHDUFLAG | Total packets | Discarded packets |
| A | 0 | 17 | 0 |
| B | 0 | 17 | 0 |
| C | 0 | 17 | 0 |
| D | 0 | 18 | 0 |
| Mode SS | |||
|---|---|---|---|
| Quadrant | BADHDUFLAG | Total packets | Discarded packets |
| A | 0 | 134 | 0 |
| B | 0 | 134 | 0 |
| C | 0 | 134 | 0 |
| D | 0 | 134 | 0 |
| Quadrant | Total seconds | Saturated seconds | Saturation percentage |
|---|---|---|---|
| A | 6612 | 28 | 0.423472% |
| B | 6612 | 45 | 0.680581% |
| C | 6612 | 10 | 0.151240% |
| D | 6612 | 3027 | 45.780399% |
Noise dominated data is calculated using 1-second bins in cleaned event files. If a bin has >2000 counts, and if more than 50% of those come from <1% of pixels, then it is considered to be noise-dominated and hence unusable.
| Quadrant | # 1 sec bins | Bins with >0 counts | Bins with >2000 counts | High rate bins dominated by noise | Noise dominated (total time) | Noise dominated (detector-on time) | Marked lightcurve |
|---|---|---|---|---|---|---|---|
| A | 7763 | 6614 | 1 | 1 | 0.01% | 0.02% | 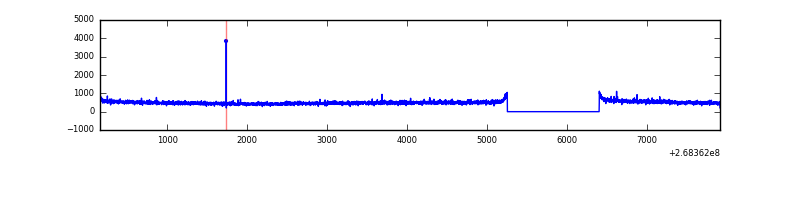 |
| B | 7763 | 6614 | 2 | 2 | 0.03% | 0.03% | 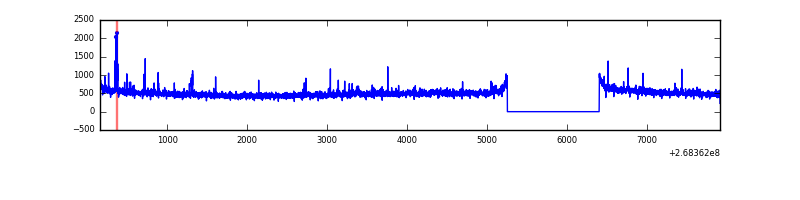 |
| C | 7763 | 6614 | 0 | 0 | 0.00% | 0.00% | 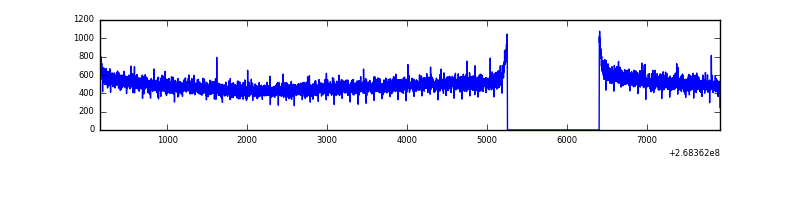 |
| D | 7763 | 6614 | 3043 | 3043 | 39.20% | 46.01% | 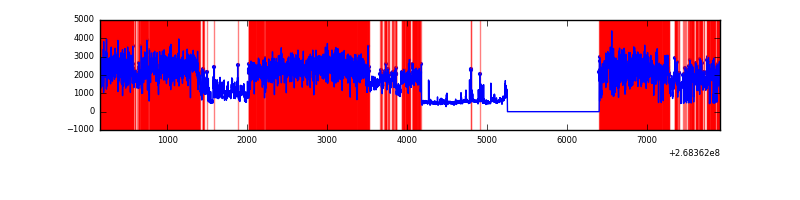 |
Top three noisy pixels from each quadrant. If the there are fewer than three noisy pixels in the level2.evt file, extra rows are filled as -1
| Pixel properties | Quadrant properties | ||||||
|---|---|---|---|---|---|---|---|
| Quadrant | DetID | PixID | Counts | Sigma | Mean | Median | Sigma |
| A | 12 | 189 | 49646 | 292.63 | 825 | 809 | 166.9 |
| A | 3 | 1 | 21086 | 121.5 | 825 | 809 | 166.9 |
| A | 9 | 143 | 10808 | 59.91 | 825 | 809 | 166.9 |
| B | 0 | 189 | 29833 | 184.83 | 825 | 806 | 157.0 |
| B | 0 | 230 | 24700 | 152.14 | 825 | 806 | 157.0 |
| B | 0 | 219 | 21287 | 130.41 | 825 | 806 | 157.0 |
| C | 3 | 233 | 157581 | 856.69 | 795 | 800 | 183.0 |
| C | 13 | 61 | 5806 | 27.35 | 795 | 800 | 183.0 |
| C | 3 | 202 | 1898 | 6.0 | 795 | 800 | 183.0 |
| D | 7 | 254 | 8804512 | 54266.93 | 686 | 670 | 162.2 |
| D | 7 | 223 | 256931 | 1579.59 | 686 | 670 | 162.2 |
| D | 13 | 249 | 67966 | 414.81 | 686 | 670 | 162.2 |
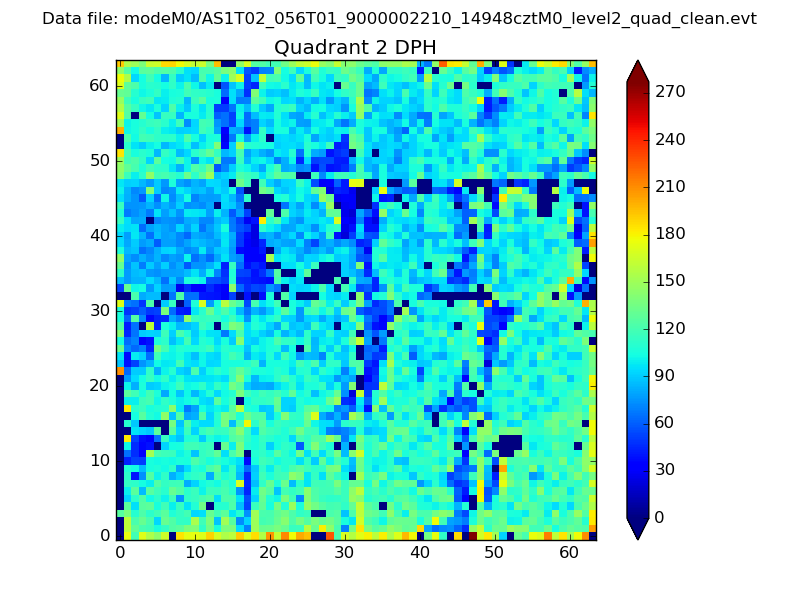
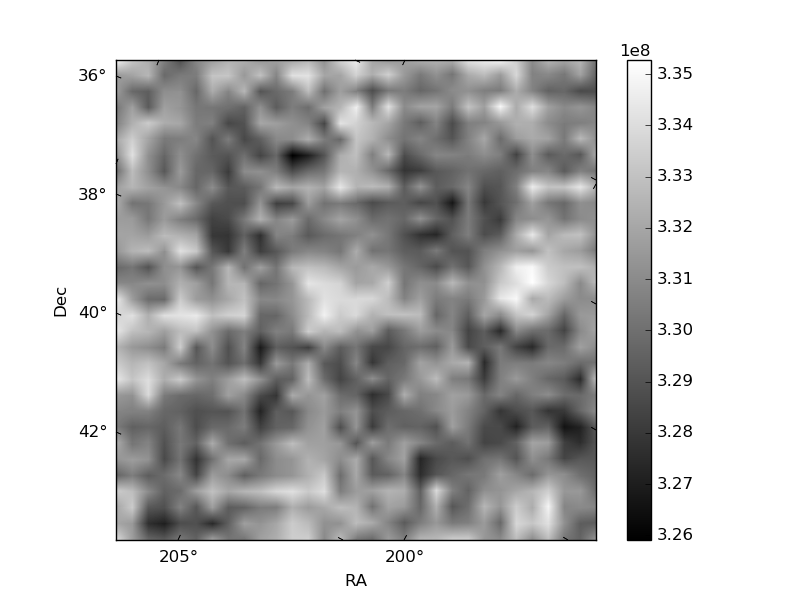
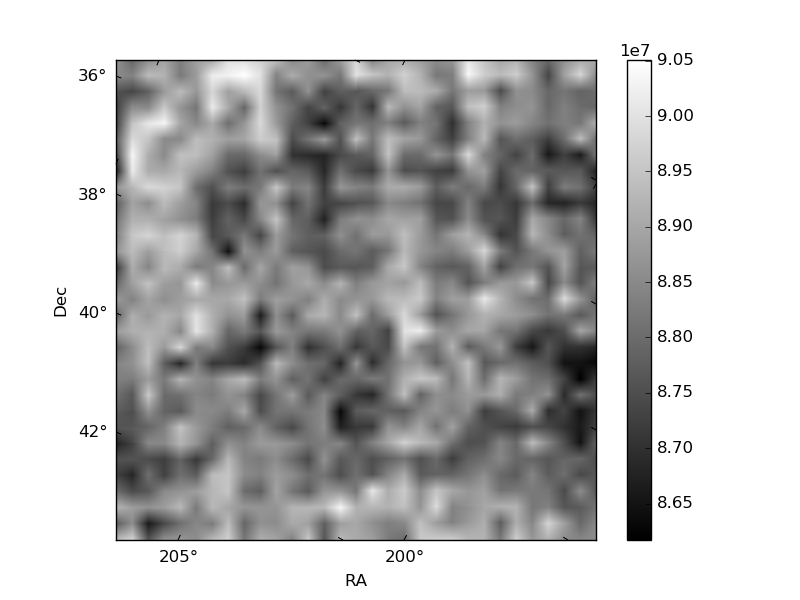
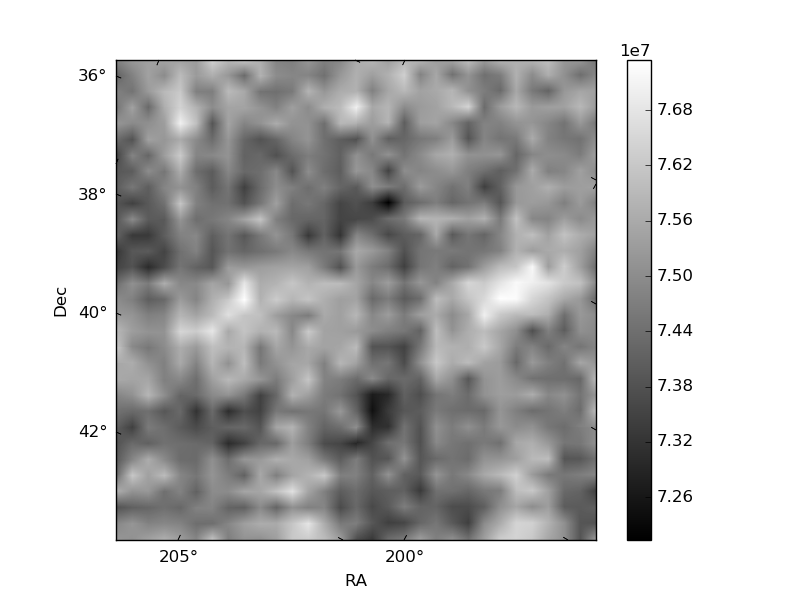
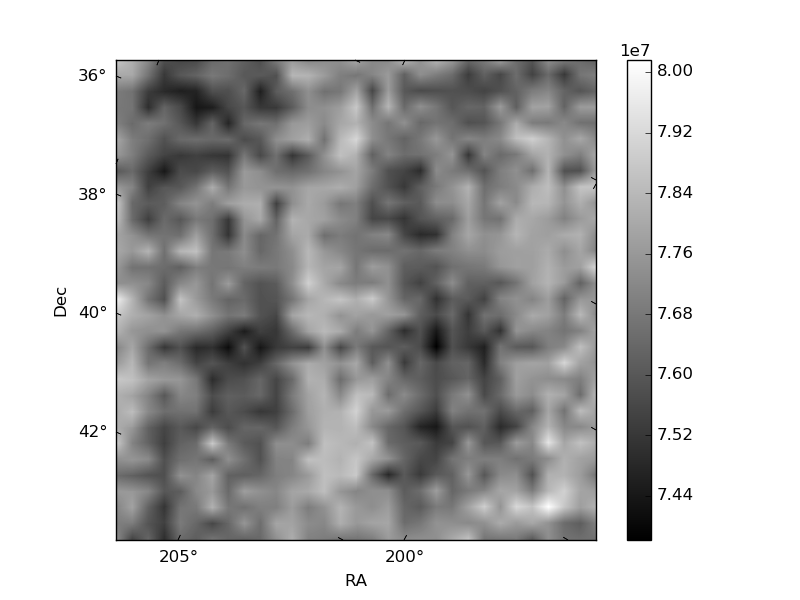
Histogram calculated using DETX and DETY for each event in the final _common_clean file
| Quadrant A | 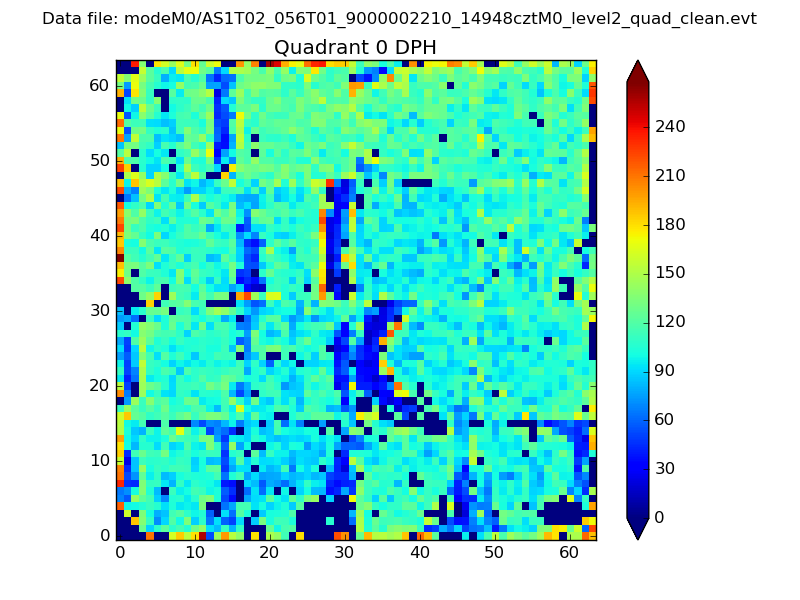 |
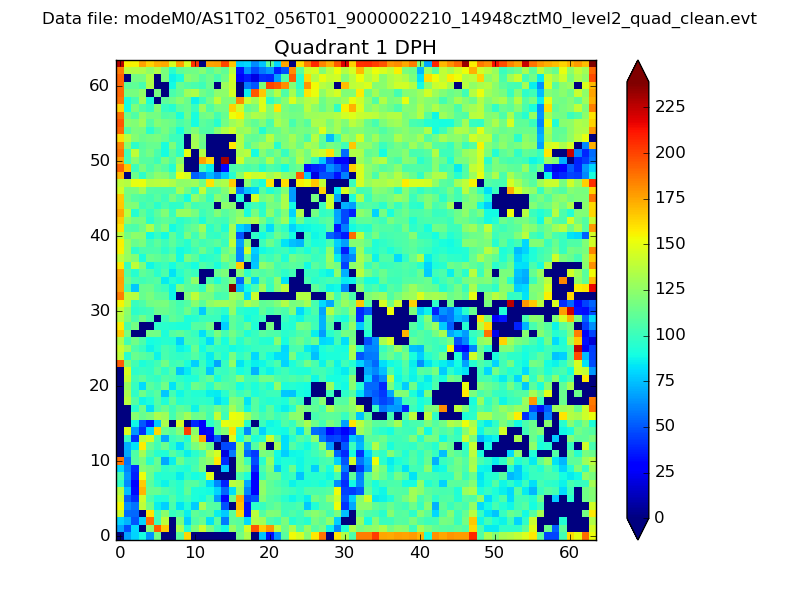 |
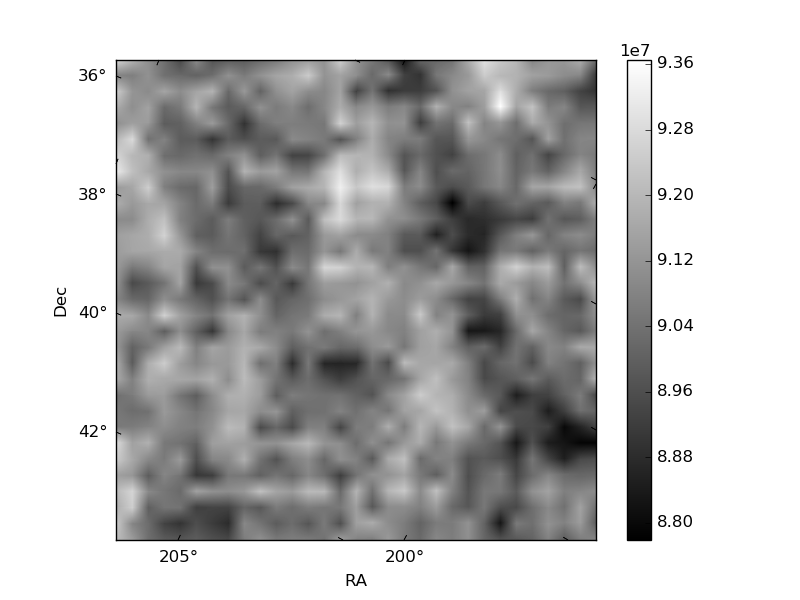
Quadrant B |
|---|---|---|---|
| Quadrant D | 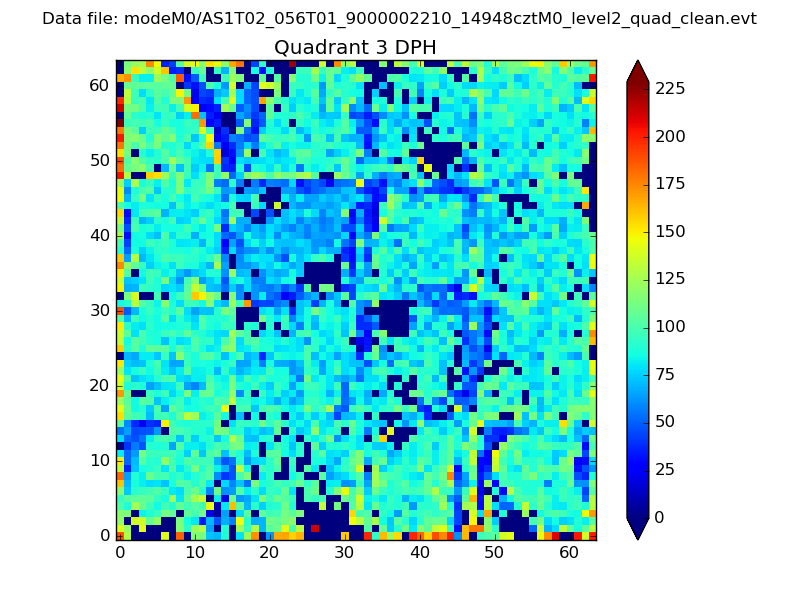 |
 |
Quadrant C |
| Plot type | Count rate plots | Images |
|---|---|---|
| Comparison with Poisson distribution Blue bars denote a histogram of data divided into 1 sec bins. Red curve is a Poisson curve with rate = median count rate of data. |
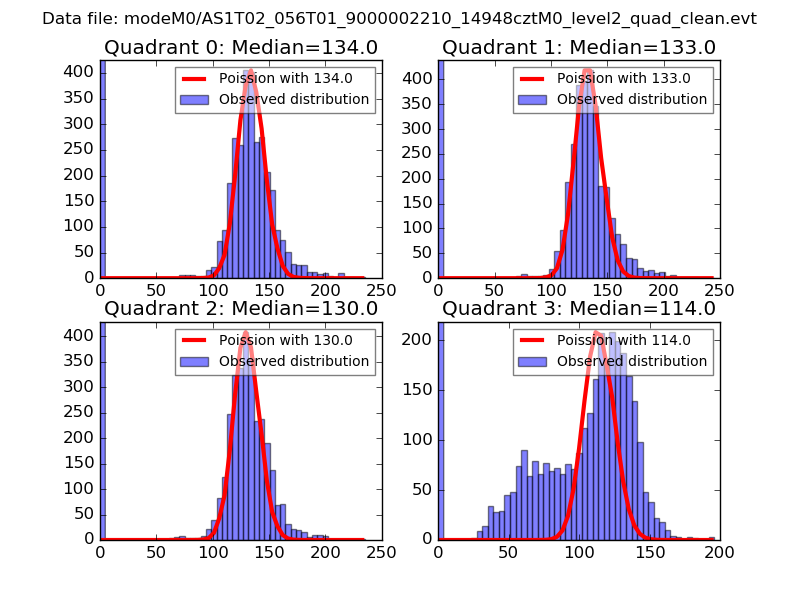 |
 |
| Quadrant-wise count rates Data is divided into 100 sec bins |
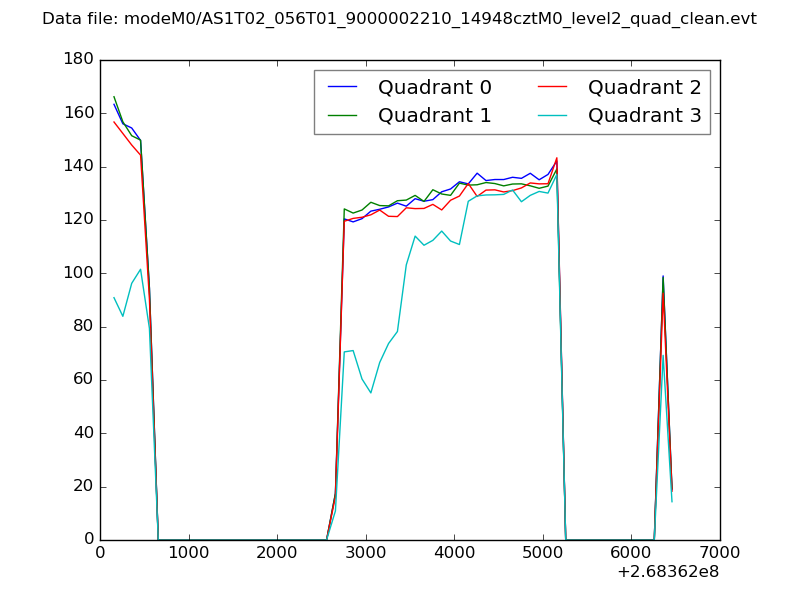 |
|
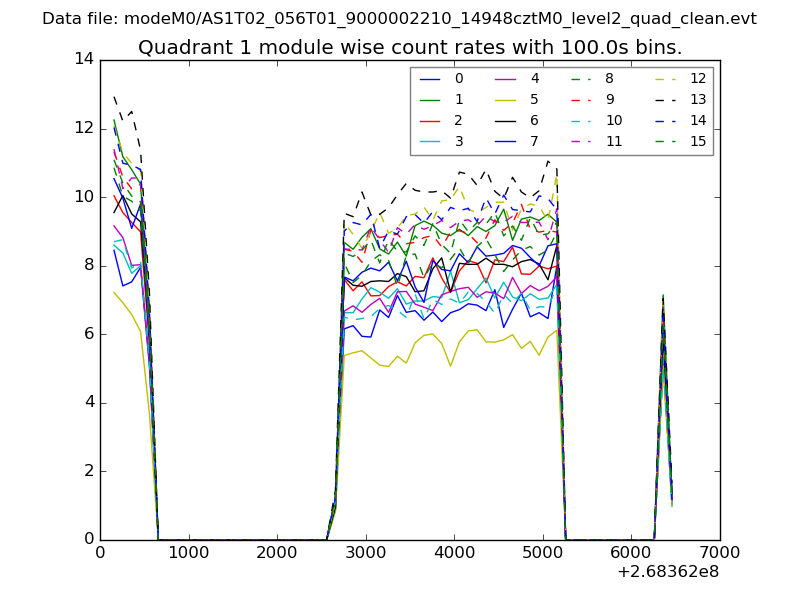
| Module-wise count rates for Quadrant A Data is divided into 100 sec bins |
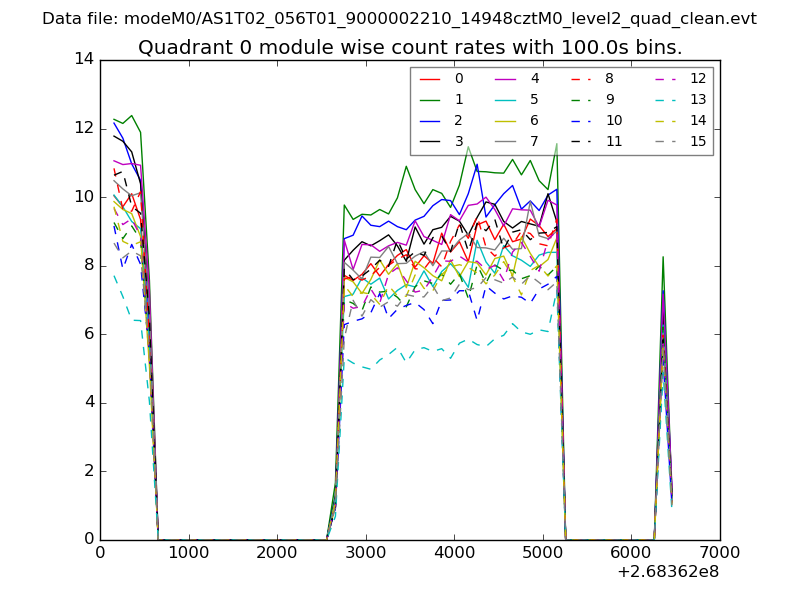 |
 |
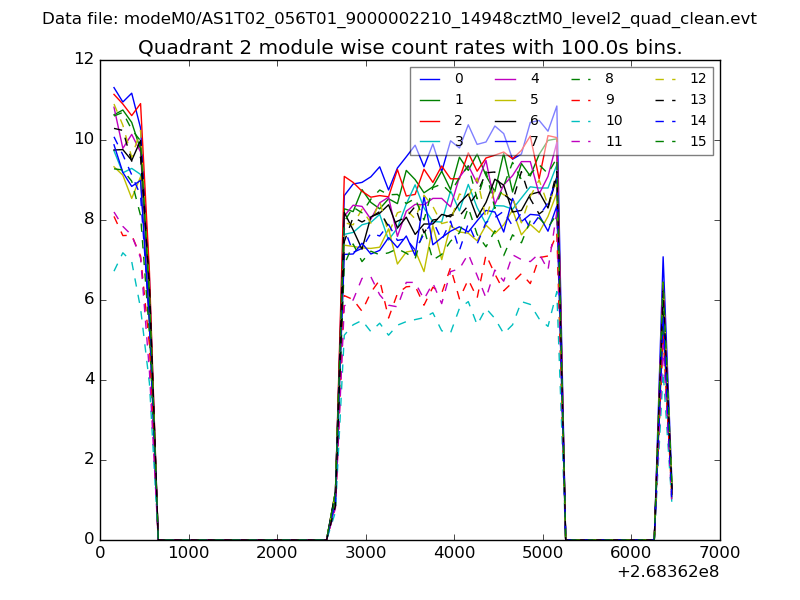
| Module-wise count rates for Quadrant B Data is divided into 100 sec bins |
 |
 |
| Module-wise count rates for Quadrant C Data is divided into 100 sec bins |
 |
 |
| Module-wise count rates for Quadrant D Data is divided into 100 sec bins |
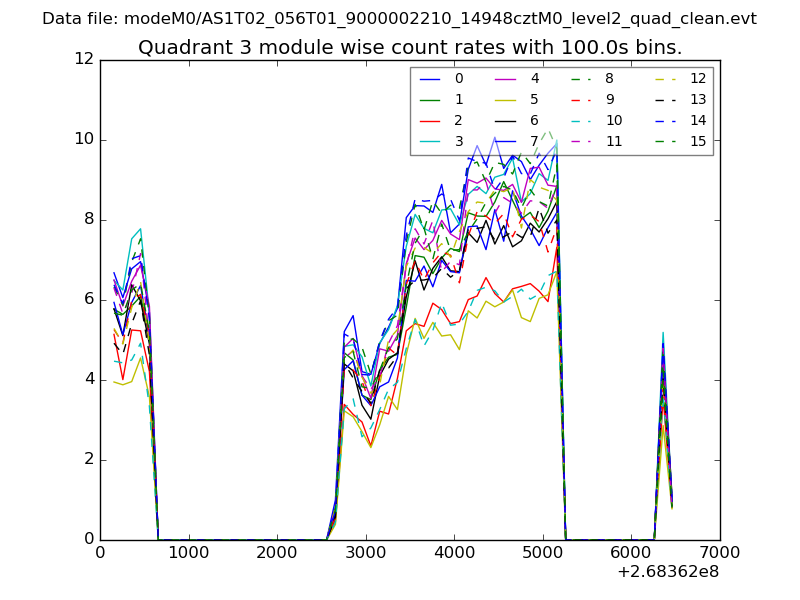 |
 |
| Parameter | Plot |
|---|---|
| CZT HV Monitor | 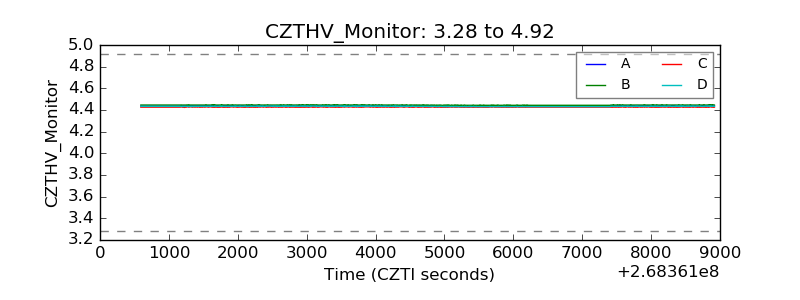 |
| D_VDD | 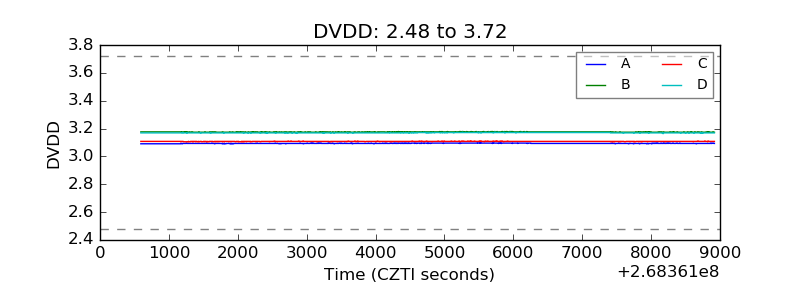 |
| Temperature 1 |  |
| Veto HV Monitor | 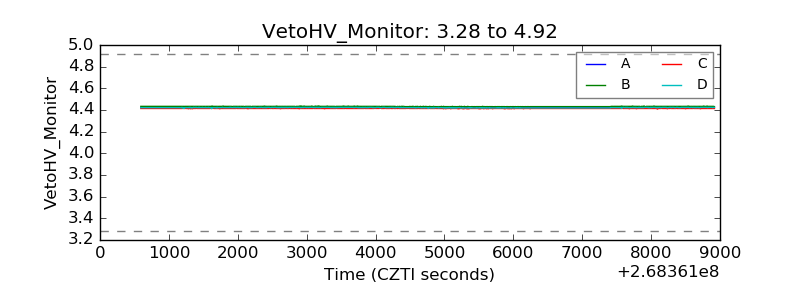 |
| Veto LLD |  |
| Alpha Counter |  |
| _CPM_Rate | 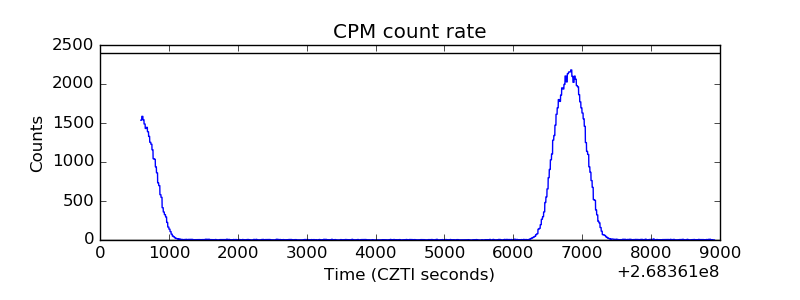 |
| CZT Counter | 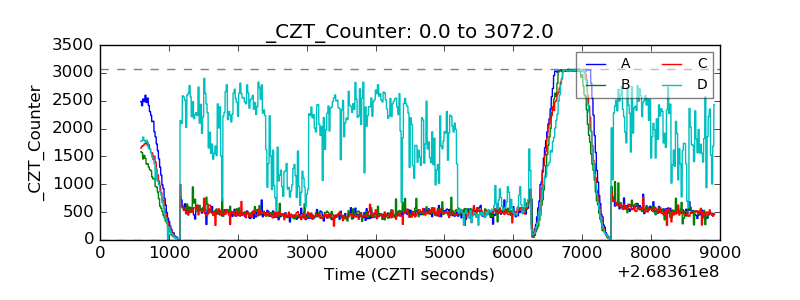 |
| +2.5 Volts monitor |  |
| +5 Volts monitor | 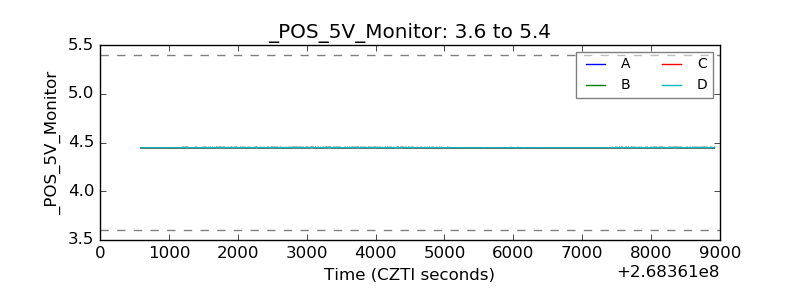 |
| _ROLL_ROT | 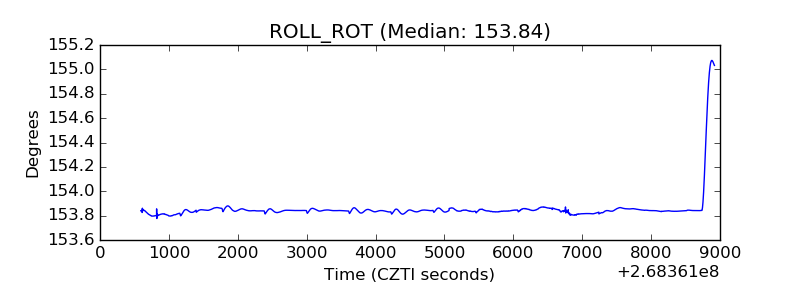 |
| _Roll_DEC | 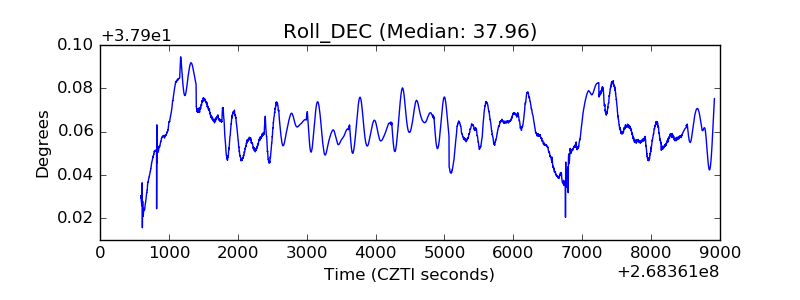 |
| _Roll_RA | 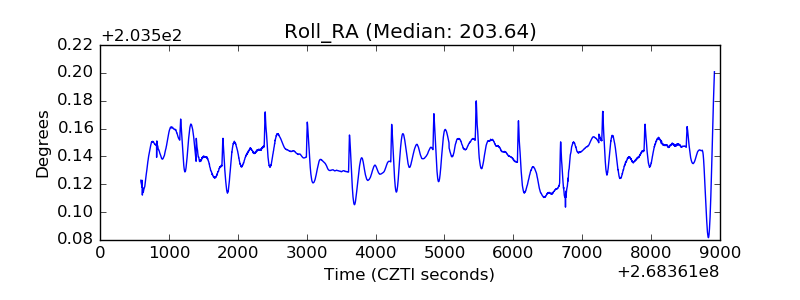 |
| Veto Counter | 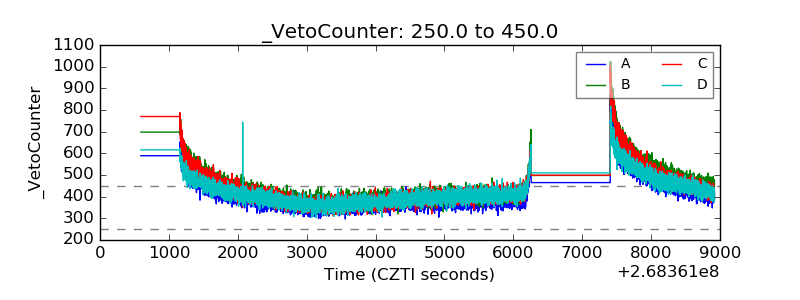 |