| Param | Original file | Final file |
|---|---|---|
| Filename | modeM0/AS1T02_056T01_9000002210_14950cztM0_level2.evt | modeM0/AS1T02_056T01_9000002210_14950cztM0_level2_quad_clean.evt |
| Size (bytes) | 614,882,880 | 61,626,240 |
| Size | 586.4 MB | 58.8 MB |
| Events in quadrant A | 2,949,921 | 381,815 |
| Events in quadrant B | 3,320,634 | 382,163 |
| Events in quadrant C | 2,917,393 | 369,777 |
| Events in quadrant D | 9,045,156 | 329,897 |
| Mode M0 | |||
|---|---|---|---|
| Quadrant | BADHDUFLAG | Total packets | Discarded packets |
| A | 0 | 12191 | 2 |
| B | 0 | 13297 | 1 |
| C | 0 | 11961 | 1 |
| D | 0 | 30915 | 1 |
| Mode M9 | |||
|---|---|---|---|
| Quadrant | BADHDUFLAG | Total packets | Discarded packets |
| A | 0 | 12 | 0 |
| B | 0 | 12 | 0 |
| C | 0 | 12 | 0 |
| D | 0 | 12 | 0 |
| Mode SS | |||
|---|---|---|---|
| Quadrant | BADHDUFLAG | Total packets | Discarded packets |
| A | 0 | 118 | 0 |
| B | 0 | 118 | 0 |
| C | 0 | 118 | 0 |
| D | 0 | 118 | 0 |
| Quadrant | Total seconds | Saturated seconds | Saturation percentage |
|---|---|---|---|
| A | 5745 | 28 | 0.487380% |
| B | 5745 | 189 | 3.289817% |
| C | 5745 | 14 | 0.243690% |
| D | 5745 | 1465 | 25.500435% |
Noise dominated data is calculated using 1-second bins in cleaned event files. If a bin has >2000 counts, and if more than 50% of those come from <1% of pixels, then it is considered to be noise-dominated and hence unusable.
| Quadrant | # 1 sec bins | Bins with >0 counts | Bins with >2000 counts | High rate bins dominated by noise | Noise dominated (total time) | Noise dominated (detector-on time) | Marked lightcurve |
|---|---|---|---|---|---|---|---|
| A | 7011 | 5747 | 1 | 1 | 0.01% | 0.02% | 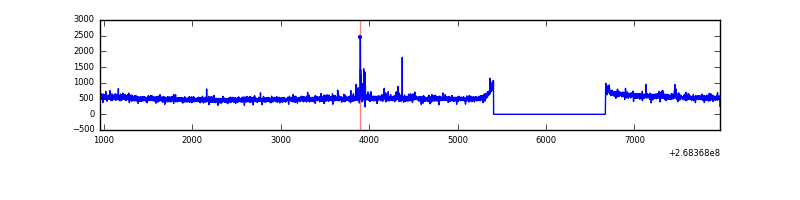 |
| B | 7011 | 5747 | 54 | 54 | 0.77% | 0.94% | 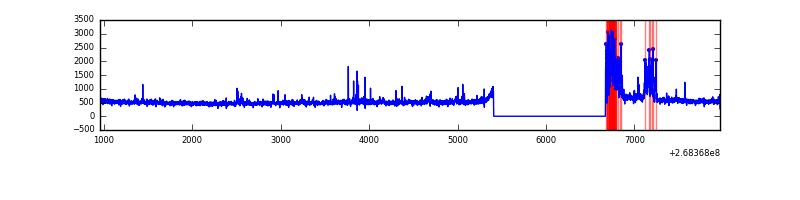 |
| C | 7011 | 5747 | 0 | 0 | 0.00% | 0.00% | 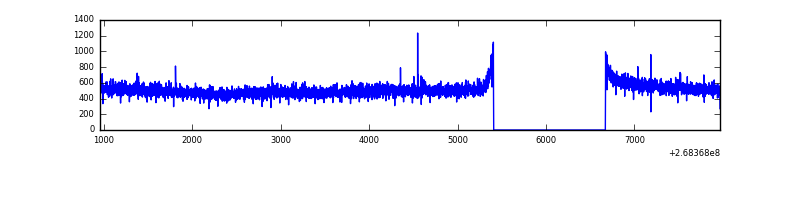 |
| D | 7011 | 5747 | 1569 | 1569 | 22.38% | 27.30% | 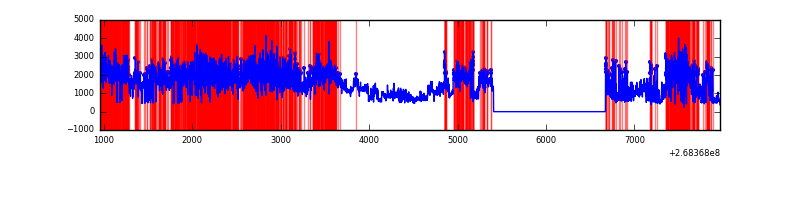 |
Top three noisy pixels from each quadrant. If the there are fewer than three noisy pixels in the level2.evt file, extra rows are filled as -1
| Pixel properties | Quadrant properties | ||||||
|---|---|---|---|---|---|---|---|
| Quadrant | DetID | PixID | Counts | Sigma | Mean | Median | Sigma |
| A | 12 | 189 | 42364 | 277.81 | 745 | 733 | 149.9 |
| A | 9 | 143 | 20495 | 131.87 | 745 | 733 | 149.9 |
| A | 3 | 1 | 13500 | 85.19 | 745 | 733 | 149.9 |
| B | 10 | 16 | 356318 | 2583.68 | 732 | 716 | 137.6 |
| B | 0 | 219 | 37543 | 267.57 | 732 | 716 | 137.6 |
| B | 0 | 189 | 20325 | 142.47 | 732 | 716 | 137.6 |
| C | 3 | 233 | 155851 | 949.81 | 708 | 711 | 163.3 |
| C | 13 | 61 | 5119 | 26.99 | 708 | 711 | 163.3 |
| C | 3 | 202 | 1756 | 6.4 | 708 | 711 | 163.3 |
| D | 7 | 254 | 6273422 | 39526.78 | 669 | 652 | 158.7 |
| D | 13 | 249 | 46368 | 288.07 | 669 | 652 | 158.7 |
| D | 7 | 223 | 41766 | 259.07 | 669 | 652 | 158.7 |
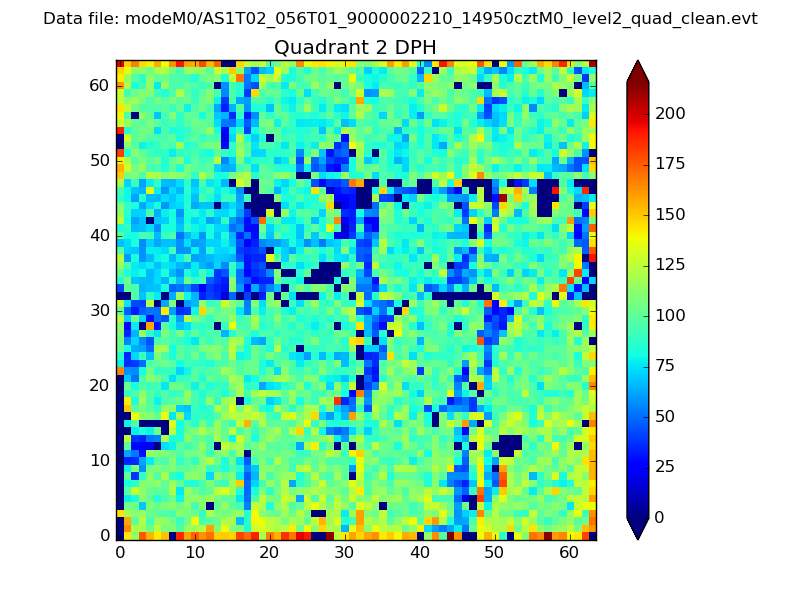
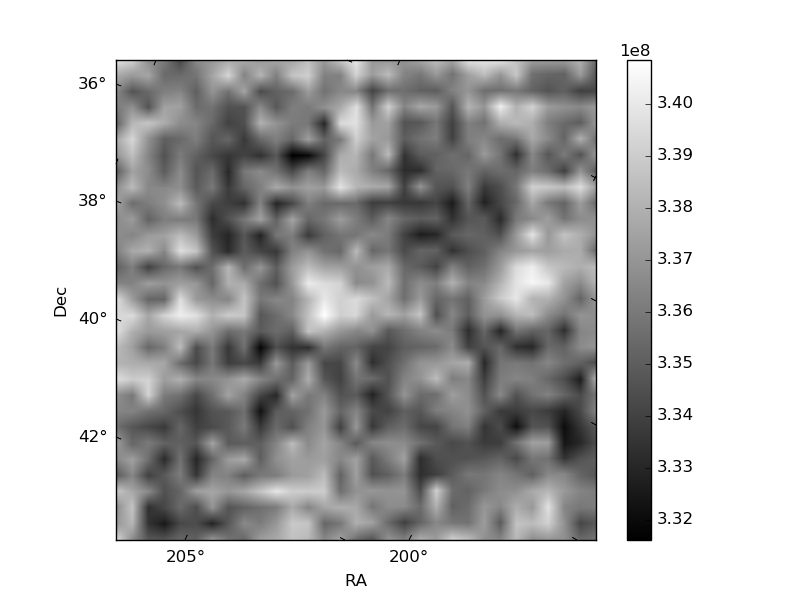
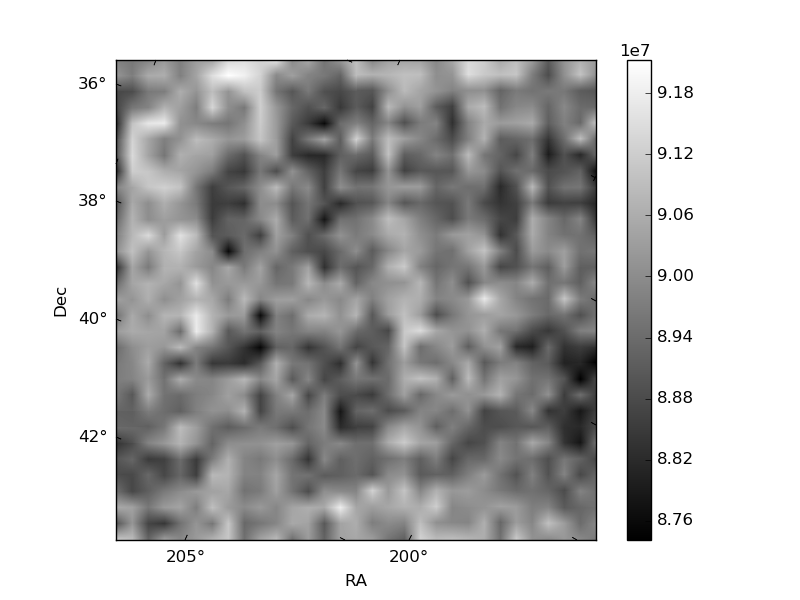
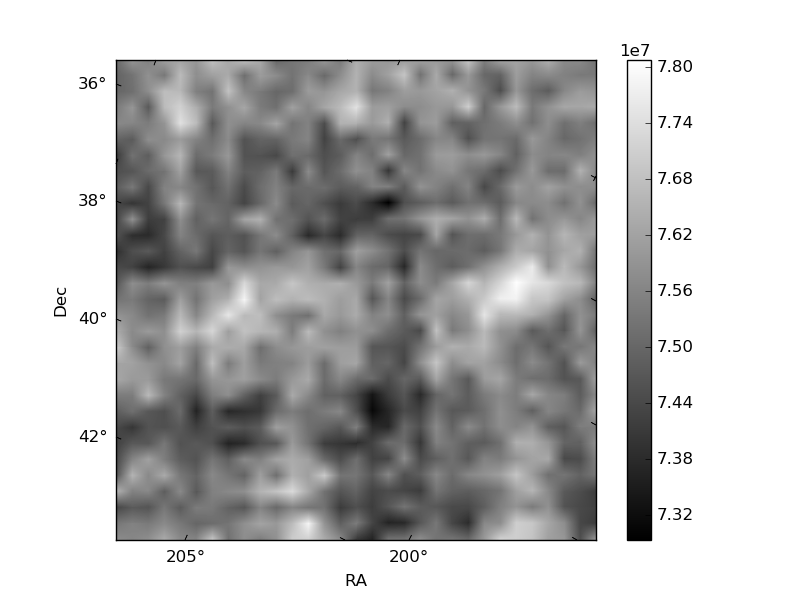
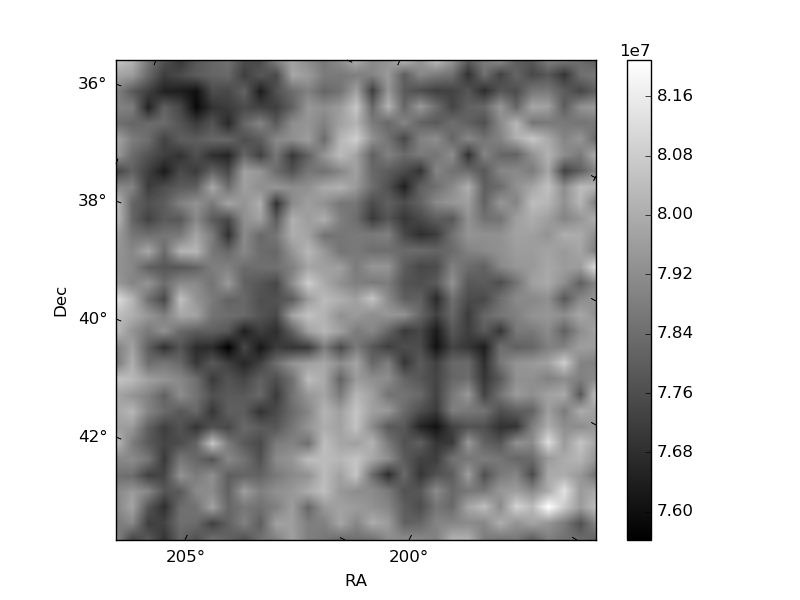
Histogram calculated using DETX and DETY for each event in the final _common_clean file
| Quadrant A | 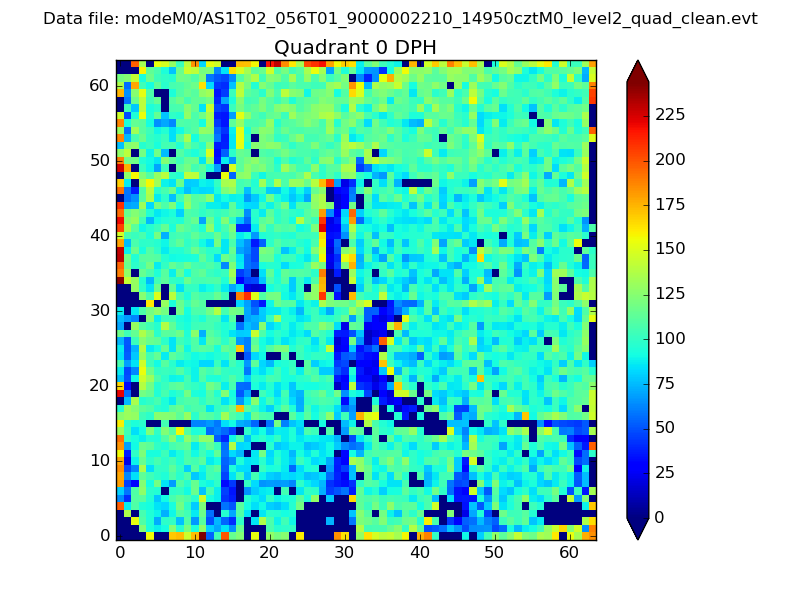 |
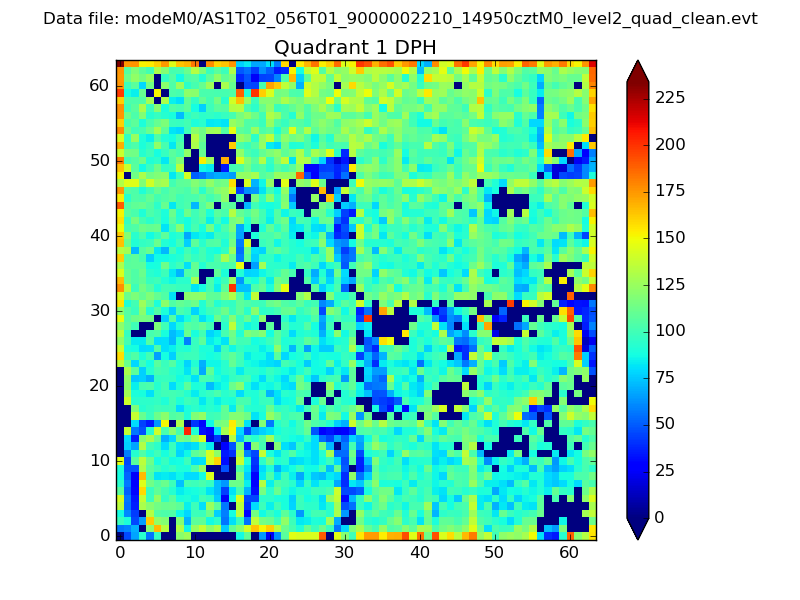 |
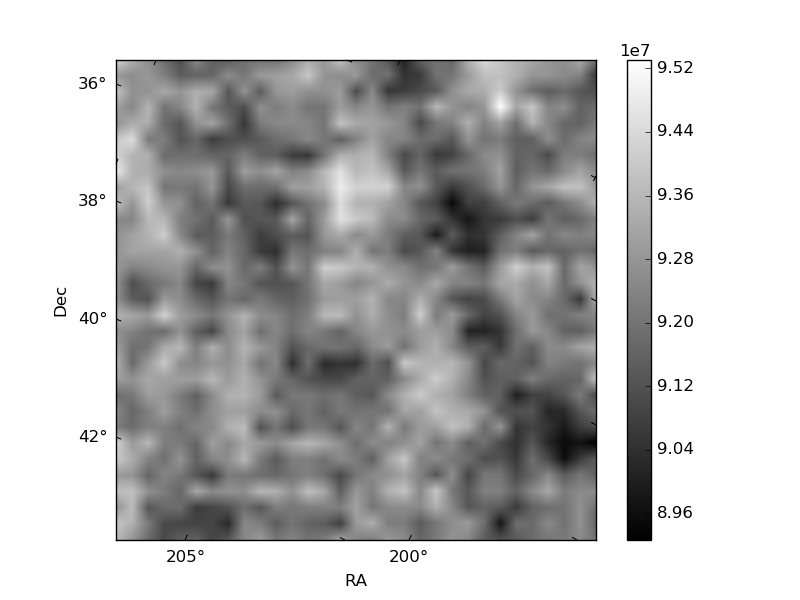
Quadrant B |
|---|---|---|---|
| Quadrant D | 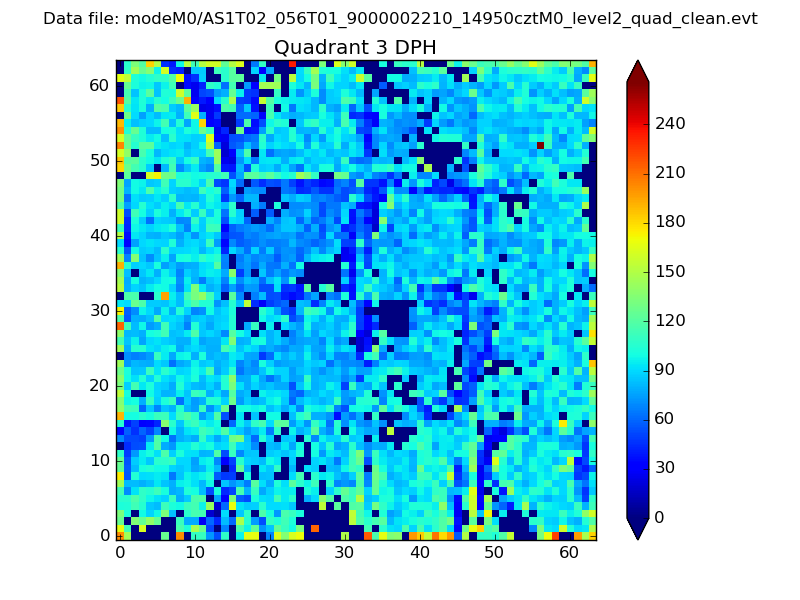 |
 |
Quadrant C |
| Plot type | Count rate plots | Images |
|---|---|---|
| Comparison with Poisson distribution Blue bars denote a histogram of data divided into 1 sec bins. Red curve is a Poisson curve with rate = median count rate of data. |
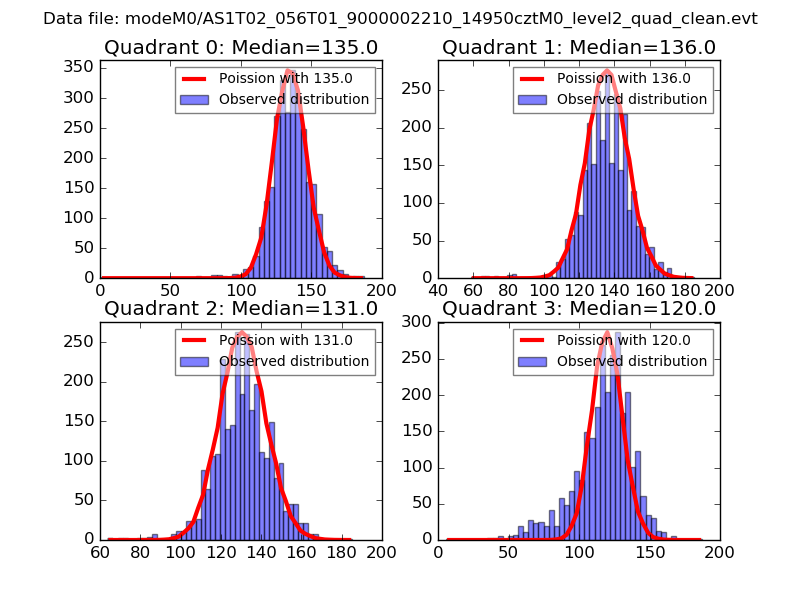 |
 |
| Quadrant-wise count rates Data is divided into 100 sec bins |
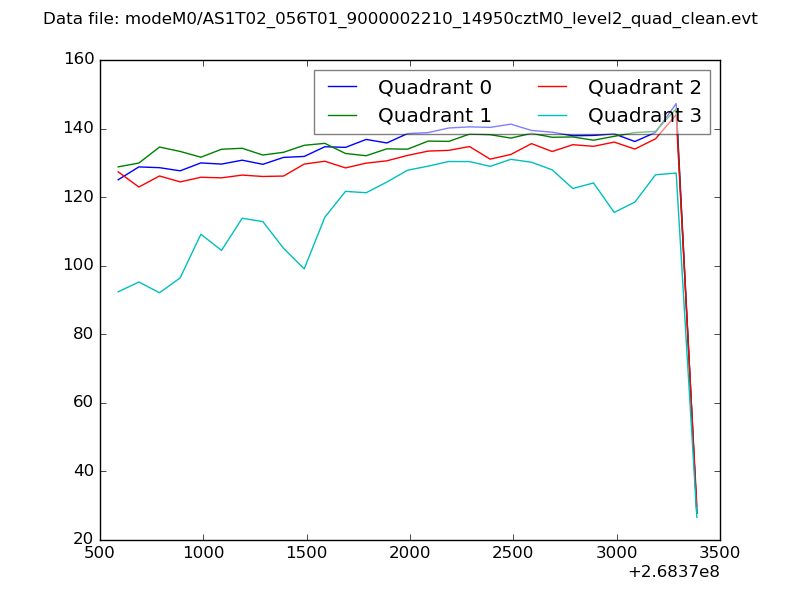 |
|
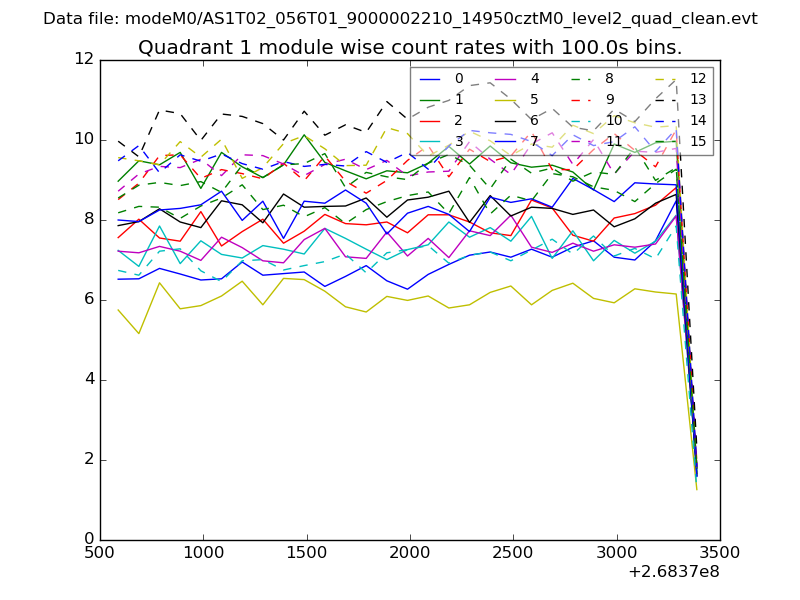
| Module-wise count rates for Quadrant A Data is divided into 100 sec bins |
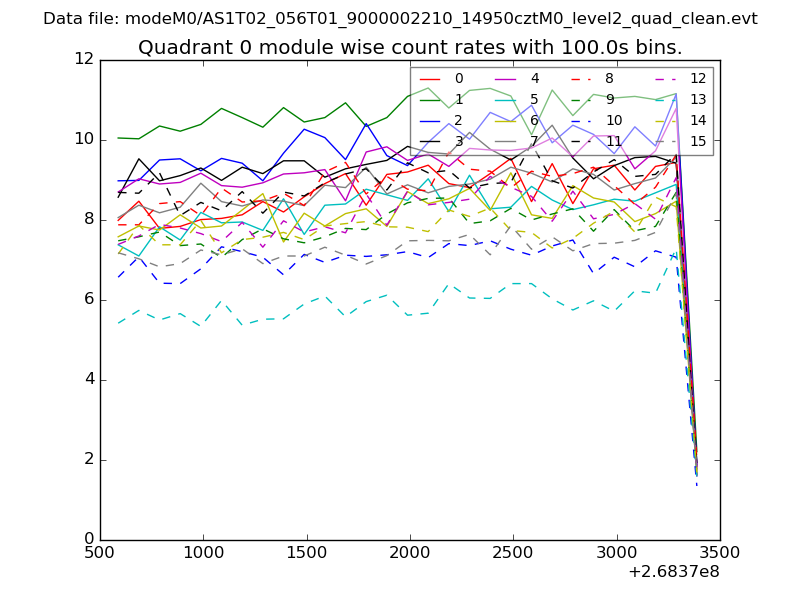 |
 |
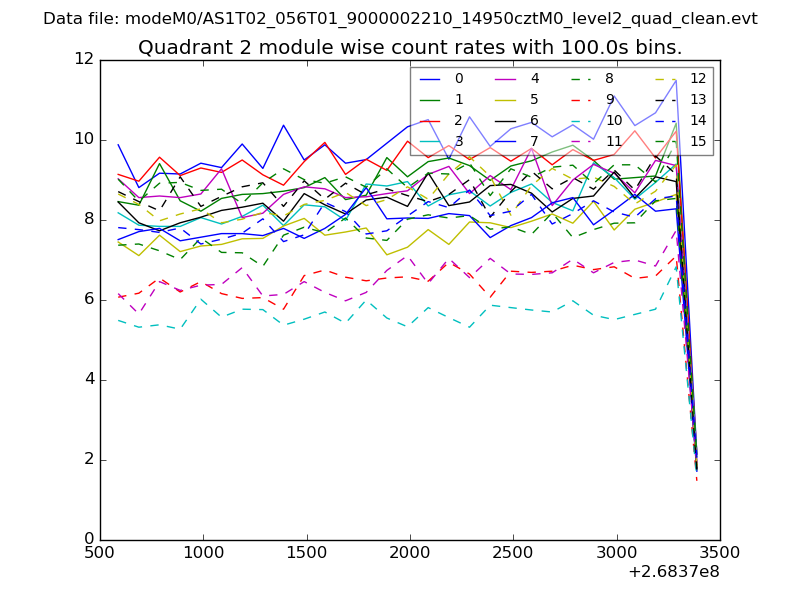
| Module-wise count rates for Quadrant B Data is divided into 100 sec bins |
 |
 |
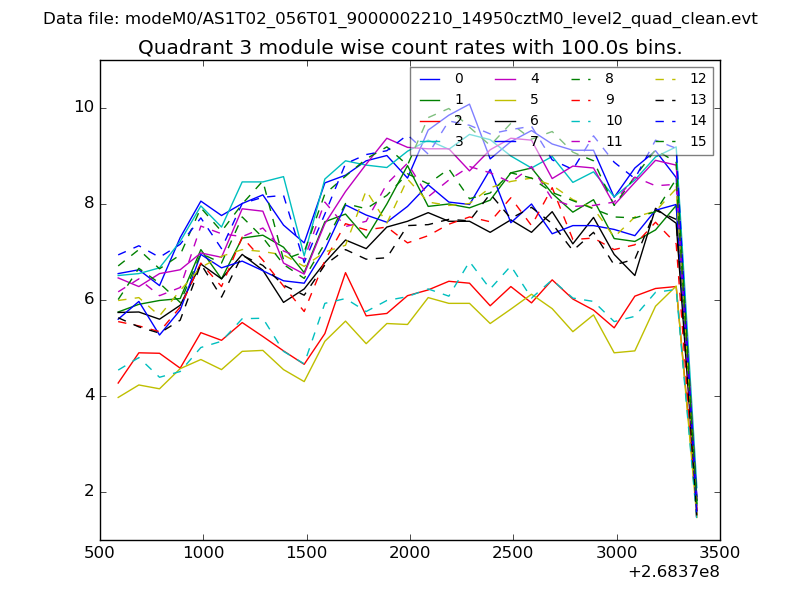
| Module-wise count rates for Quadrant C Data is divided into 100 sec bins |
 |
 |
| Module-wise count rates for Quadrant D Data is divided into 100 sec bins |
 |
 |
| Parameter | Plot |
|---|---|
| CZT HV Monitor | 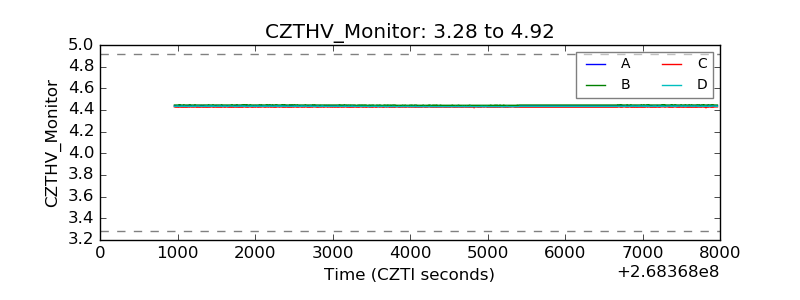 |
| D_VDD | 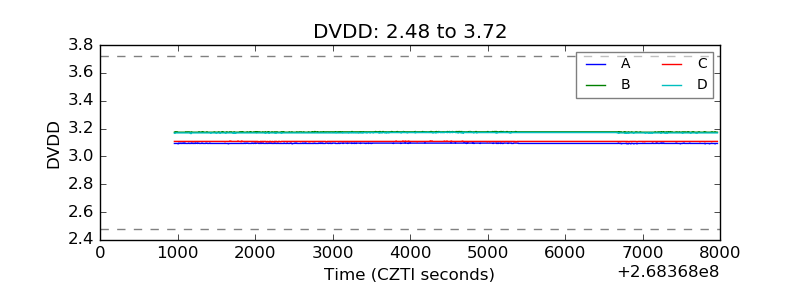 |
| Temperature 1 | 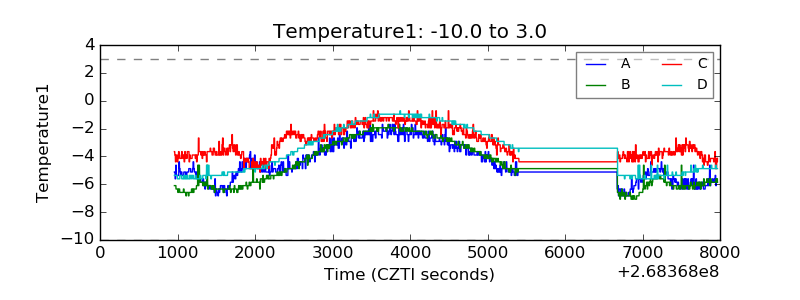 |
| Veto HV Monitor | 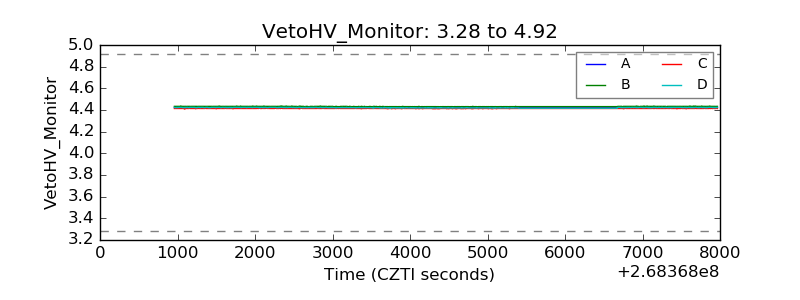 |
| Veto LLD |  |
| Alpha Counter | 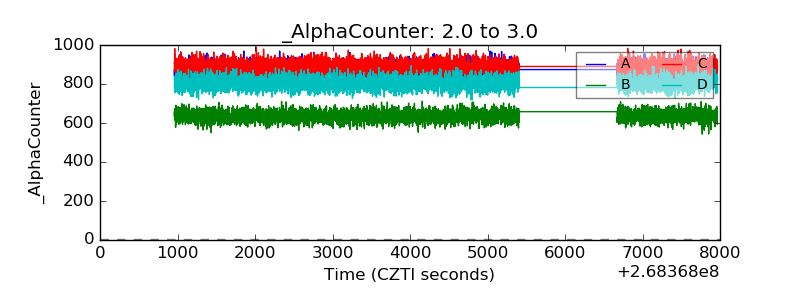 |
| _CPM_Rate | 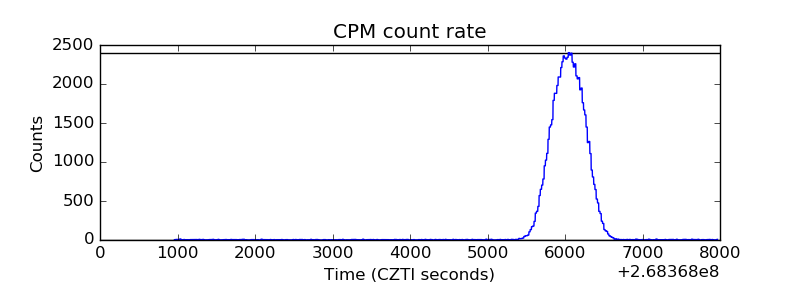 |
| CZT Counter | 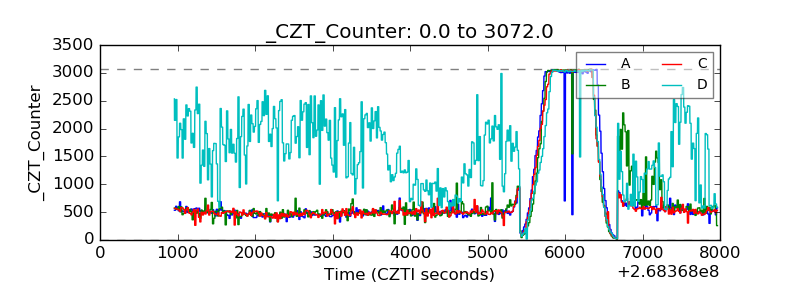 |
| +2.5 Volts monitor |  |
| +5 Volts monitor | 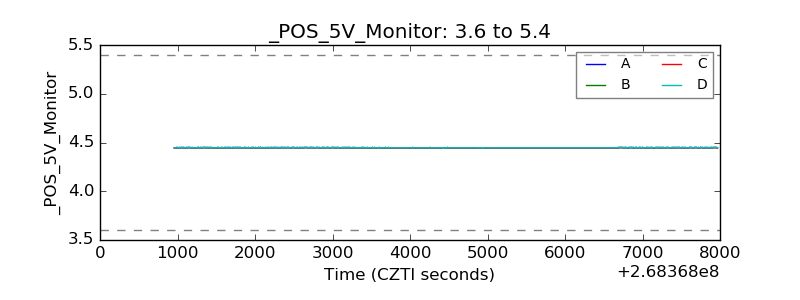 |
| _ROLL_ROT | 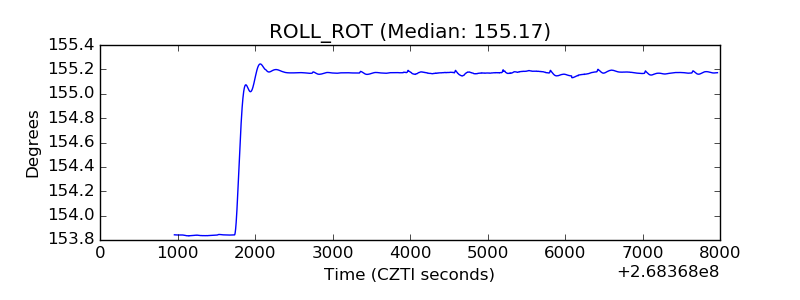 |
| _Roll_DEC | 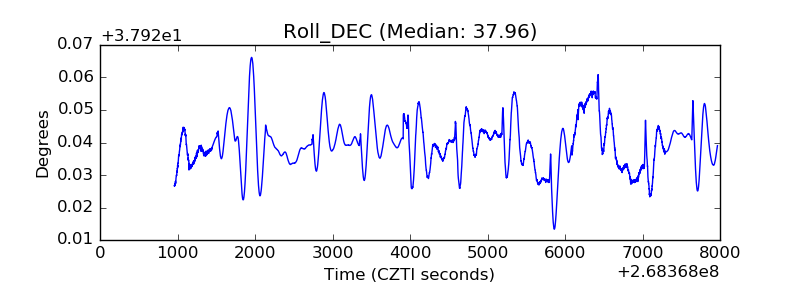 |
| _Roll_RA | 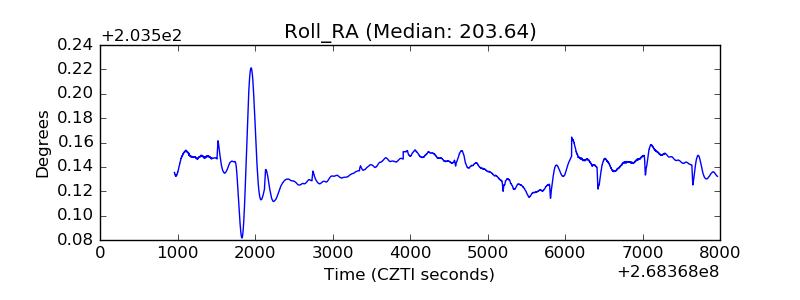 |
| Veto Counter | 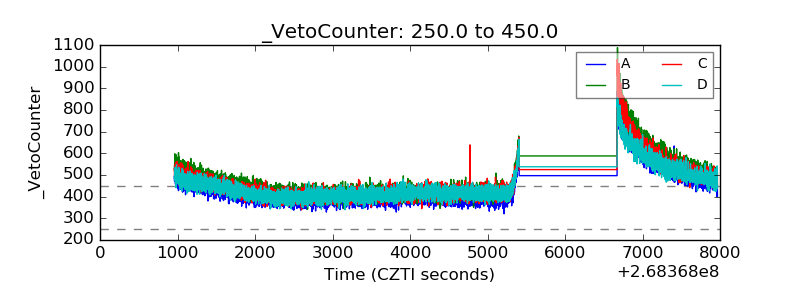 |