| Param | Original file | Final file |
|---|---|---|
| Filename | modeM0/AS1T02_056T01_9000002210_14951cztM0_level2.evt | modeM0/AS1T02_056T01_9000002210_14951cztM0_level2_quad_clean.evt |
| Size (bytes) | 681,408,000 | 68,184,000 |
| Size | 649.8 MB | 65.0 MB |
| Events in quadrant A | 3,400,592 | 448,357 |
| Events in quadrant B | 5,135,709 | 375,226 |
| Events in quadrant C | 3,279,830 | 433,148 |
| Events in quadrant D | 8,398,711 | 371,387 |
| Mode M0 | |||
|---|---|---|---|
| Quadrant | BADHDUFLAG | Total packets | Discarded packets |
| A | 0 | 13855 | 3 |
| B | 0 | 19150 | 2 |
| C | 0 | 13305 | 2 |
| D | 0 | 29284 | 2 |
| Mode M9 | |||
|---|---|---|---|
| Quadrant | BADHDUFLAG | Total packets | Discarded packets |
| A | 0 | 20 | 0 |
| B | 0 | 20 | 0 |
| C | 0 | 20 | 0 |
| D | 0 | 21 | 0 |
| Mode SS | |||
|---|---|---|---|
| Quadrant | BADHDUFLAG | Total packets | Discarded packets |
| A | 0 | 128 | 0 |
| B | 0 | 128 | 0 |
| C | 0 | 128 | 0 |
| D | 0 | 128 | 0 |
| Quadrant | Total seconds | Saturated seconds | Saturation percentage |
|---|---|---|---|
| A | 6235 | 52 | 0.834002% |
| B | 6235 | 879 | 14.097835% |
| C | 6235 | 30 | 0.481155% |
| D | 6235 | 1391 | 22.309543% |
Noise dominated data is calculated using 1-second bins in cleaned event files. If a bin has >2000 counts, and if more than 50% of those come from <1% of pixels, then it is considered to be noise-dominated and hence unusable.
| Quadrant | # 1 sec bins | Bins with >0 counts | Bins with >2000 counts | High rate bins dominated by noise | Noise dominated (total time) | Noise dominated (detector-on time) | Marked lightcurve |
|---|---|---|---|---|---|---|---|
| A | 7576 | 6237 | 0 | 0 | 0.00% | 0.00% | 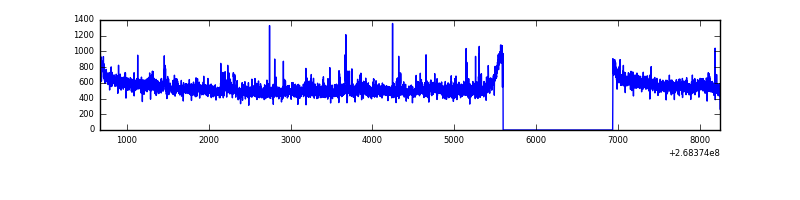 |
| B | 7576 | 6236 | 616 | 616 | 8.13% | 9.88% | 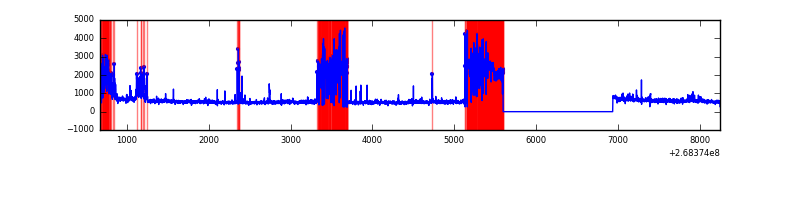 |
| C | 7576 | 6237 | 0 | 0 | 0.00% | 0.00% | 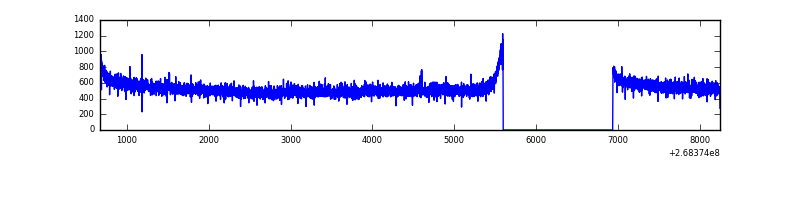 |
| D | 7576 | 6237 | 1395 | 1395 | 18.41% | 22.37% | 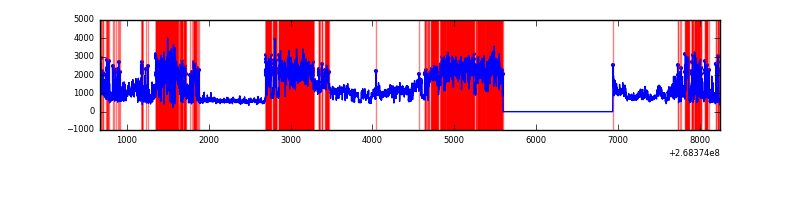 |
Top three noisy pixels from each quadrant. If the there are fewer than three noisy pixels in the level2.evt file, extra rows are filled as -1
| Pixel properties | Quadrant properties | ||||||
|---|---|---|---|---|---|---|---|
| Quadrant | DetID | PixID | Counts | Sigma | Mean | Median | Sigma |
| A | 12 | 189 | 66484 | 385.81 | 852 | 835 | 170.2 |
| A | 3 | 1 | 30324 | 173.3 | 852 | 835 | 170.2 |
| A | 1 | 162 | 13400 | 73.84 | 852 | 835 | 170.2 |
| B | 10 | 16 | 1991892 | 14010.55 | 768 | 753 | 142.1 |
| B | 3 | 64 | 50192 | 347.87 | 768 | 753 | 142.1 |
| B | 0 | 219 | 37955 | 261.77 | 768 | 753 | 142.1 |
| C | 3 | 233 | 141225 | 762.34 | 804 | 812 | 184.2 |
| C | 13 | 61 | 5771 | 26.92 | 804 | 812 | 184.2 |
| C | 3 | 202 | 1951 | 6.18 | 804 | 812 | 184.2 |
| D | 7 | 254 | 5213718 | 28995.97 | 760 | 741 | 179.8 |
| D | 12 | 110 | 200330 | 1110.16 | 760 | 741 | 179.8 |
| D | 7 | 223 | 33889 | 184.38 | 760 | 741 | 179.8 |
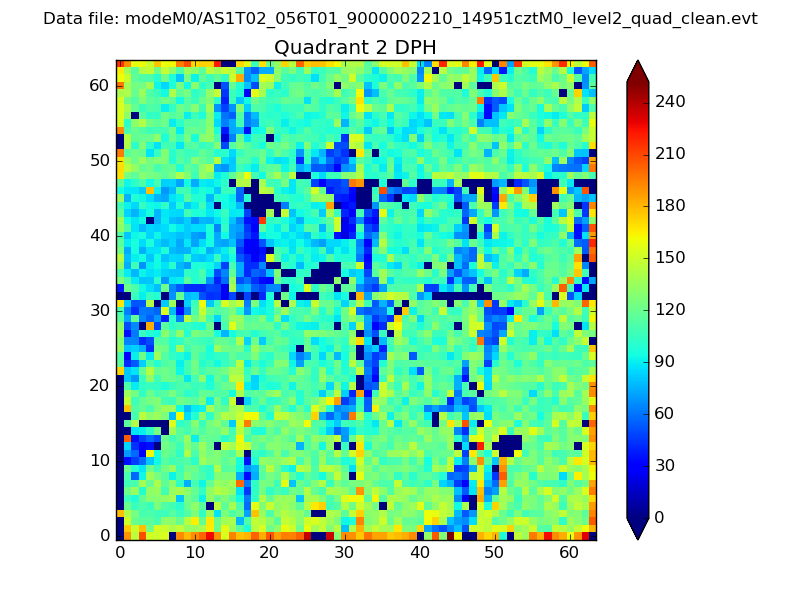
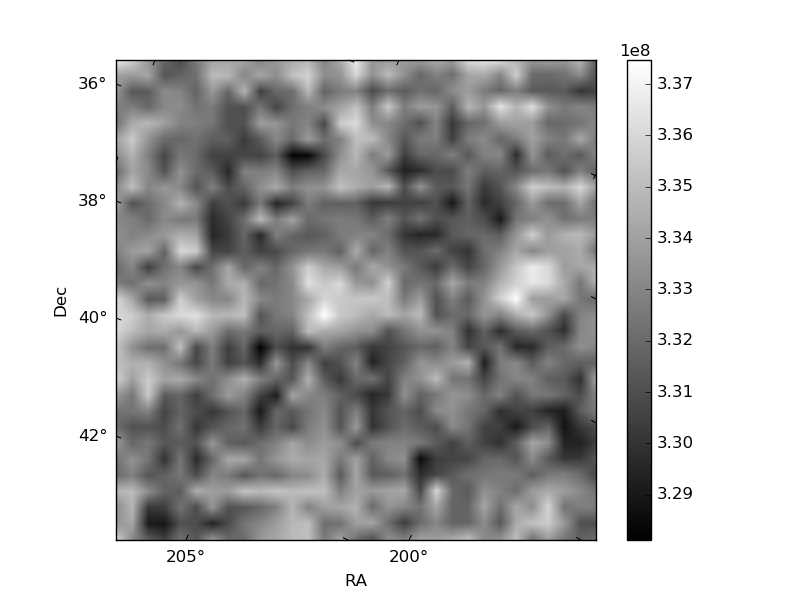
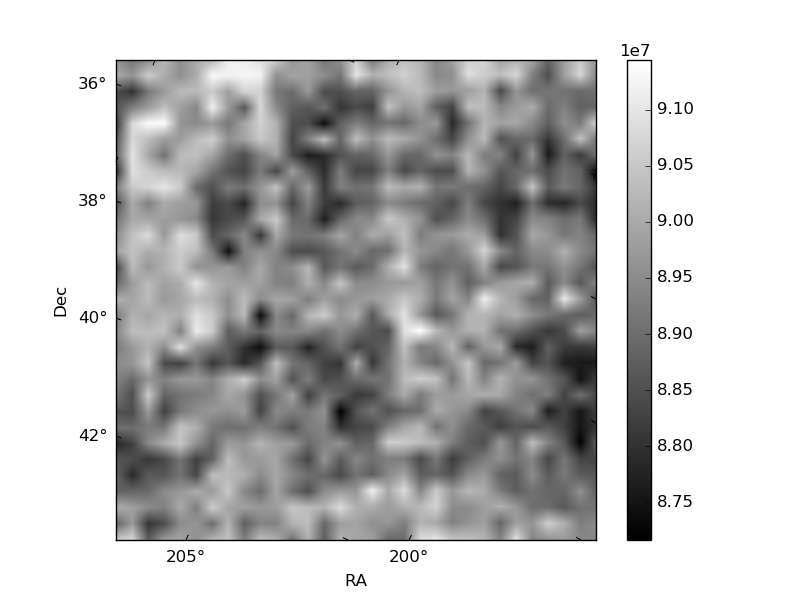
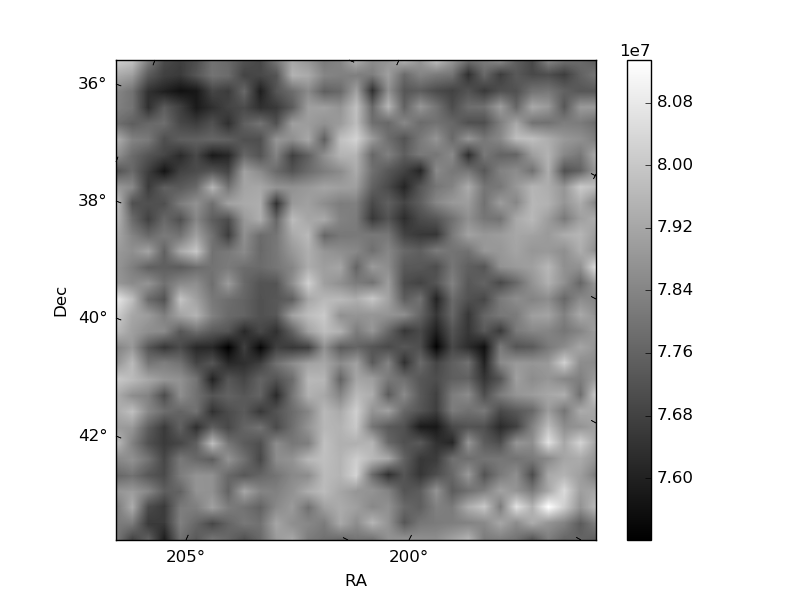
Histogram calculated using DETX and DETY for each event in the final _common_clean file
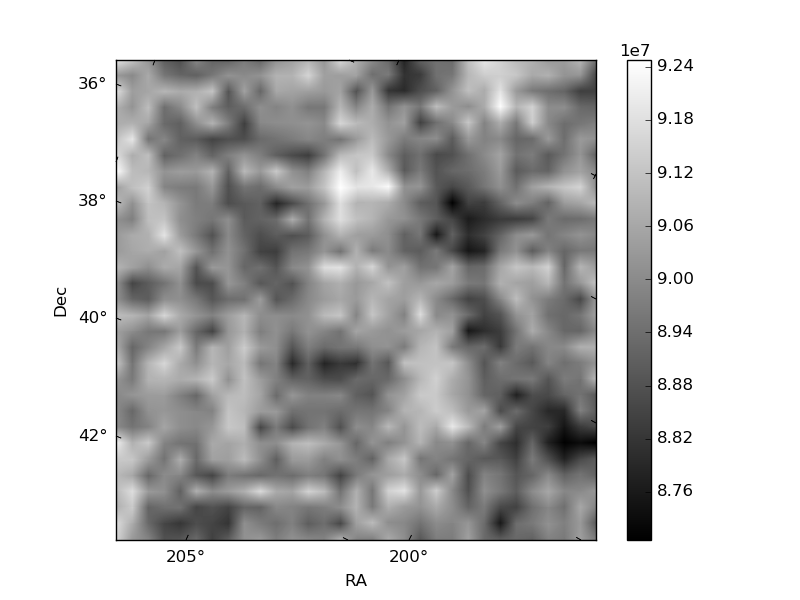
| Quadrant A | 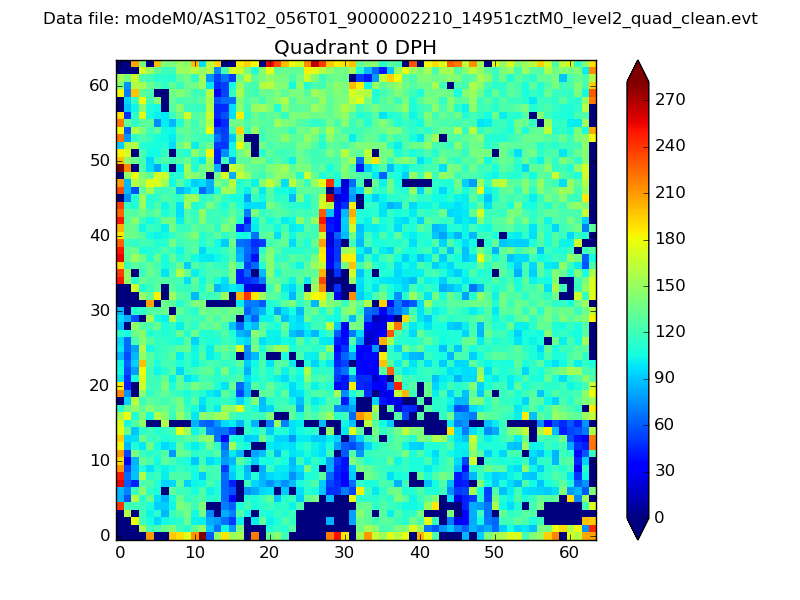 |
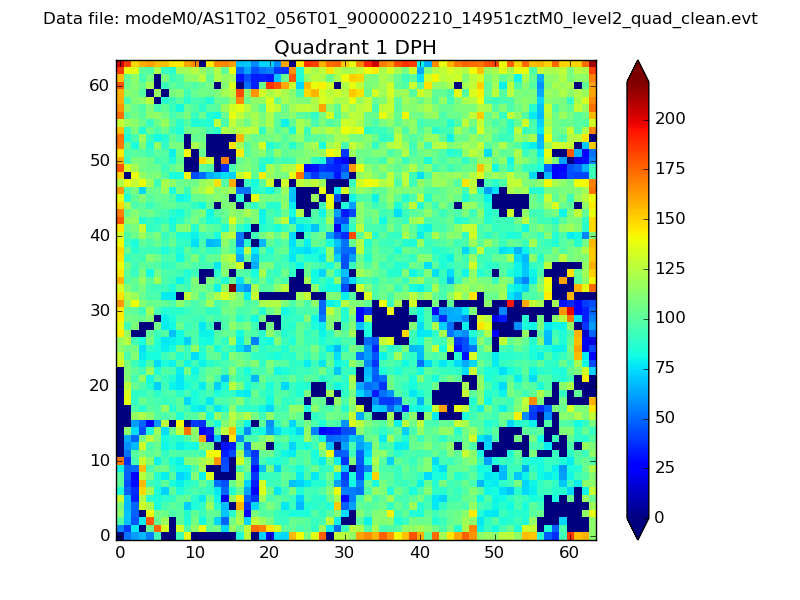 |
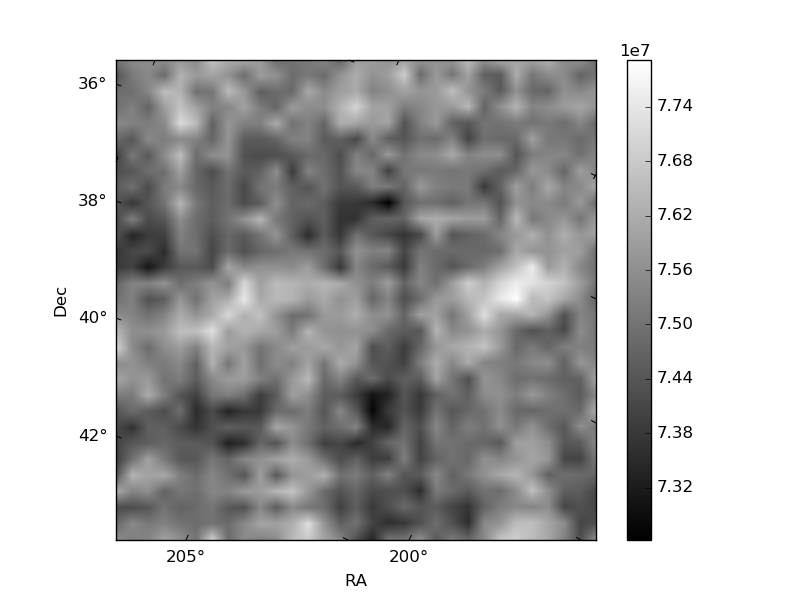
Quadrant B |
|---|---|---|---|
| Quadrant D | 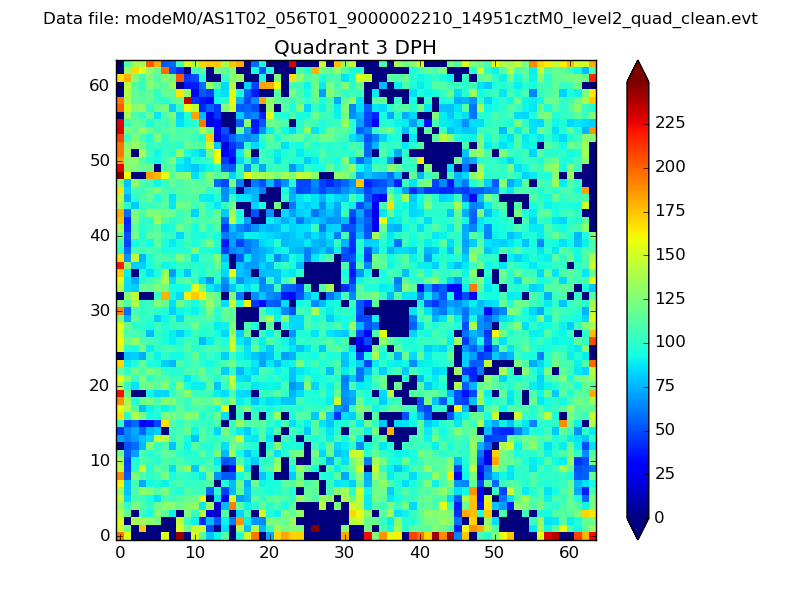 |
 |
Quadrant C |
| Plot type | Count rate plots | Images |
|---|---|---|
| Comparison with Poisson distribution Blue bars denote a histogram of data divided into 1 sec bins. Red curve is a Poisson curve with rate = median count rate of data. |
 |
 |
| Quadrant-wise count rates Data is divided into 100 sec bins |
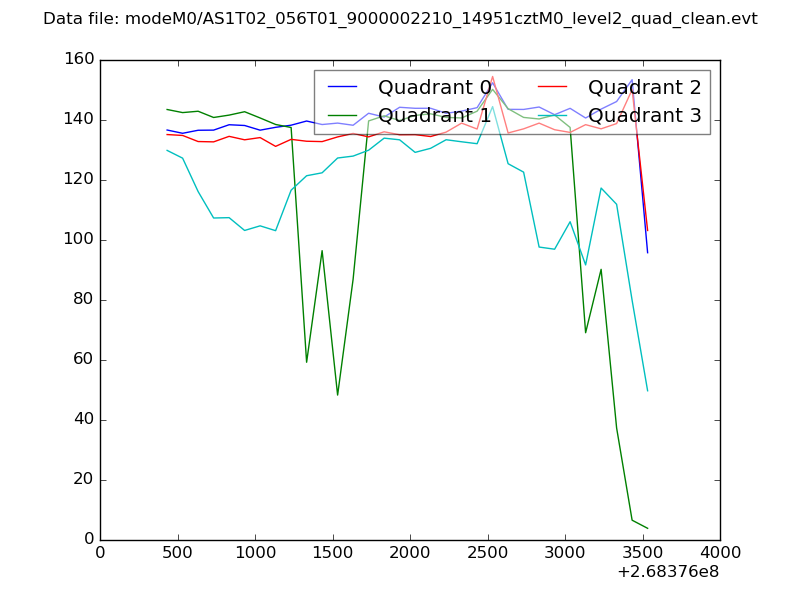 |
|
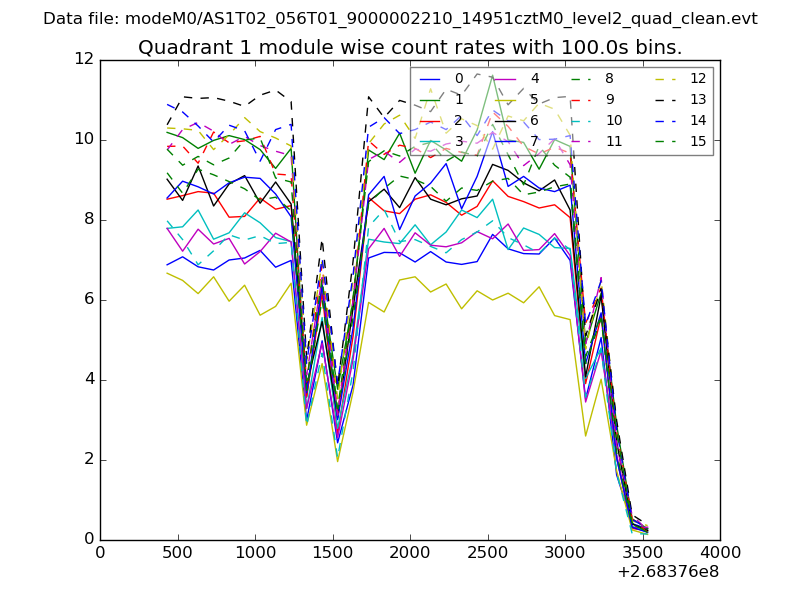
| Module-wise count rates for Quadrant A Data is divided into 100 sec bins |
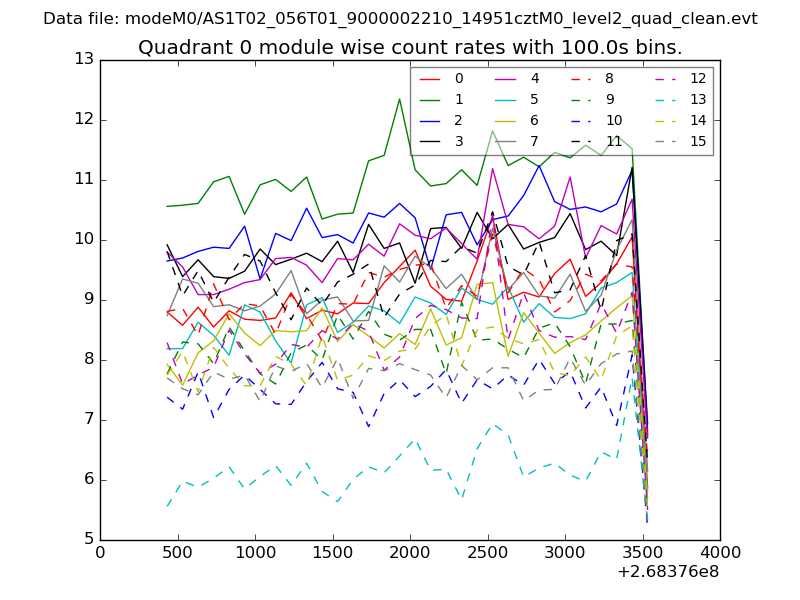 |
 |
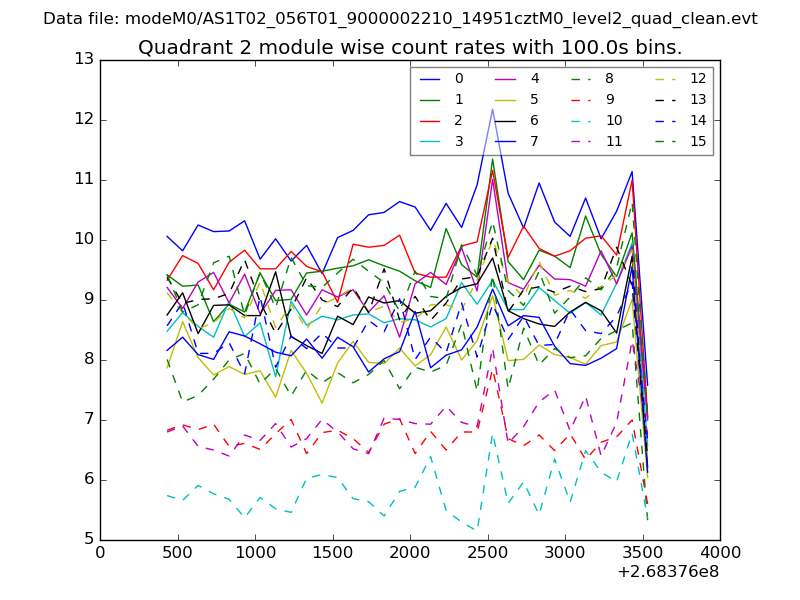
| Module-wise count rates for Quadrant B Data is divided into 100 sec bins |
 |
 |
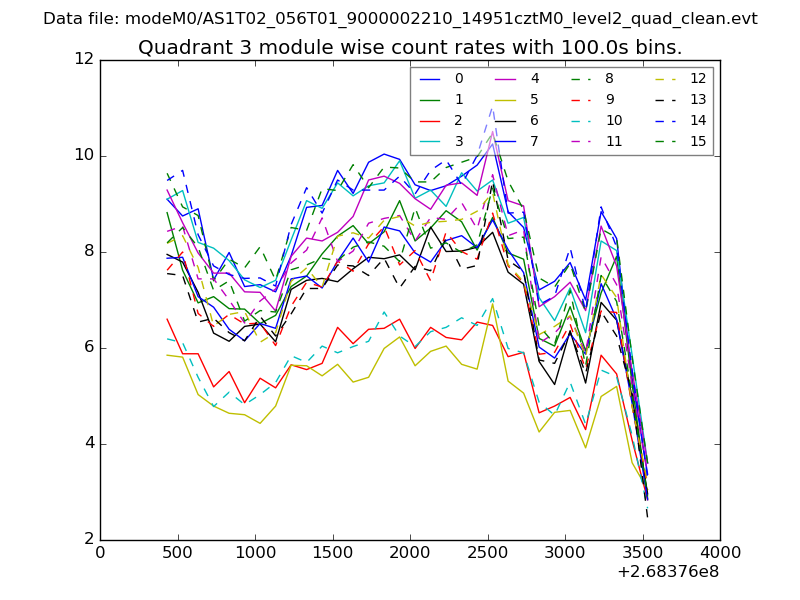
| Module-wise count rates for Quadrant C Data is divided into 100 sec bins |
 |
 |
| Module-wise count rates for Quadrant D Data is divided into 100 sec bins |
 |
 |
| Parameter | Plot |
|---|---|
| CZT HV Monitor | 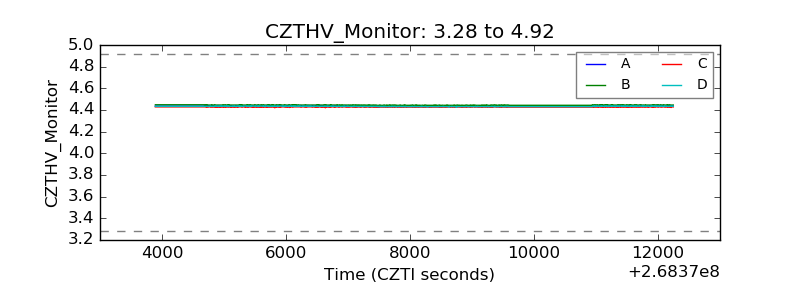 |
| D_VDD | 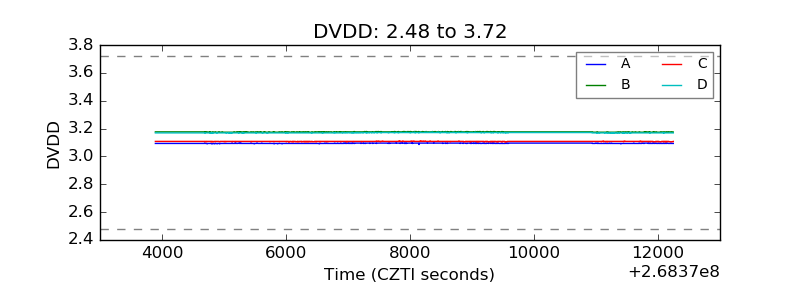 |
| Temperature 1 |  |
| Veto HV Monitor | 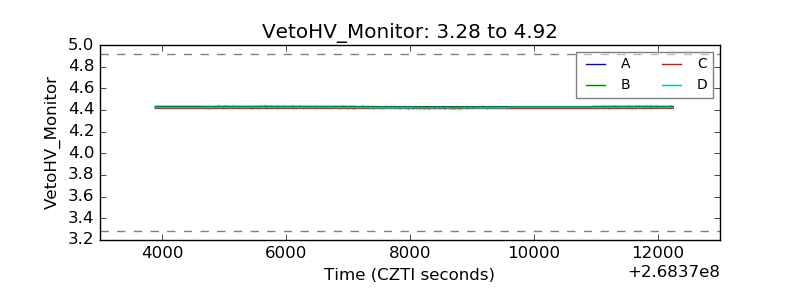 |
| Veto LLD | 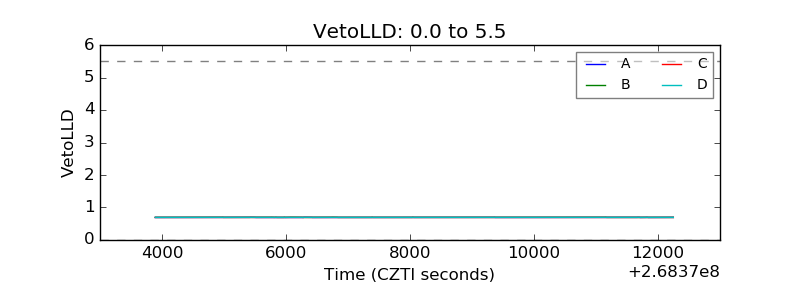 |
| Alpha Counter | 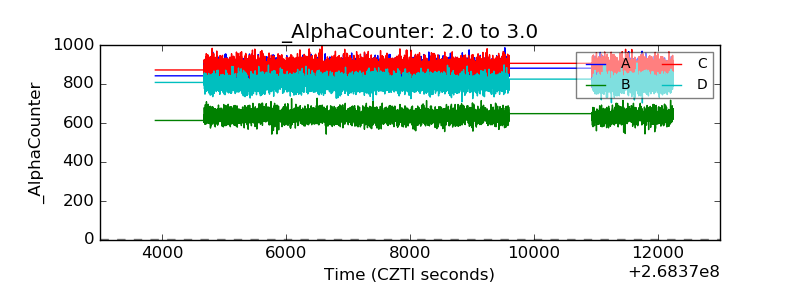 |
| _CPM_Rate | 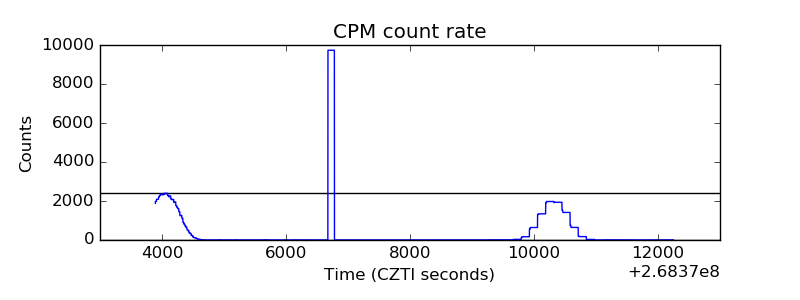 |
| CZT Counter | 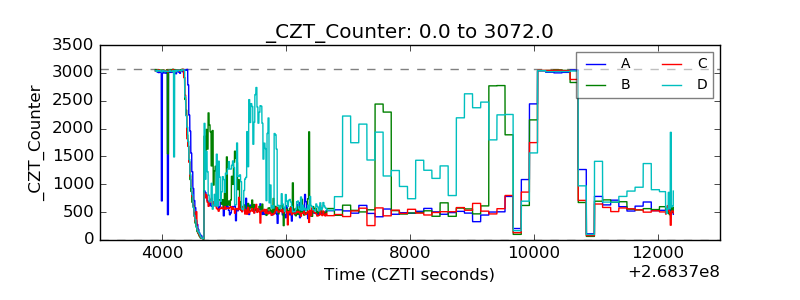 |
| +2.5 Volts monitor |  |
| +5 Volts monitor |  |
| _ROLL_ROT | 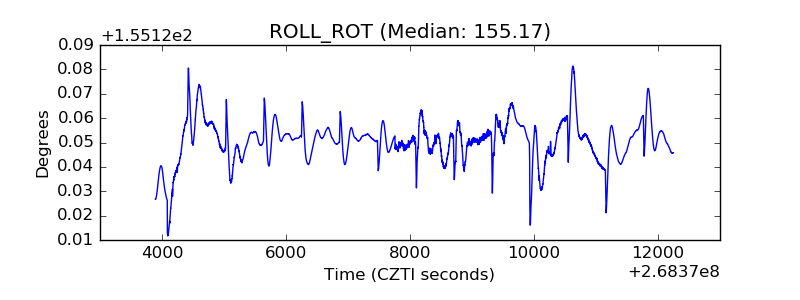 |
| _Roll_DEC | 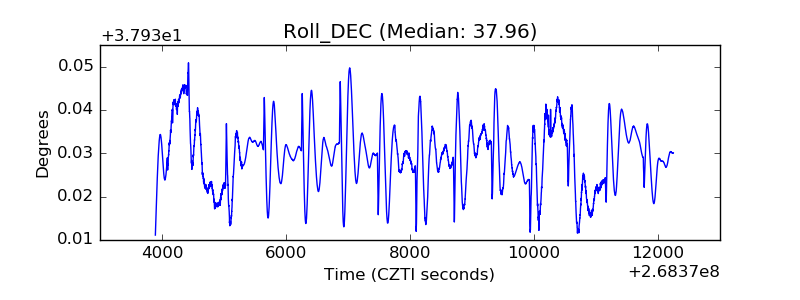 |
| _Roll_RA | 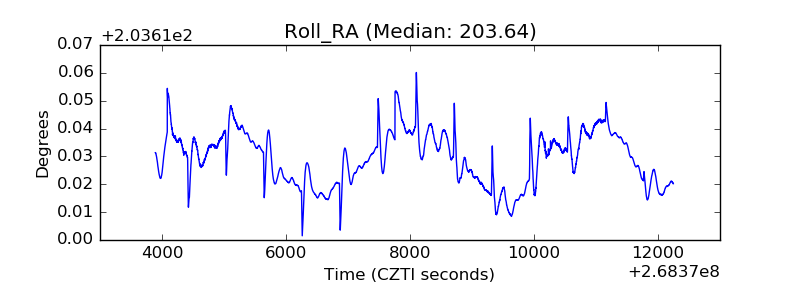 |
| Veto Counter | 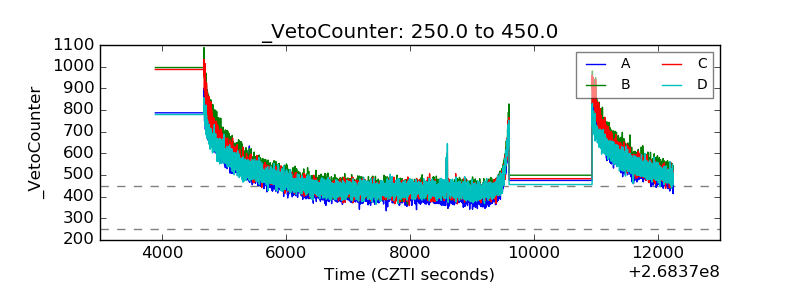 |