| Param | Original file | Final file |
|---|---|---|
| Filename | modeM0/AS1T02_056T01_9000002210_14952cztM0_level2.evt | modeM0/AS1T02_056T01_9000002210_14952cztM0_level2_quad_clean.evt |
| Size (bytes) | 595,477,440 | 85,579,200 |
| Size | 567.9 MB | 81.6 MB |
| Events in quadrant A | 3,402,294 | 563,829 |
| Events in quadrant B | 3,493,514 | 563,324 |
| Events in quadrant C | 3,268,903 | 543,073 |
| Events in quadrant D | 7,450,294 | 488,540 |
| Mode M0 | |||
|---|---|---|---|
| Quadrant | BADHDUFLAG | Total packets | Discarded packets |
| A | 0 | 13774 | 3 |
| B | 0 | 14055 | 2 |
| C | 0 | 13267 | 2 |
| D | 0 | 26452 | 2 |
| Mode M9 | |||
|---|---|---|---|
| Quadrant | BADHDUFLAG | Total packets | Discarded packets |
| A | 0 | 22 | 0 |
| B | 0 | 22 | 0 |
| C | 0 | 22 | 0 |
| D | 0 | 23 | 0 |
| Mode SS | |||
|---|---|---|---|
| Quadrant | BADHDUFLAG | Total packets | Discarded packets |
| A | 0 | 126 | 0 |
| B | 0 | 126 | 0 |
| C | 0 | 126 | 0 |
| D | 0 | 126 | 0 |
| Quadrant | Total seconds | Saturated seconds | Saturation percentage |
|---|---|---|---|
| A | 6197 | 86 | 1.387768% |
| B | 6197 | 102 | 1.645958% |
| C | 6197 | 49 | 0.790705% |
| D | 6197 | 846 | 13.651767% |
Noise dominated data is calculated using 1-second bins in cleaned event files. If a bin has >2000 counts, and if more than 50% of those come from <1% of pixels, then it is considered to be noise-dominated and hence unusable.
| Quadrant | # 1 sec bins | Bins with >0 counts | Bins with >2000 counts | High rate bins dominated by noise | Noise dominated (total time) | Noise dominated (detector-on time) | Marked lightcurve |
|---|---|---|---|---|---|---|---|
| A | 7528 | 6199 | 1 | 1 | 0.01% | 0.02% | 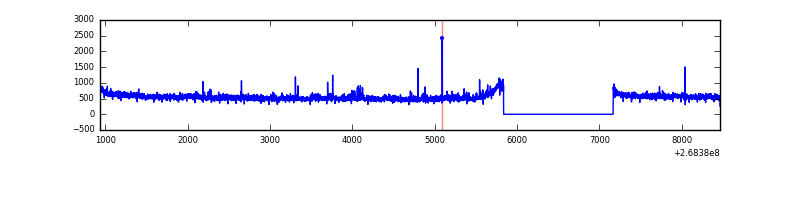 |
| B | 7528 | 6199 | 1 | 1 | 0.01% | 0.02% | 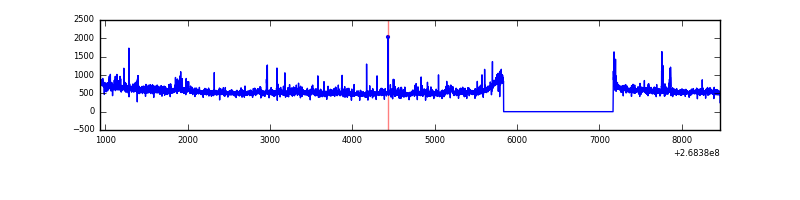 |
| C | 7528 | 6199 | 0 | 0 | 0.00% | 0.00% | 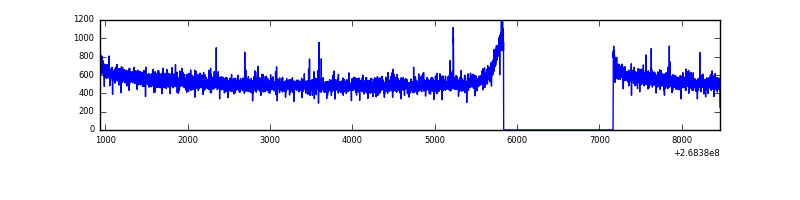 |
| D | 7527 | 6197 | 813 | 813 | 10.80% | 13.12% | 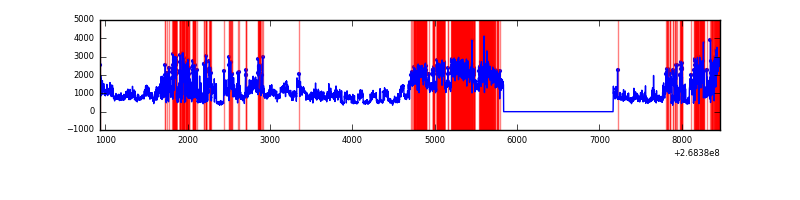 |
Top three noisy pixels from each quadrant. If the there are fewer than three noisy pixels in the level2.evt file, extra rows are filled as -1
| Pixel properties | Quadrant properties | ||||||
|---|---|---|---|---|---|---|---|
| Quadrant | DetID | PixID | Counts | Sigma | Mean | Median | Sigma |
| A | 12 | 189 | 67494 | 390.96 | 851 | 834 | 170.5 |
| A | 9 | 143 | 16595 | 92.44 | 851 | 834 | 170.5 |
| A | 1 | 162 | 15543 | 86.27 | 851 | 834 | 170.5 |
| B | 0 | 219 | 44322 | 278.16 | 840 | 823 | 156.4 |
| B | 3 | 64 | 42830 | 268.62 | 840 | 823 | 156.4 |
| B | 0 | 205 | 28604 | 177.65 | 840 | 823 | 156.4 |
| C | 3 | 233 | 132118 | 717.1 | 802 | 809 | 183.1 |
| C | 10 | 22 | 7416 | 36.08 | 802 | 809 | 183.1 |
| C | 13 | 61 | 5809 | 27.31 | 802 | 809 | 183.1 |
| D | 7 | 254 | 4176643 | 22630.57 | 779 | 761 | 184.5 |
| D | 12 | 110 | 199419 | 1076.6 | 779 | 761 | 184.5 |
| D | 13 | 249 | 43756 | 233.0 | 779 | 761 | 184.5 |
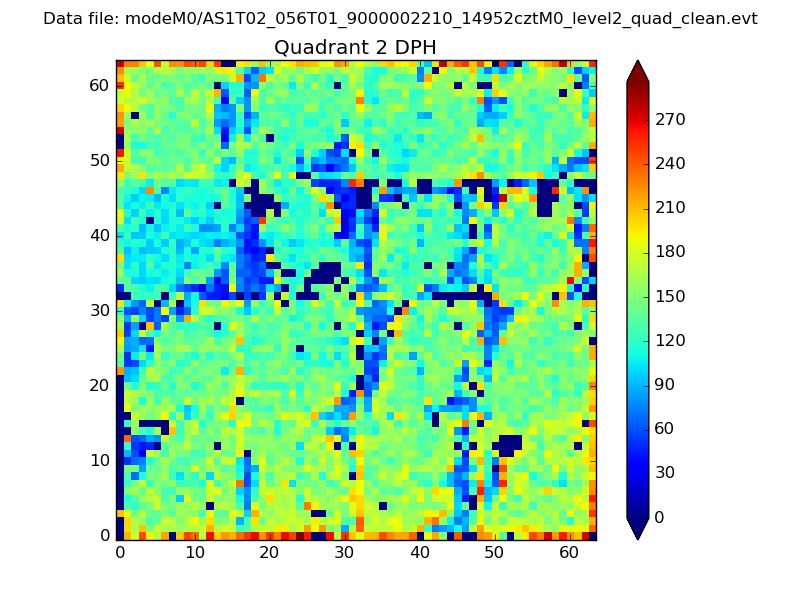
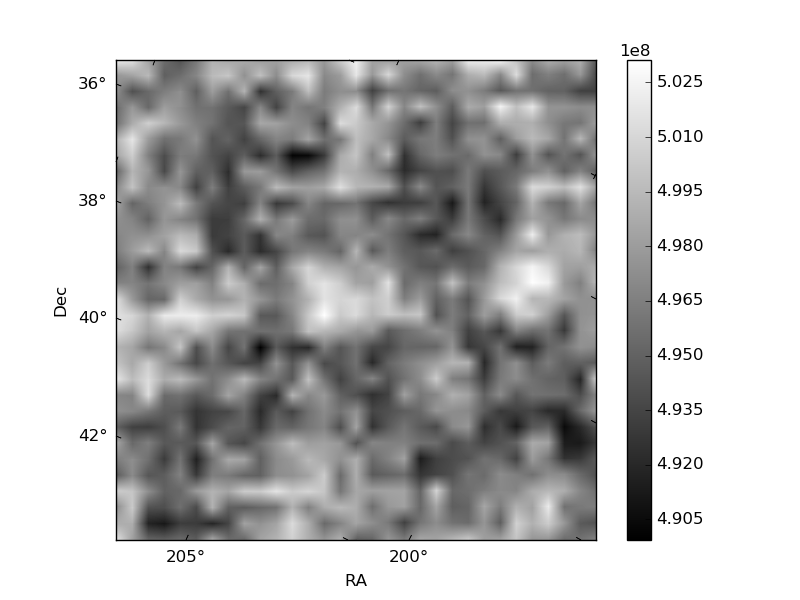
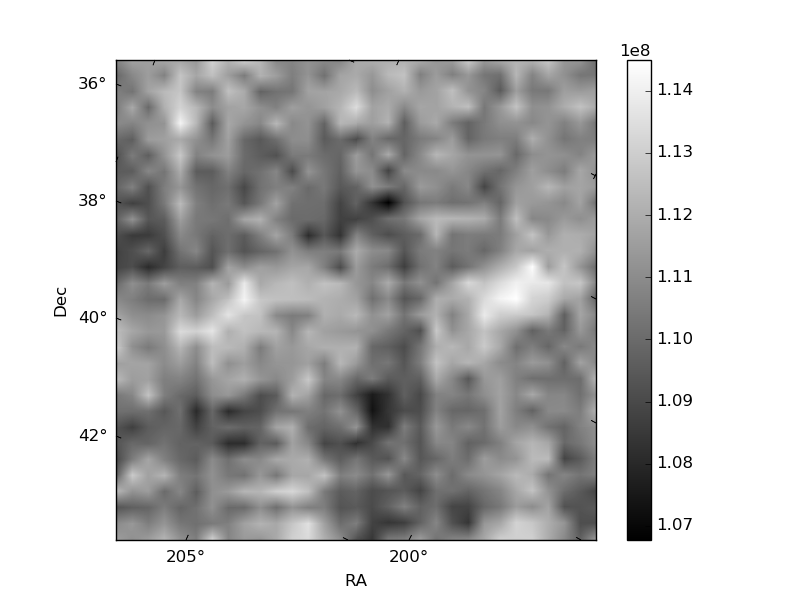
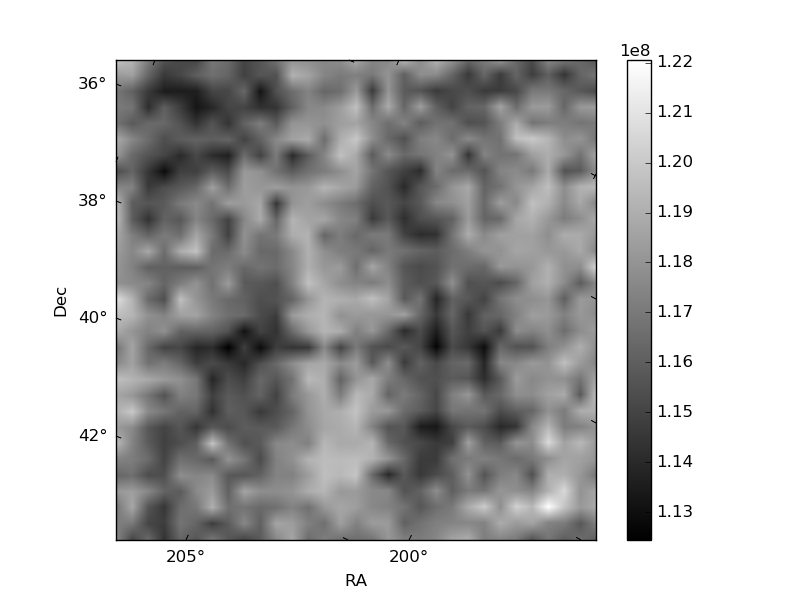
Histogram calculated using DETX and DETY for each event in the final _common_clean file
| Quadrant A | 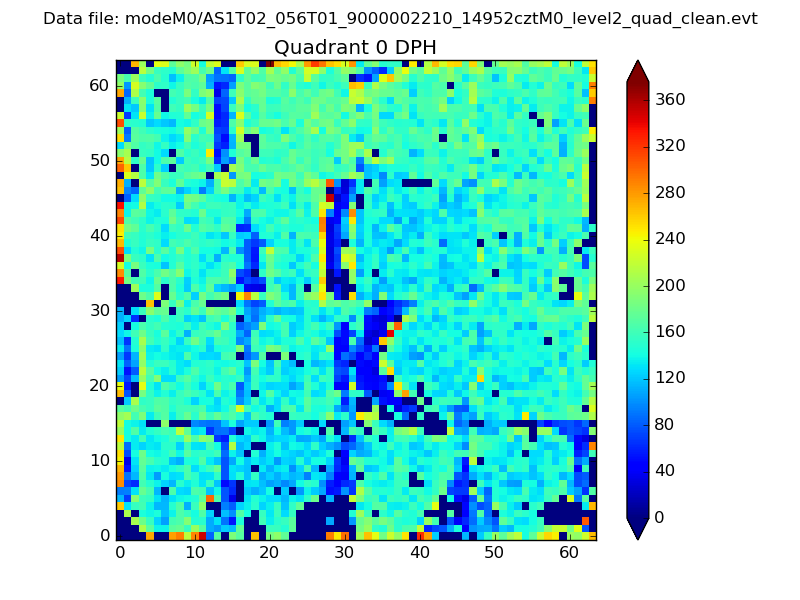 |
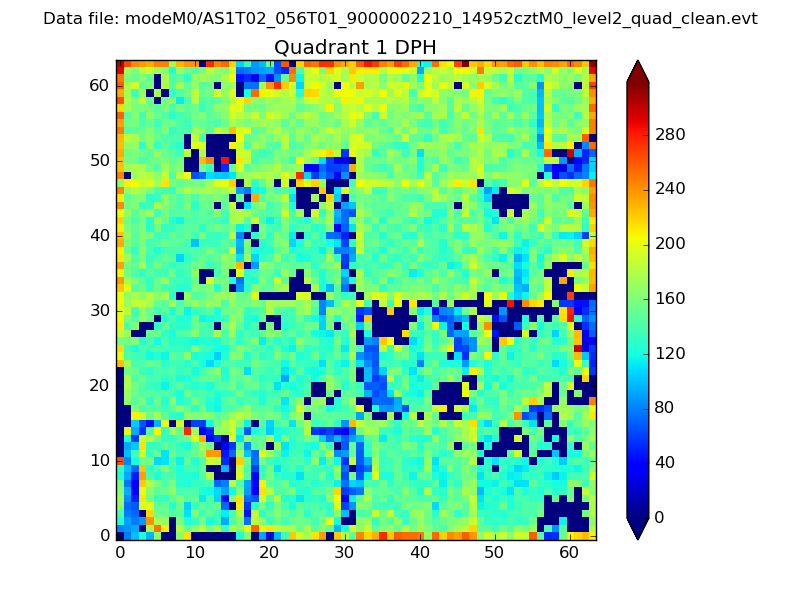 |
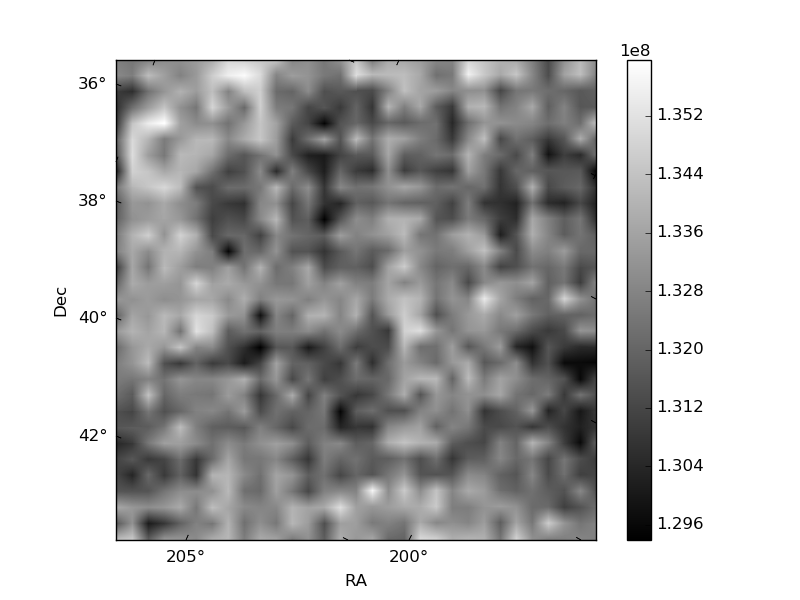
Quadrant B |
|---|---|---|---|
| Quadrant D | 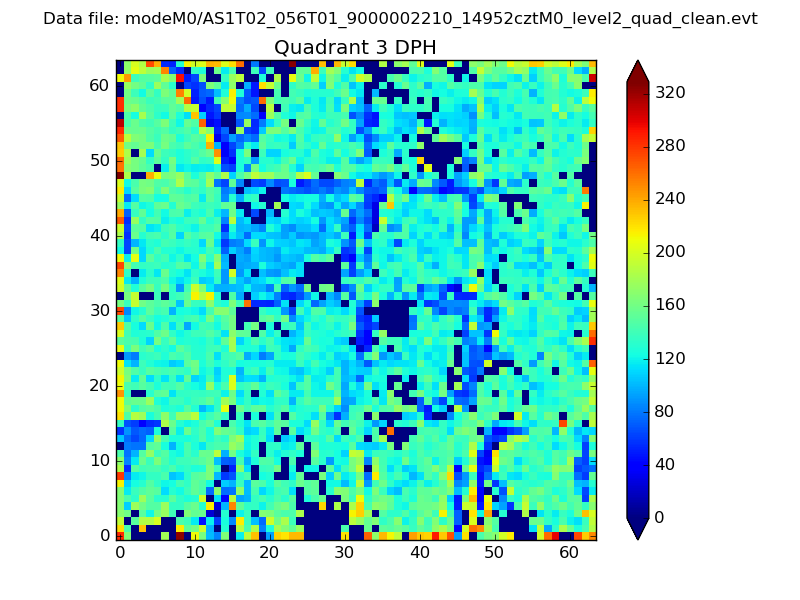 |
 |
Quadrant C |
| Plot type | Count rate plots | Images |
|---|---|---|
| Comparison with Poisson distribution Blue bars denote a histogram of data divided into 1 sec bins. Red curve is a Poisson curve with rate = median count rate of data. |
 |
 |
| Quadrant-wise count rates Data is divided into 100 sec bins |
 |
|
| Module-wise count rates for Quadrant A Data is divided into 100 sec bins |
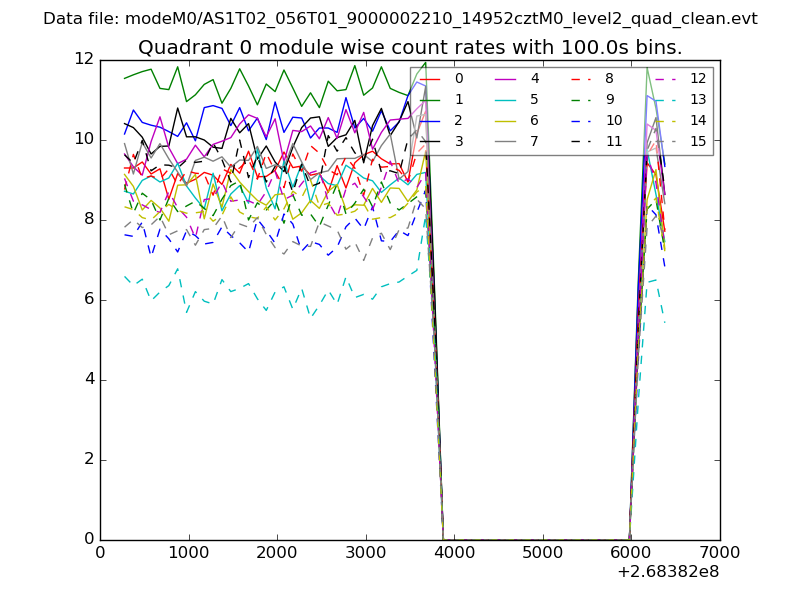 |
 |
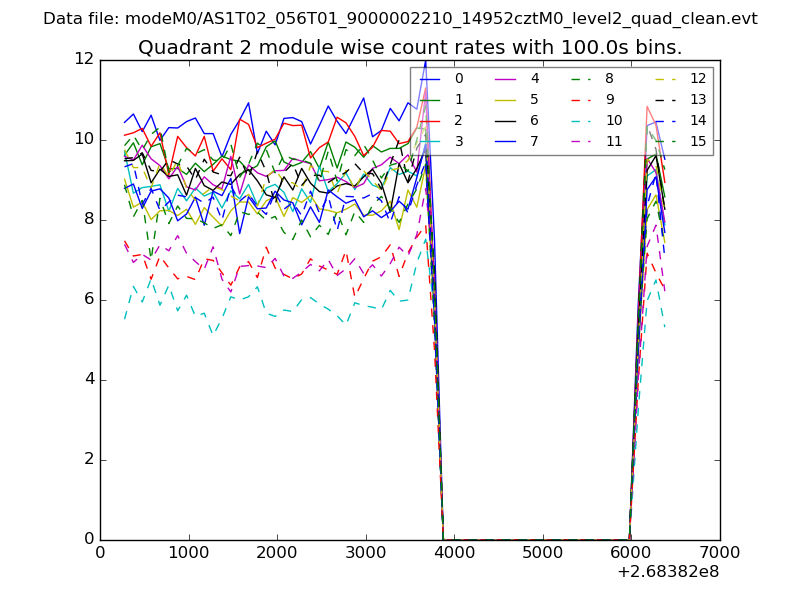
| Module-wise count rates for Quadrant B Data is divided into 100 sec bins |
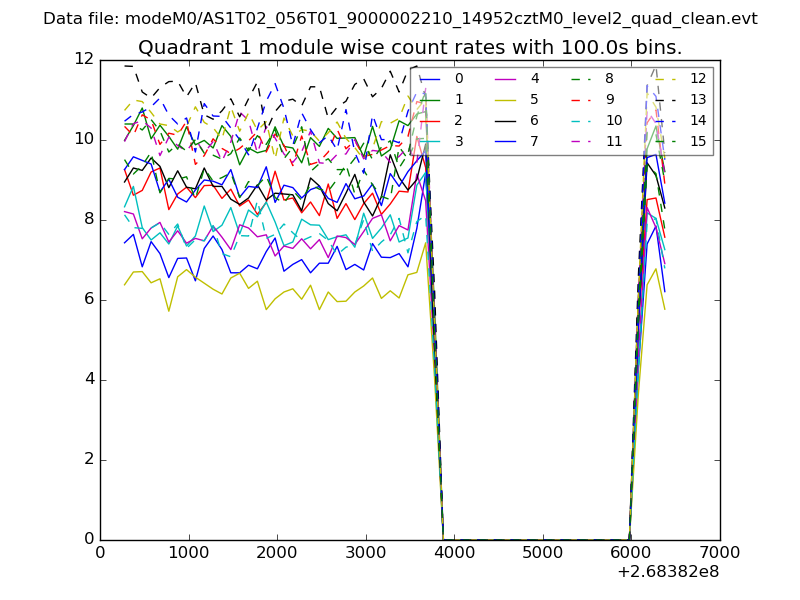 |
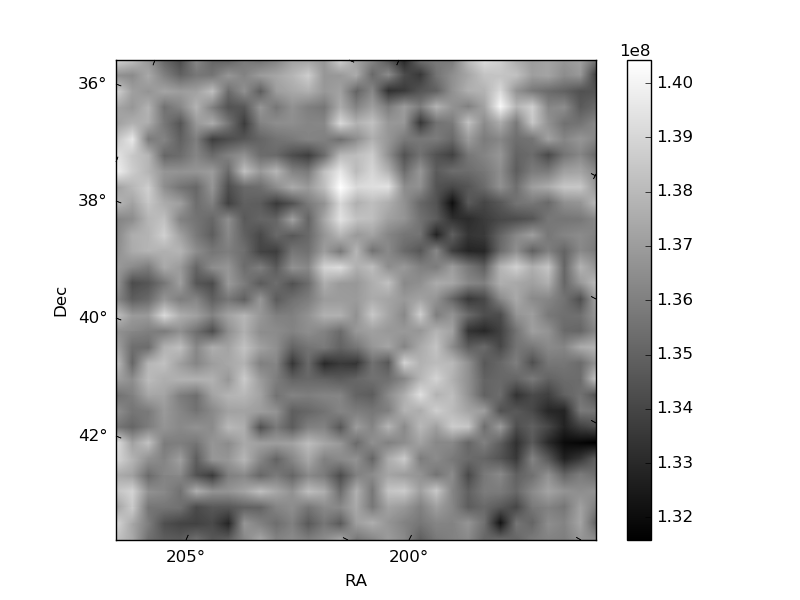 |
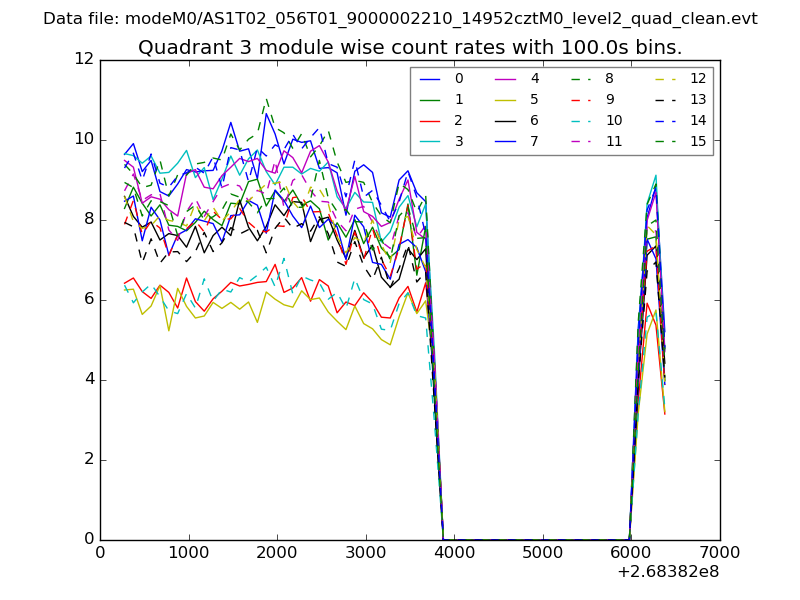
| Module-wise count rates for Quadrant C Data is divided into 100 sec bins |
 |
 |
| Module-wise count rates for Quadrant D Data is divided into 100 sec bins |
 |
 |
| Parameter | Plot |
|---|---|
| CZT HV Monitor | 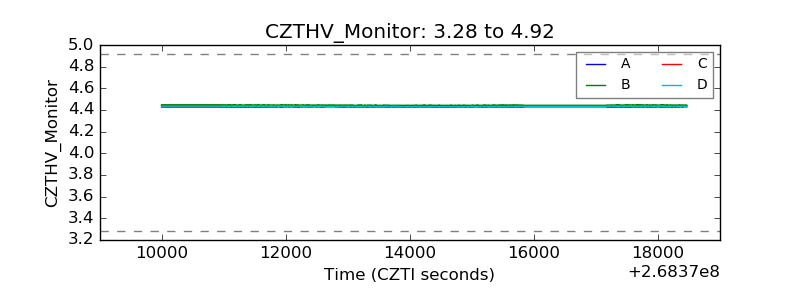 |
| D_VDD | 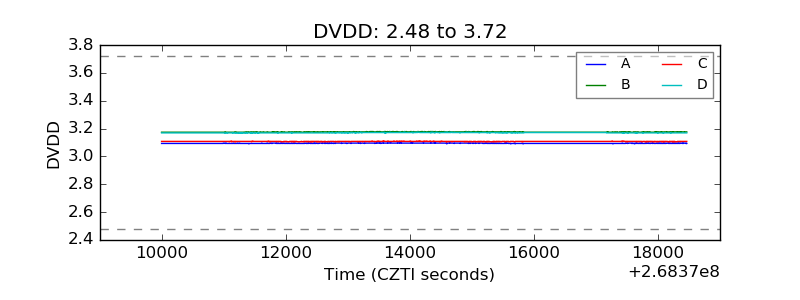 |
| Temperature 1 | 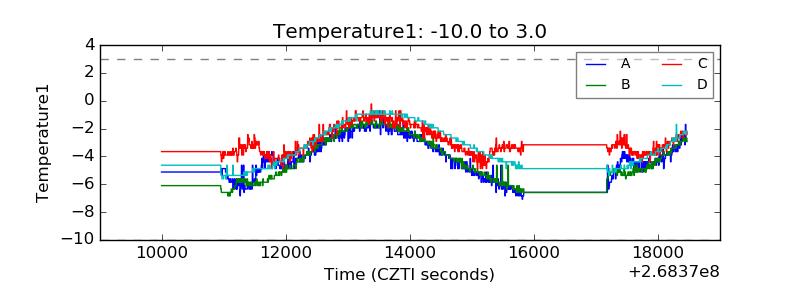 |
| Veto HV Monitor | 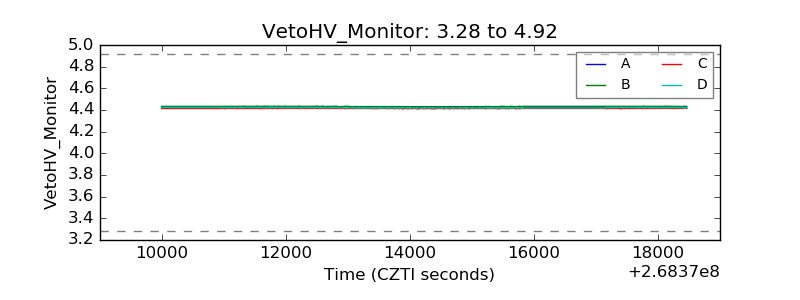 |
| Veto LLD | 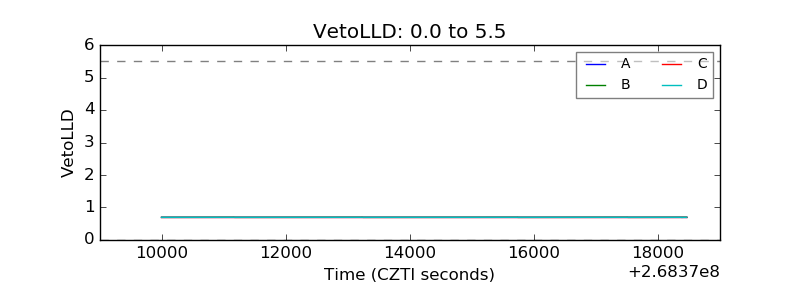 |
| Alpha Counter |  |
| _CPM_Rate |  |
| CZT Counter | 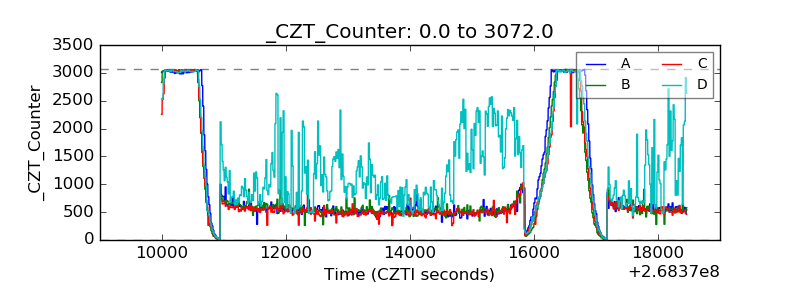 |
| +2.5 Volts monitor |  |
| +5 Volts monitor |  |
| _ROLL_ROT | 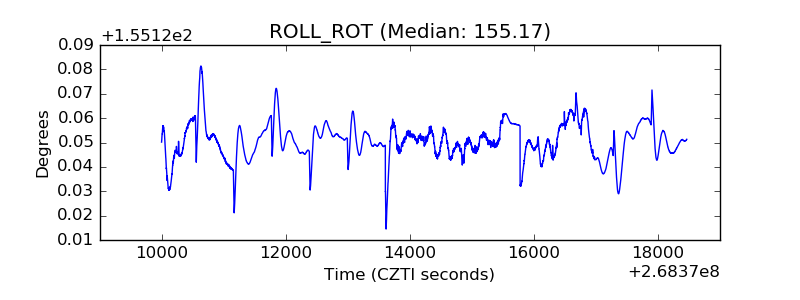 |
| _Roll_DEC | 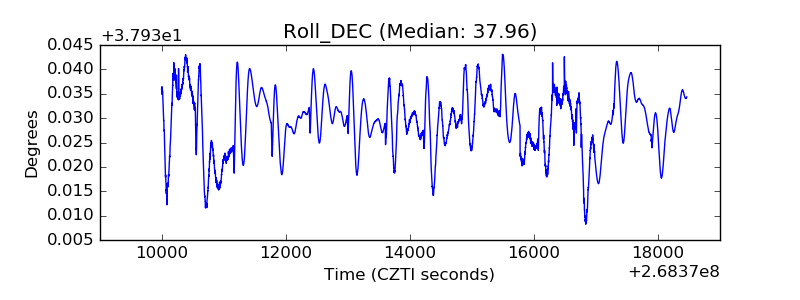 |
| _Roll_RA | 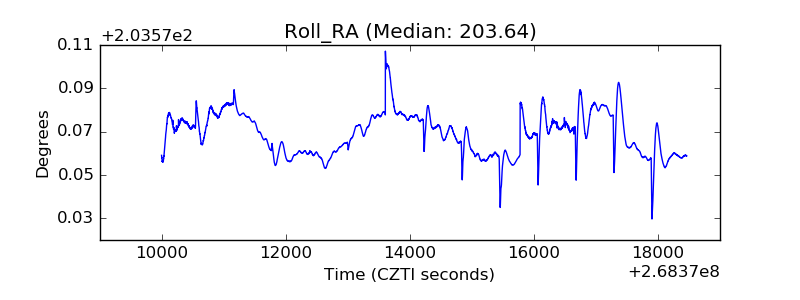 |
| Veto Counter | 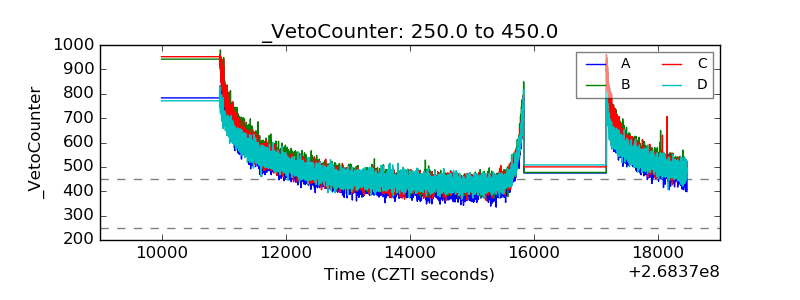 |