| Param | Original file | Final file |
|---|---|---|
| Filename | modeM0/AS1T02_056T01_9000002210_14953cztM0_level2.evt | modeM0/AS1T02_056T01_9000002210_14953cztM0_level2_quad_clean.evt |
| Size (bytes) | 606,245,760 | 94,783,680 |
| Size | 578.2 MB | 90.4 MB |
| Events in quadrant A | 3,423,964 | 633,613 |
| Events in quadrant B | 3,436,633 | 632,651 |
| Events in quadrant C | 3,298,590 | 608,253 |
| Events in quadrant D | 7,771,077 | 552,408 |
| Mode M0 | |||
|---|---|---|---|
| Quadrant | BADHDUFLAG | Total packets | Discarded packets |
| A | 0 | 13855 | 3 |
| B | 0 | 13916 | 2 |
| C | 0 | 13454 | 2 |
| D | 0 | 27597 | 2 |
| Mode M9 | |||
|---|---|---|---|
| Quadrant | BADHDUFLAG | Total packets | Discarded packets |
| A | 0 | 18 | 0 |
| B | 0 | 18 | 0 |
| C | 0 | 18 | 0 |
| D | 0 | 19 | 0 |
| Mode SS | |||
|---|---|---|---|
| Quadrant | BADHDUFLAG | Total packets | Discarded packets |
| A | 0 | 130 | 0 |
| B | 0 | 130 | 0 |
| C | 0 | 130 | 0 |
| D | 0 | 130 | 0 |
| Quadrant | Total seconds | Saturated seconds | Saturation percentage |
|---|---|---|---|
| A | 6349 | 141 | 2.220822% |
| B | 6349 | 146 | 2.299575% |
| C | 6349 | 91 | 1.433297% |
| D | 6349 | 1035 | 16.301780% |
Noise dominated data is calculated using 1-second bins in cleaned event files. If a bin has >2000 counts, and if more than 50% of those come from <1% of pixels, then it is considered to be noise-dominated and hence unusable.
| Quadrant | # 1 sec bins | Bins with >0 counts | Bins with >2000 counts | High rate bins dominated by noise | Noise dominated (total time) | Noise dominated (detector-on time) | Marked lightcurve |
|---|---|---|---|---|---|---|---|
| A | 7560 | 6350 | 0 | 0 | 0.00% | 0.00% | 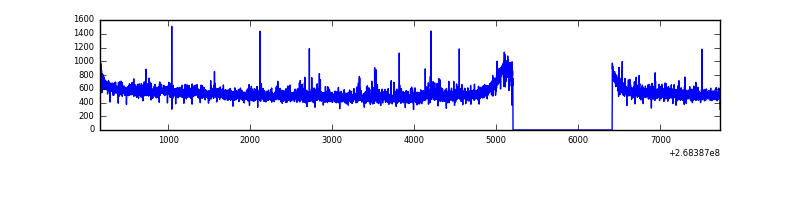 |
| B | 7560 | 6350 | 1 | 1 | 0.01% | 0.02% | 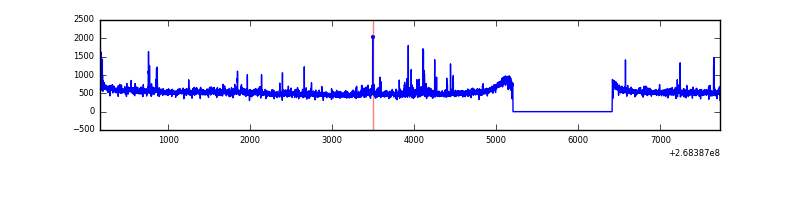 |
| C | 7560 | 6351 | 0 | 0 | 0.00% | 0.00% | 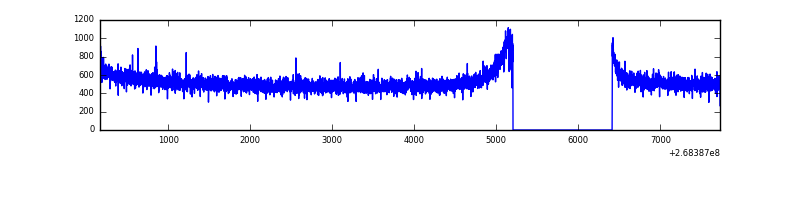 |
| D | 7560 | 6350 | 833 | 833 | 11.02% | 13.12% | 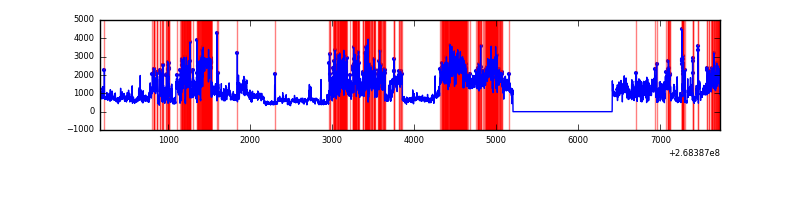 |
Top three noisy pixels from each quadrant. If the there are fewer than three noisy pixels in the level2.evt file, extra rows are filled as -1
| Pixel properties | Quadrant properties | ||||||
|---|---|---|---|---|---|---|---|
| Quadrant | DetID | PixID | Counts | Sigma | Mean | Median | Sigma |
| A | 12 | 189 | 52708 | 302.57 | 850 | 833 | 171.4 |
| A | 1 | 162 | 30649 | 173.91 | 850 | 833 | 171.4 |
| A | 3 | 1 | 23455 | 131.95 | 850 | 833 | 171.4 |
| B | 10 | 16 | 33438 | 208.32 | 836 | 819 | 156.6 |
| B | 0 | 189 | 27443 | 170.03 | 836 | 819 | 156.6 |
| B | 0 | 205 | 24738 | 152.76 | 836 | 819 | 156.6 |
| C | 3 | 233 | 152038 | 817.38 | 805 | 811 | 185.0 |
| C | 7 | 247 | 10261 | 51.08 | 805 | 811 | 185.0 |
| C | 13 | 61 | 5790 | 26.91 | 805 | 811 | 185.0 |
| D | 7 | 254 | 3934911 | 21527.7 | 772 | 754 | 182.7 |
| D | 13 | 172 | 512611 | 2800.88 | 772 | 754 | 182.7 |
| D | 13 | 249 | 249624 | 1361.82 | 772 | 754 | 182.7 |
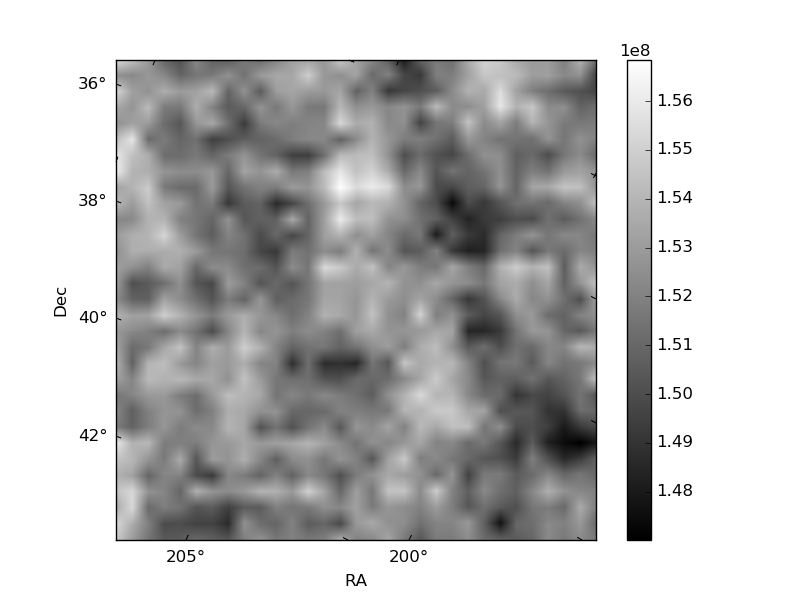
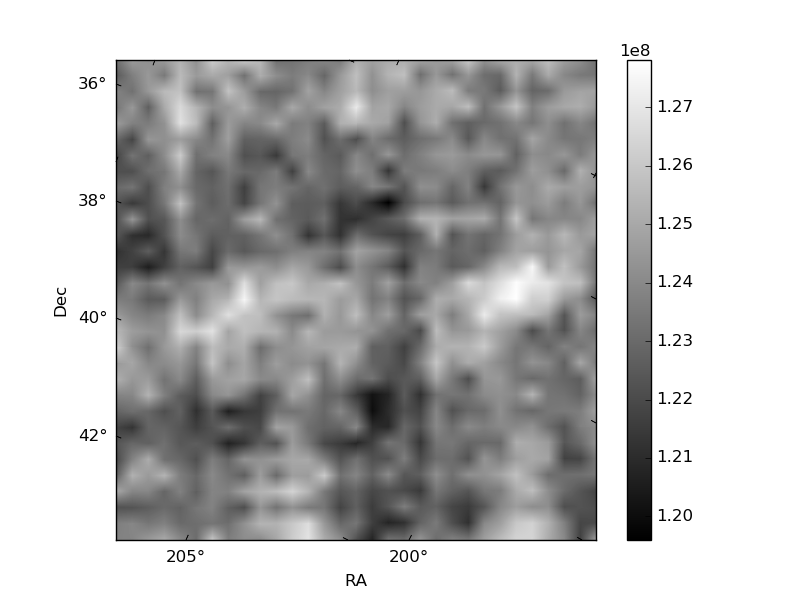
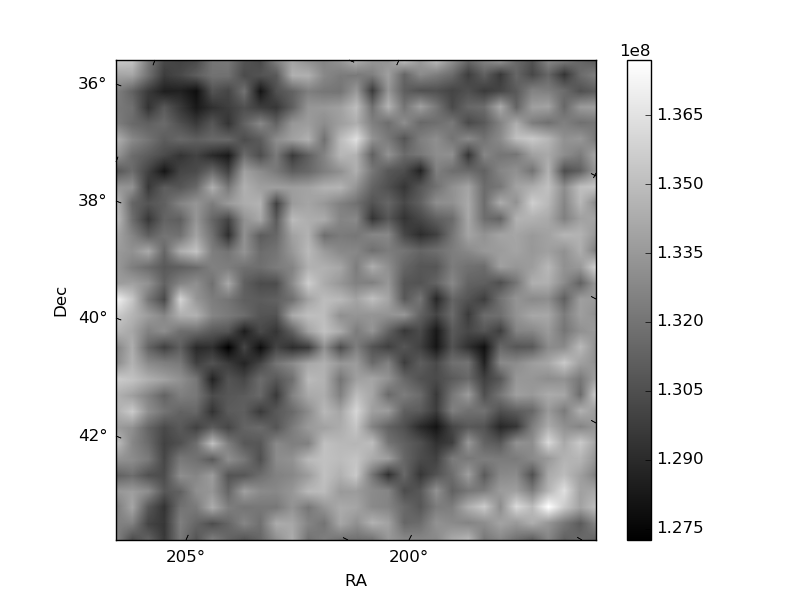
Histogram calculated using DETX and DETY for each event in the final _common_clean file
| Quadrant A | 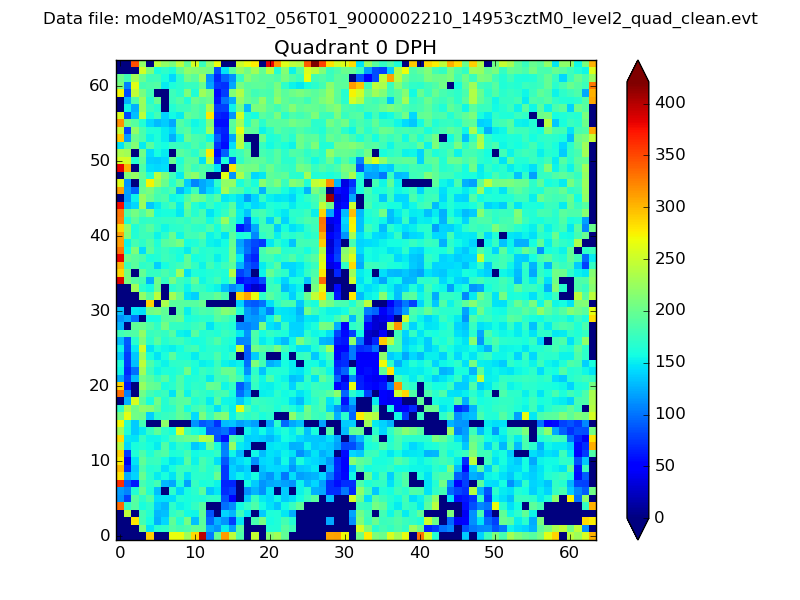 |
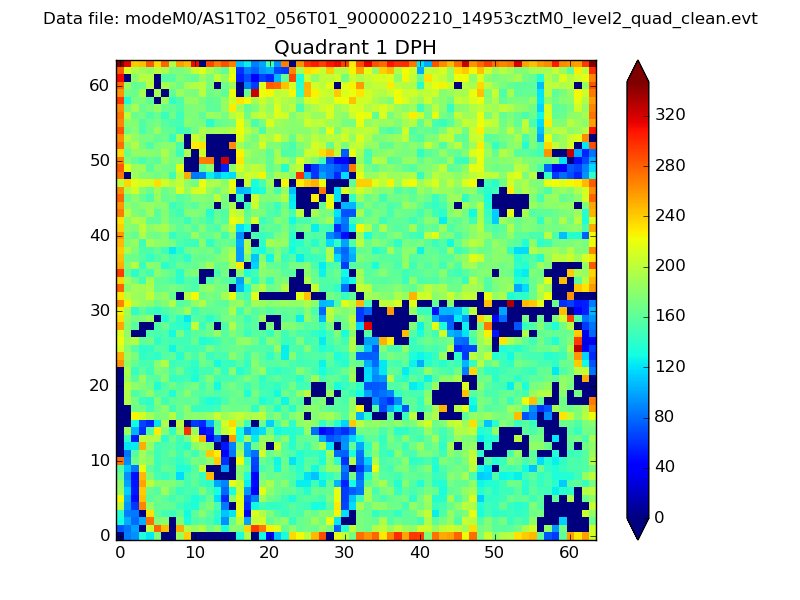 |
Quadrant B |
|---|---|---|---|
| Quadrant D |  |
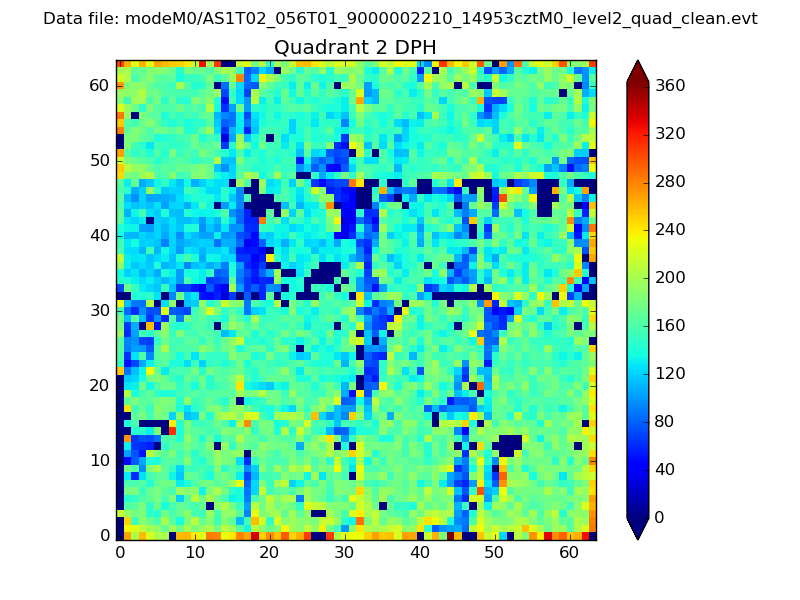 |
Quadrant C |
| Plot type | Count rate plots | Images |
|---|---|---|
| Comparison with Poisson distribution Blue bars denote a histogram of data divided into 1 sec bins. Red curve is a Poisson curve with rate = median count rate of data. |
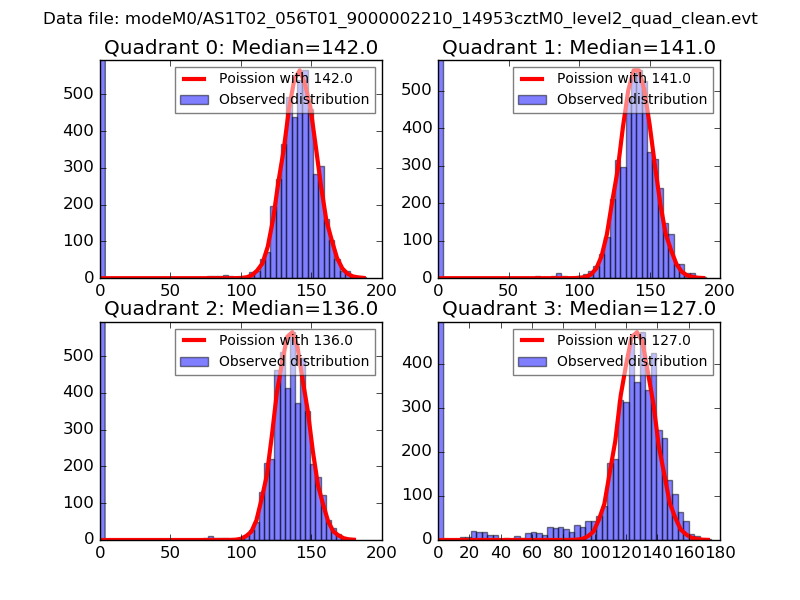 |
 |
| Quadrant-wise count rates Data is divided into 100 sec bins |
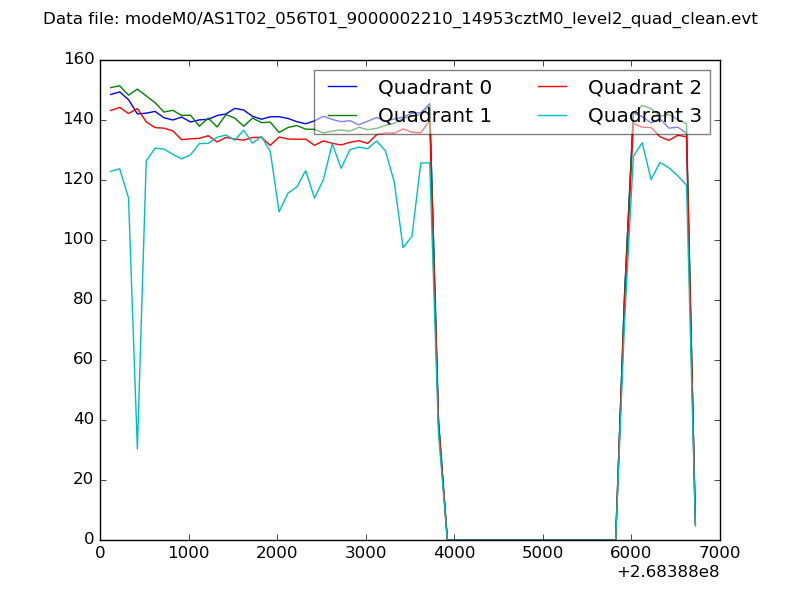 |
|
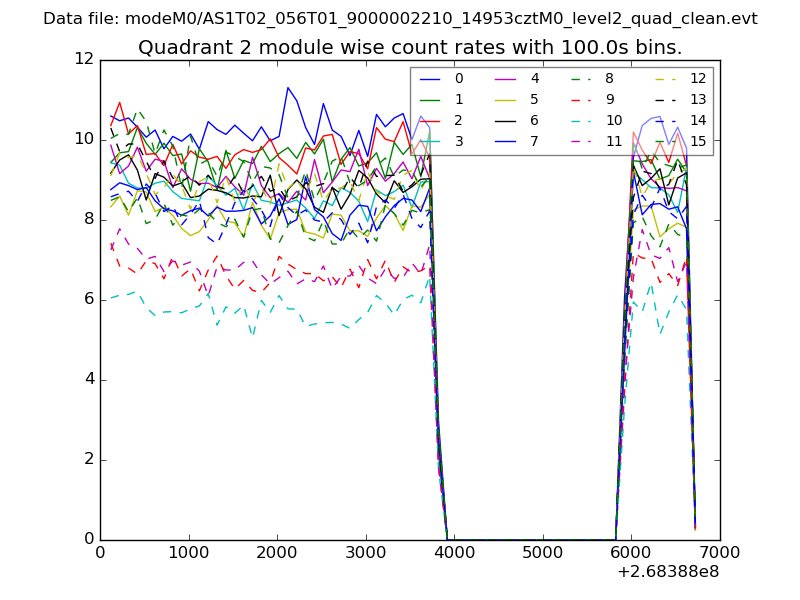
| Module-wise count rates for Quadrant A Data is divided into 100 sec bins |
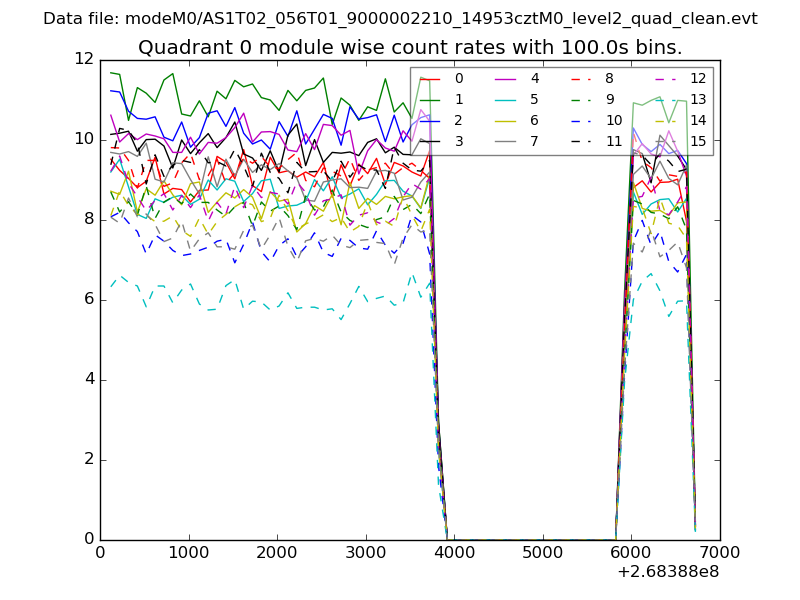 |
 |
| Module-wise count rates for Quadrant B Data is divided into 100 sec bins |
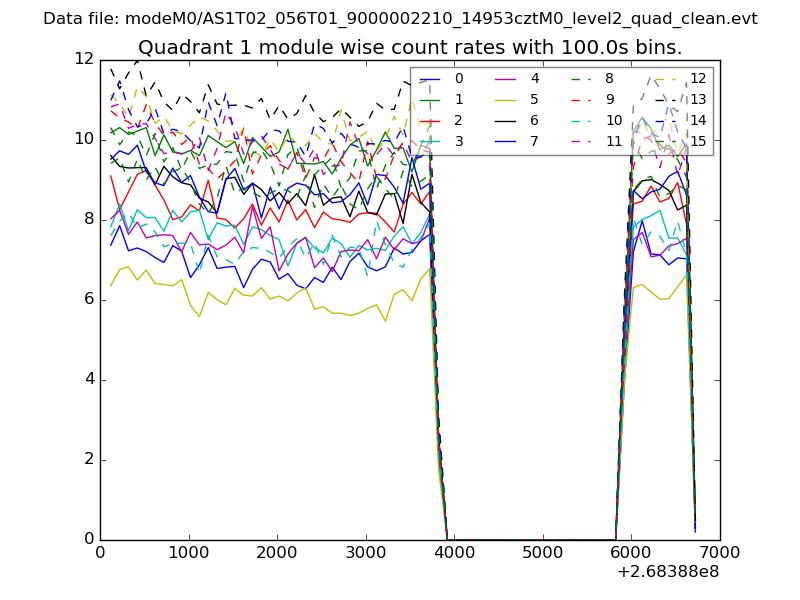 |
 |
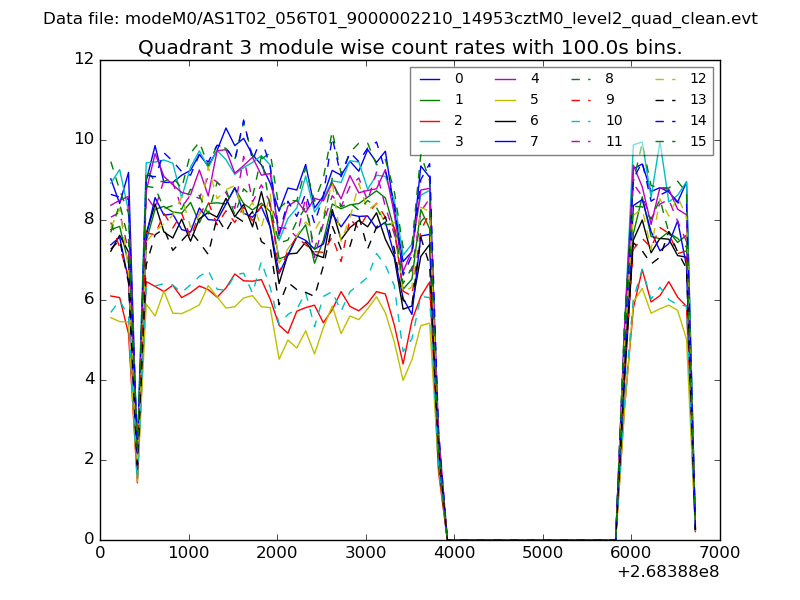
| Module-wise count rates for Quadrant C Data is divided into 100 sec bins |
 |
 |
| Module-wise count rates for Quadrant D Data is divided into 100 sec bins |
 |
 |
| Parameter | Plot |
|---|---|
| CZT HV Monitor | 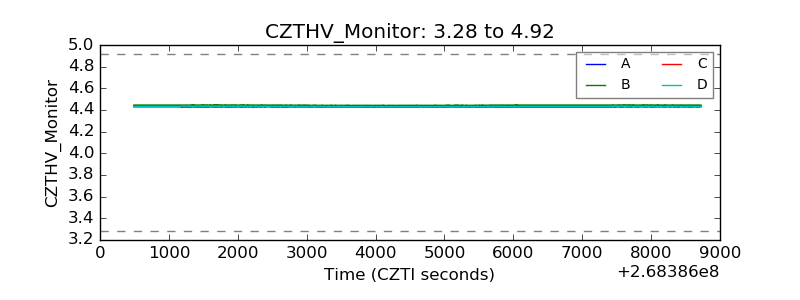 |
| D_VDD | 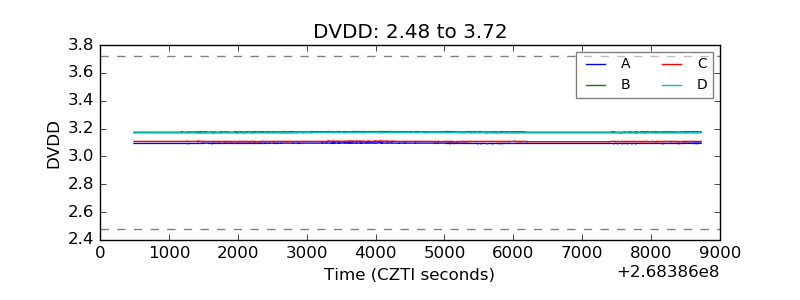 |
| Temperature 1 | 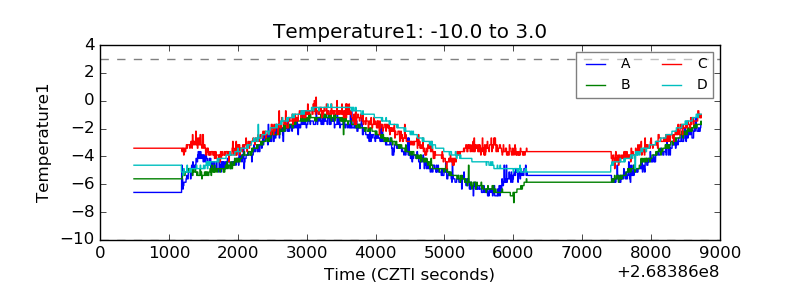 |
| Veto HV Monitor |  |
| Veto LLD | 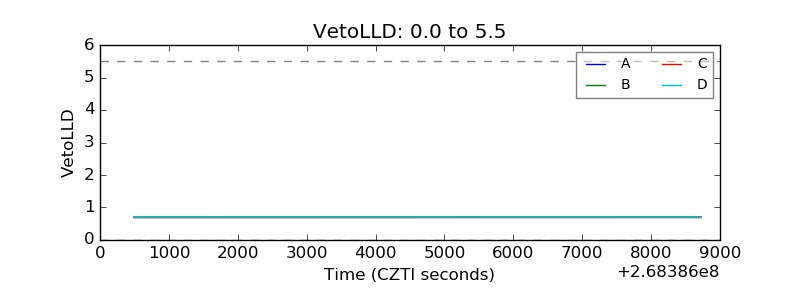 |
| Alpha Counter | 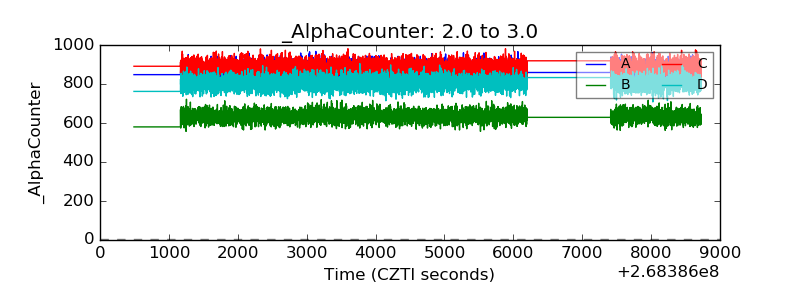 |
| _CPM_Rate | 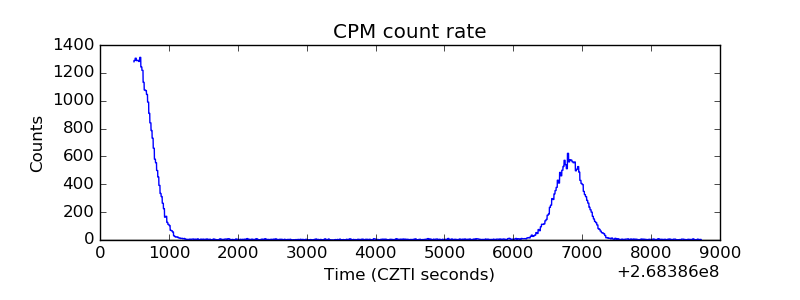 |
| CZT Counter | 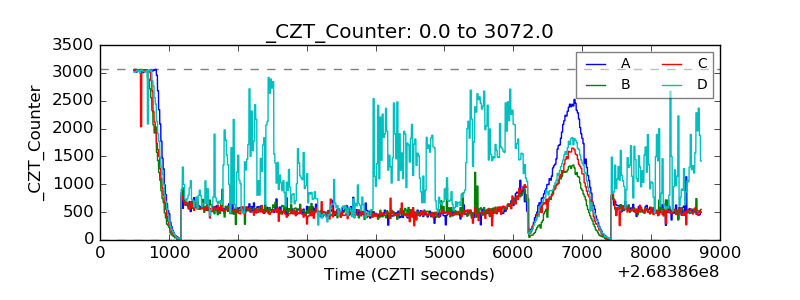 |
| +2.5 Volts monitor |  |
| +5 Volts monitor |  |
| _ROLL_ROT | 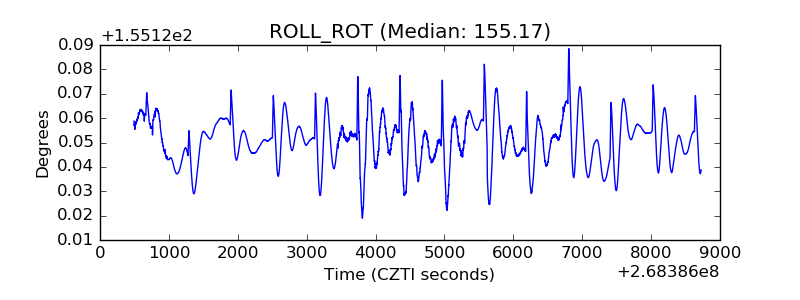 |
| _Roll_DEC | 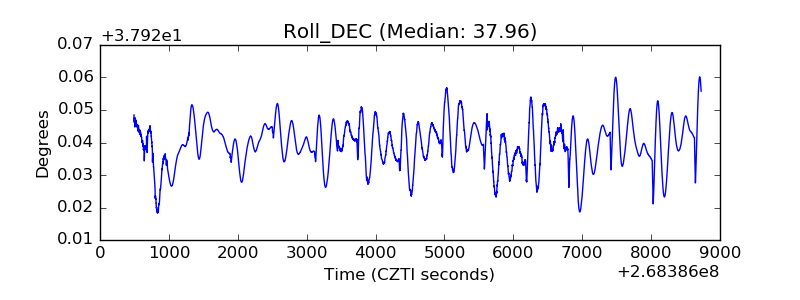 |
| _Roll_RA | 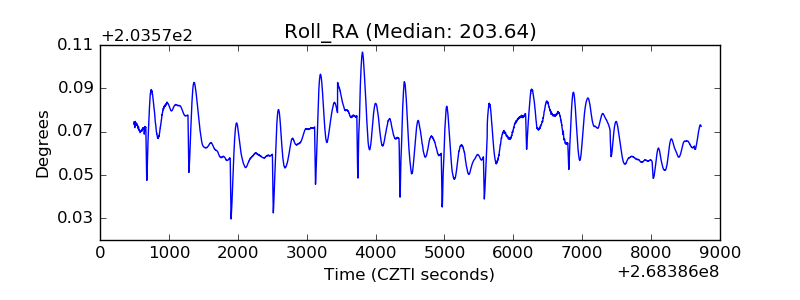 |
| Veto Counter | 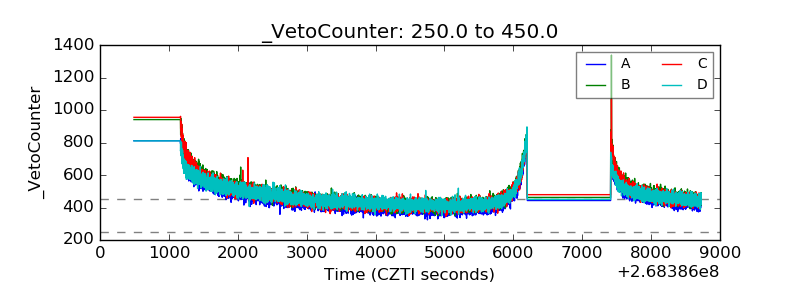 |