| Param | Original file | Final file |
|---|---|---|
| Filename | modeM0/AS1T02_056T01_9000002210_14955cztM0_level2.evt | modeM0/AS1T02_056T01_9000002210_14955cztM0_level2_quad_clean.evt |
| Size (bytes) | 684,411,840 | 89,029,440 |
| Size | 652.7 MB | 84.9 MB |
| Events in quadrant A | 3,203,200 | 589,664 |
| Events in quadrant B | 3,335,042 | 585,149 |
| Events in quadrant C | 3,077,631 | 572,180 |
| Events in quadrant D | 10,686,166 | 509,255 |
| Mode M0 | |||
|---|---|---|---|
| Quadrant | BADHDUFLAG | Total packets | Discarded packets |
| A | 0 | 13330 | 2 |
| B | 0 | 13853 | 1 |
| C | 0 | 12984 | 1 |
| D | 0 | 36064 | 1 |
| Mode M9 | |||
|---|---|---|---|
| Quadrant | BADHDUFLAG | Total packets | Discarded packets |
| A | 0 | 6 | 0 |
| B | 0 | 6 | 0 |
| C | 0 | 6 | 0 |
| D | 0 | 6 | 0 |
| Mode SS | |||
|---|---|---|---|
| Quadrant | BADHDUFLAG | Total packets | Discarded packets |
| A | 0 | 128 | 0 |
| B | 0 | 128 | 0 |
| C | 0 | 128 | 0 |
| D | 0 | 128 | 0 |
| Quadrant | Total seconds | Saturated seconds | Saturation percentage |
|---|---|---|---|
| A | 6294 | 93 | 1.477598% |
| B | 6294 | 110 | 1.747696% |
| C | 6294 | 47 | 0.746743% |
| D | 6294 | 2090 | 33.206228% |
Noise dominated data is calculated using 1-second bins in cleaned event files. If a bin has >2000 counts, and if more than 50% of those come from <1% of pixels, then it is considered to be noise-dominated and hence unusable.
| Quadrant | # 1 sec bins | Bins with >0 counts | Bins with >2000 counts | High rate bins dominated by noise | Noise dominated (total time) | Noise dominated (detector-on time) | Marked lightcurve |
|---|---|---|---|---|---|---|---|
| A | 6905 | 6296 | 0 | 0 | 0.00% | 0.00% | 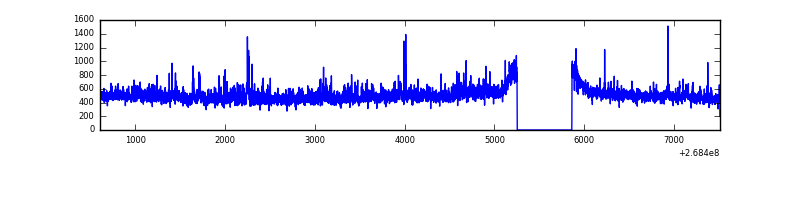 |
| B | 6905 | 6296 | 13 | 13 | 0.19% | 0.21% | 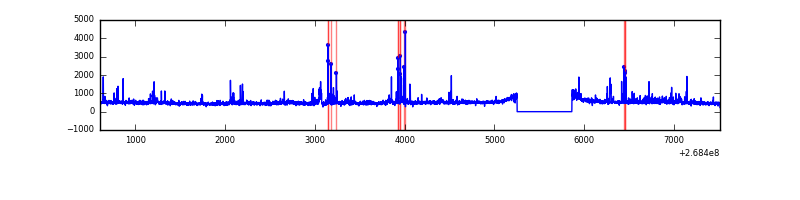 |
| C | 6905 | 6296 | 0 | 0 | 0.00% | 0.00% | 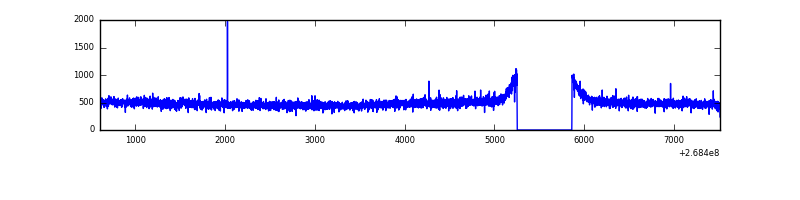 |
| D | 6905 | 6296 | 2071 | 2071 | 29.99% | 32.89% | 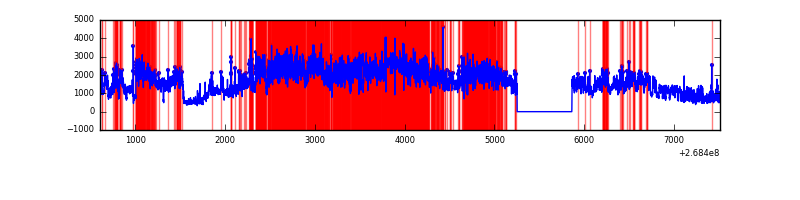 |
Top three noisy pixels from each quadrant. If the there are fewer than three noisy pixels in the level2.evt file, extra rows are filled as -1
| Pixel properties | Quadrant properties | ||||||
|---|---|---|---|---|---|---|---|
| Quadrant | DetID | PixID | Counts | Sigma | Mean | Median | Sigma |
| A | 12 | 189 | 97906 | 623.4 | 765 | 749 | 155.9 |
| A | 1 | 162 | 63552 | 402.97 | 765 | 749 | 155.9 |
| A | 1 | 178 | 32573 | 204.2 | 765 | 749 | 155.9 |
| B | 10 | 246 | 129566 | 891.22 | 756 | 738 | 144.6 |
| B | 10 | 16 | 39363 | 267.2 | 756 | 738 | 144.6 |
| B | 0 | 230 | 38346 | 260.17 | 756 | 738 | 144.6 |
| C | 3 | 233 | 184724 | 1074.85 | 738 | 741 | 171.2 |
| C | 7 | 247 | 11027 | 60.09 | 738 | 741 | 171.2 |
| C | 13 | 61 | 5388 | 27.15 | 738 | 741 | 171.2 |
| D | 7 | 254 | 7828401 | 47899.44 | 682 | 665 | 163.4 |
| D | 13 | 249 | 115772 | 704.36 | 682 | 665 | 163.4 |
| D | 7 | 38 | 36596 | 219.87 | 682 | 665 | 163.4 |
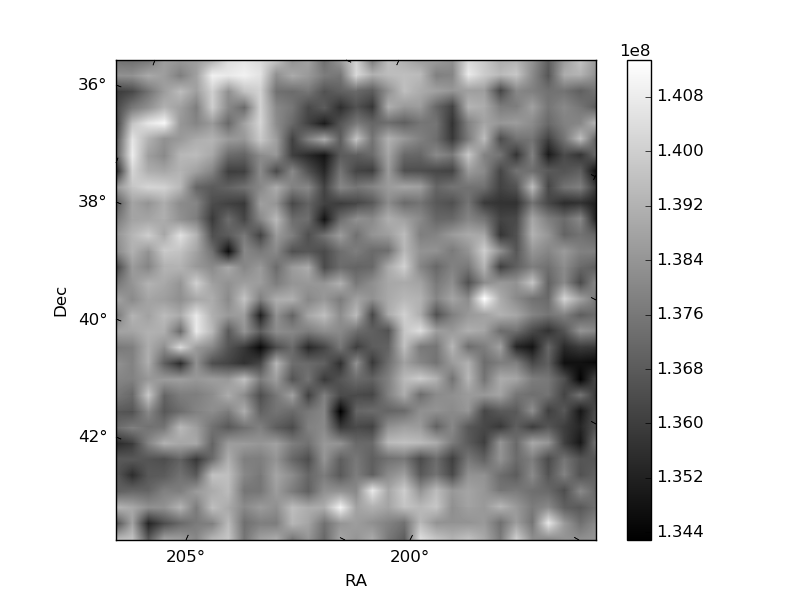
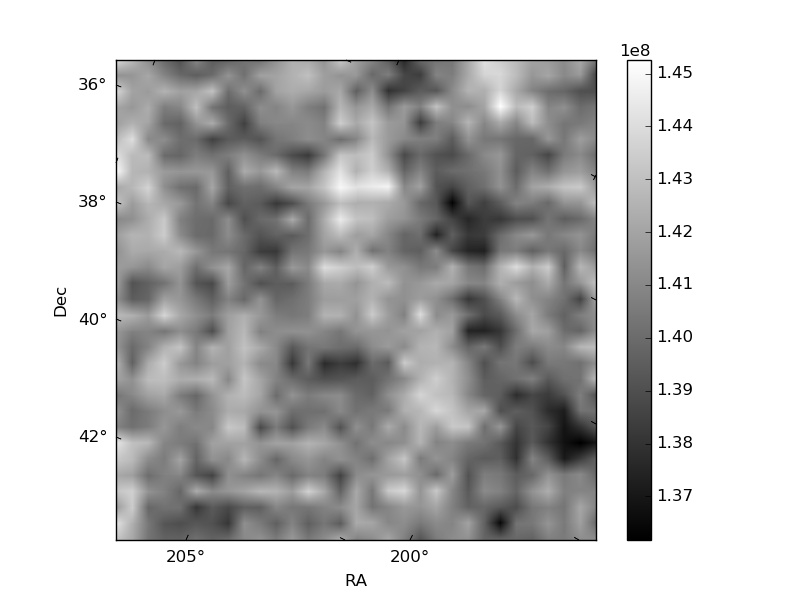
Histogram calculated using DETX and DETY for each event in the final _common_clean file
| Quadrant A | 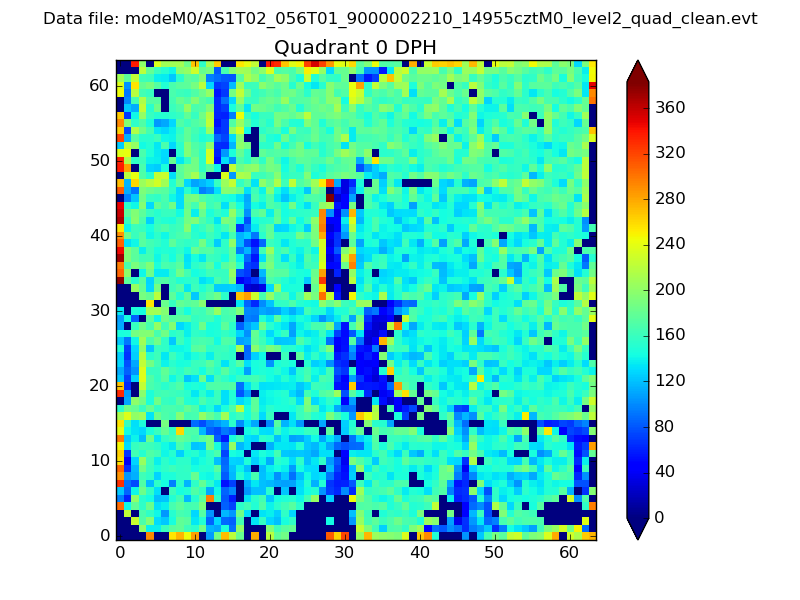 |
 |
Quadrant B |
|---|---|---|---|
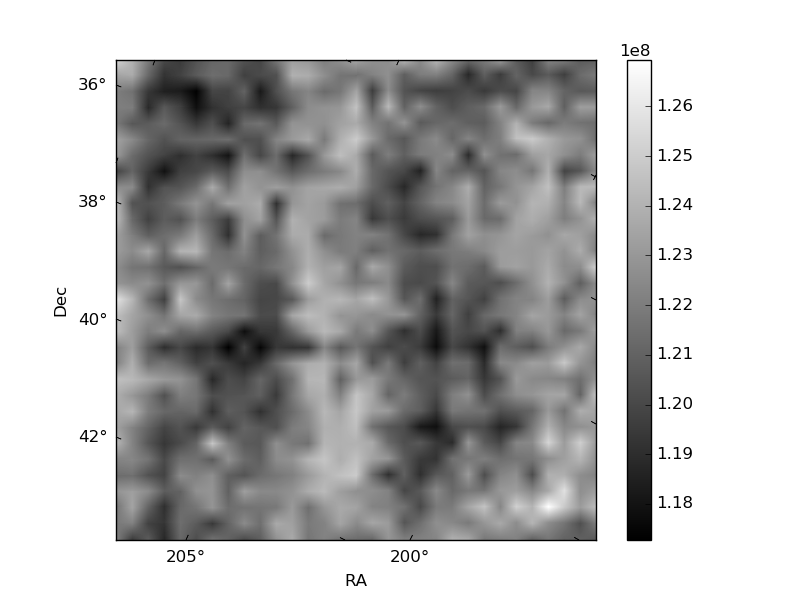
| Quadrant D | 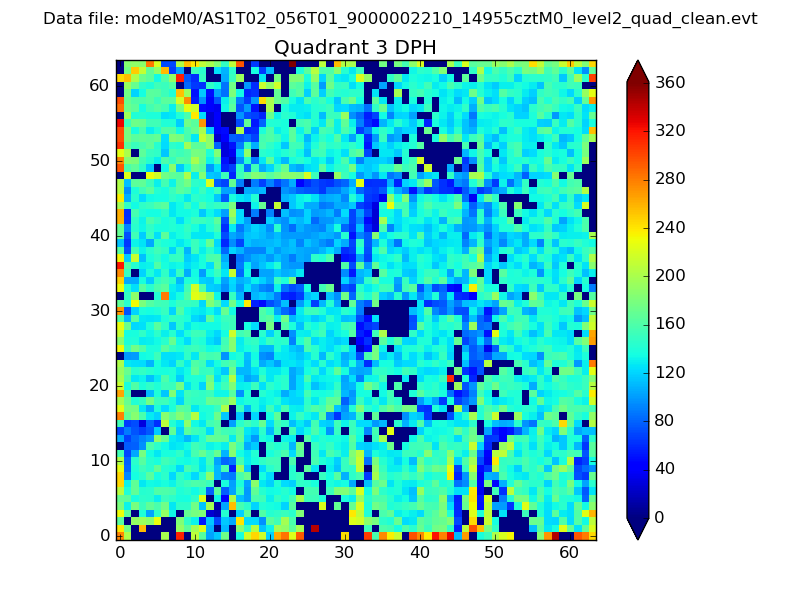 |
 |
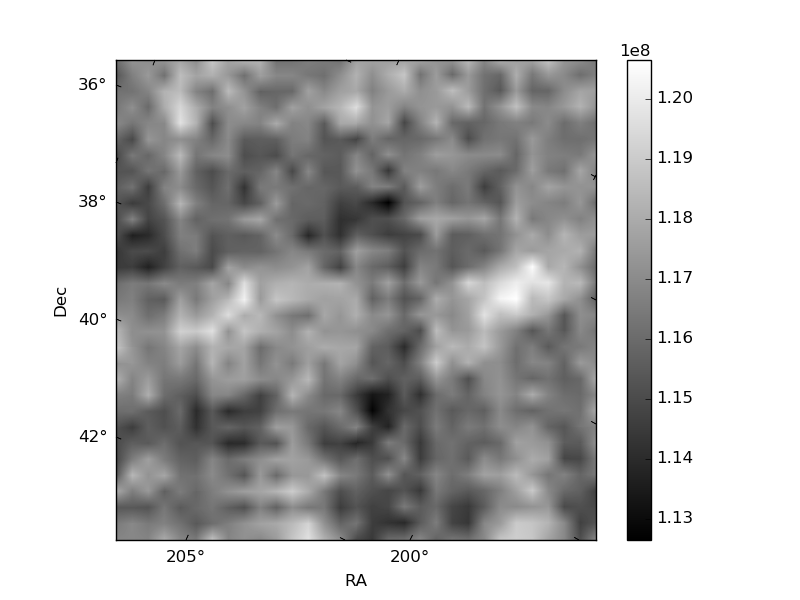
Quadrant C |
| Plot type | Count rate plots | Images |
|---|---|---|
| Comparison with Poisson distribution Blue bars denote a histogram of data divided into 1 sec bins. Red curve is a Poisson curve with rate = median count rate of data. |
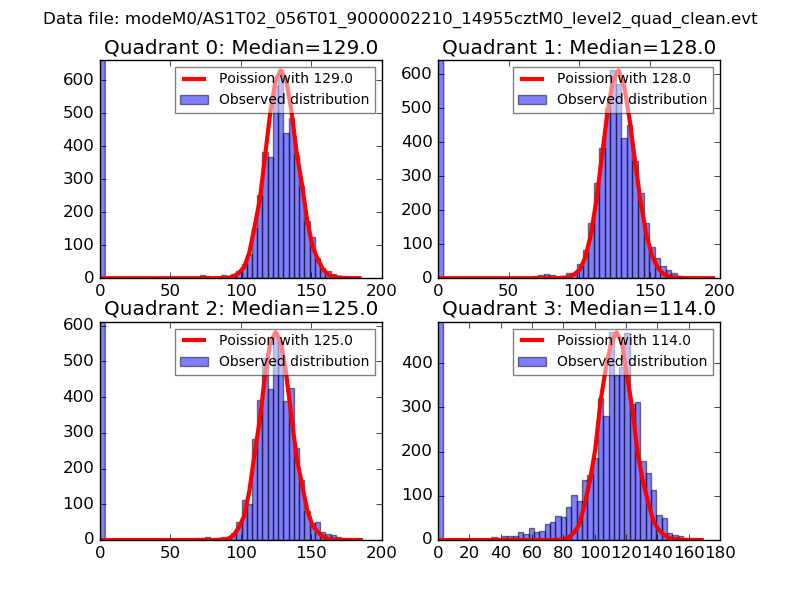 |
 |
| Quadrant-wise count rates Data is divided into 100 sec bins |
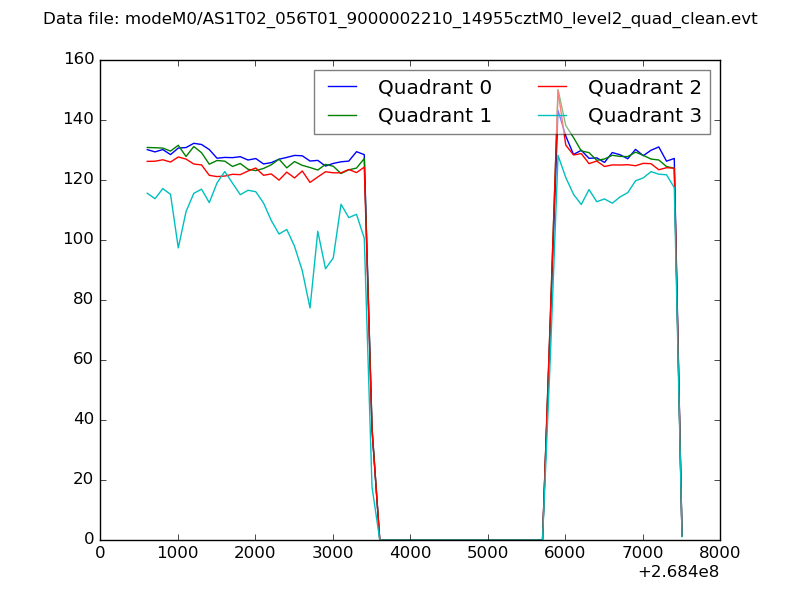 |
|
| Module-wise count rates for Quadrant A Data is divided into 100 sec bins |
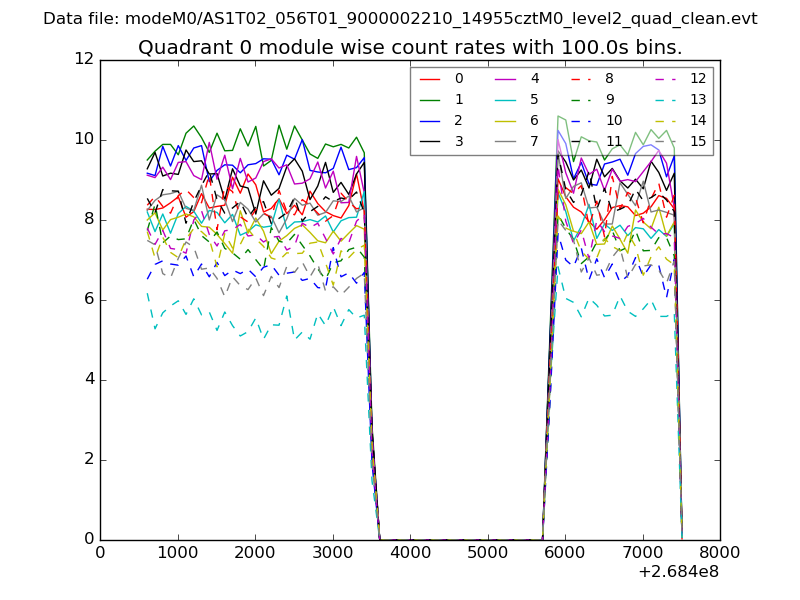 |
 |
| Module-wise count rates for Quadrant B Data is divided into 100 sec bins |
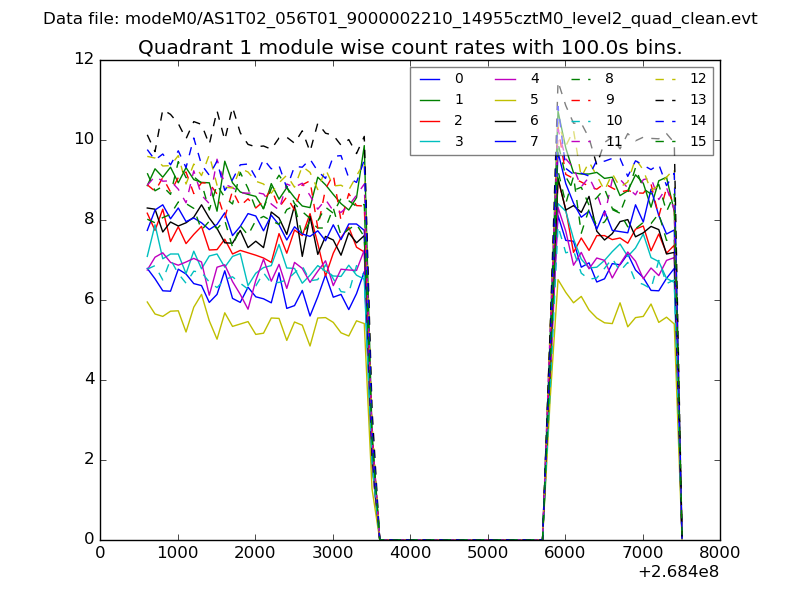 |
 |
| Module-wise count rates for Quadrant C Data is divided into 100 sec bins |
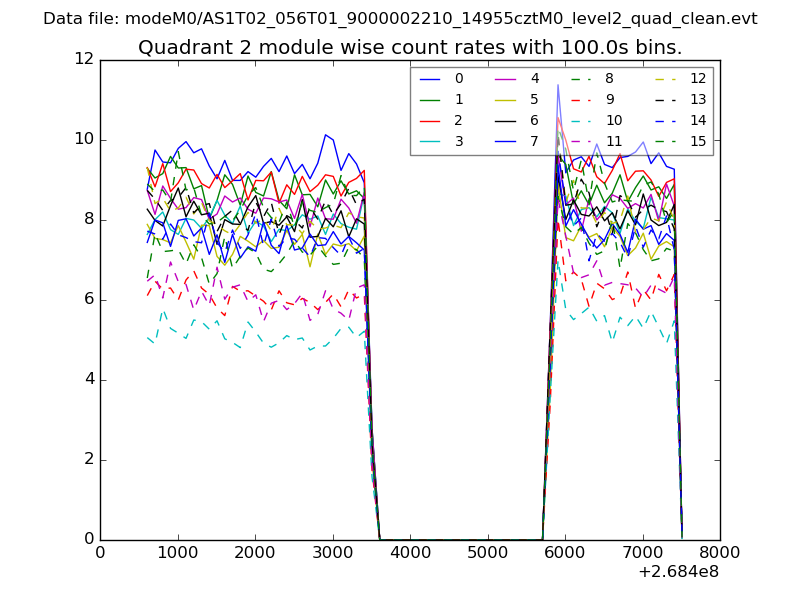 |
 |
| Module-wise count rates for Quadrant D Data is divided into 100 sec bins |
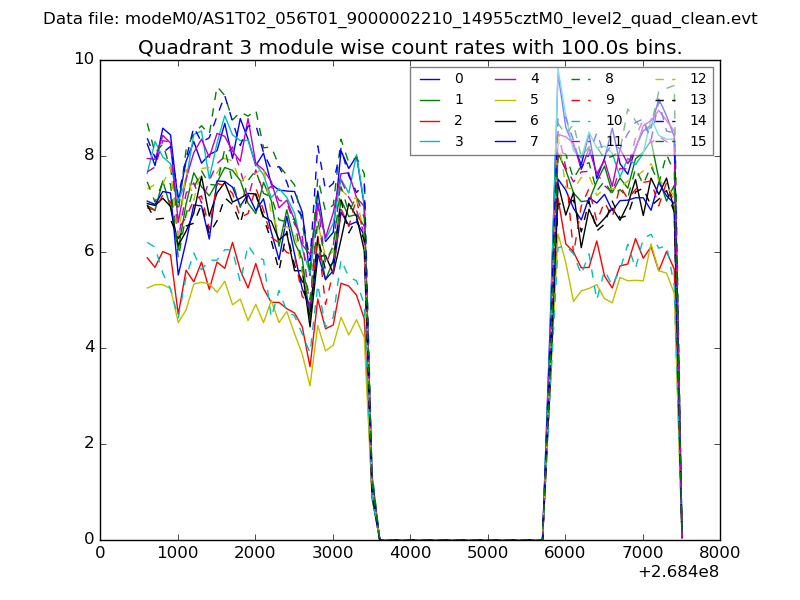 |
 |
| Parameter | Plot |
|---|---|
| CZT HV Monitor | 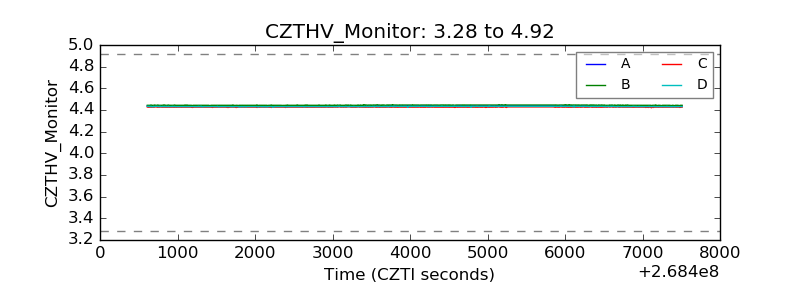 |
| D_VDD | 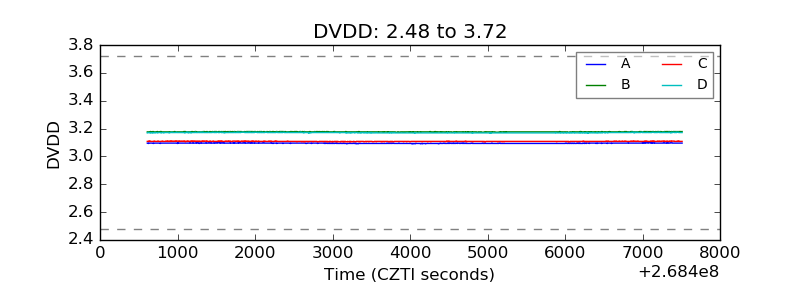 |
| Temperature 1 | 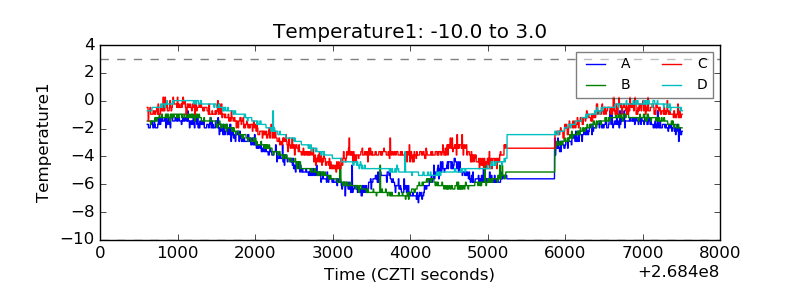 |
| Veto HV Monitor | 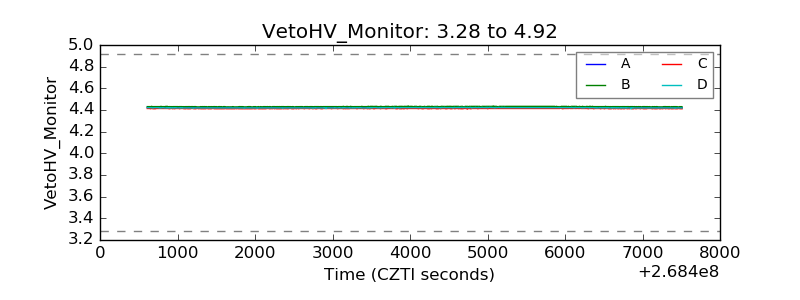 |
| Veto LLD | 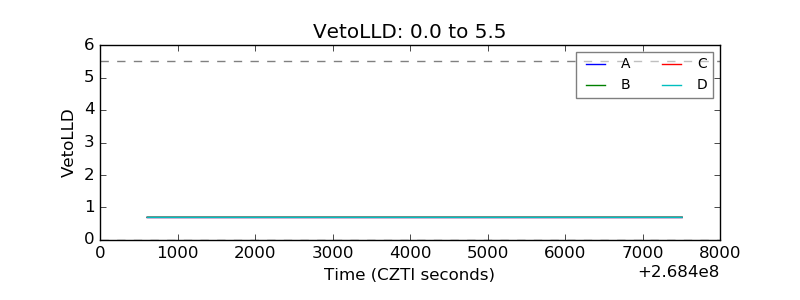 |
| Alpha Counter | 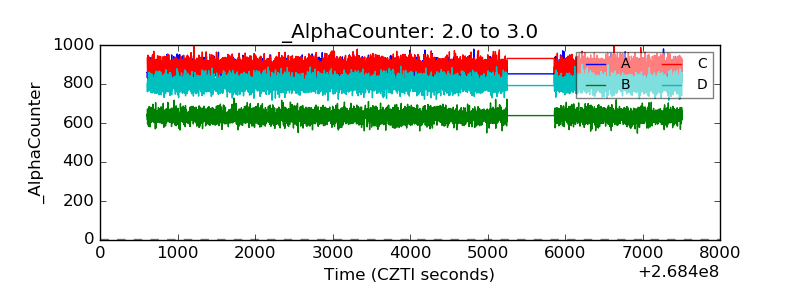 |
| _CPM_Rate | 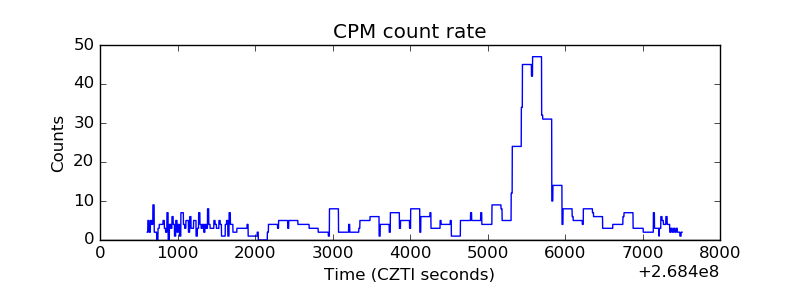 |
| CZT Counter |  |
| +2.5 Volts monitor |  |
| +5 Volts monitor | 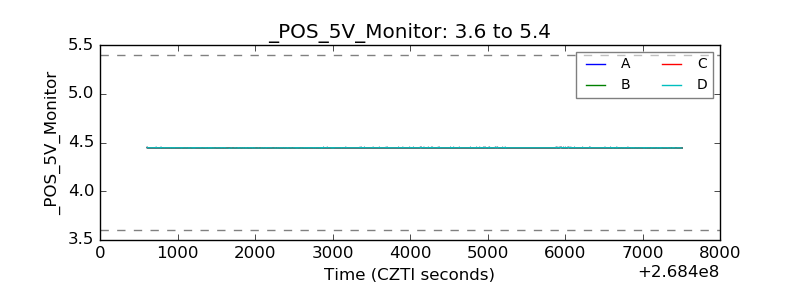 |
| _ROLL_ROT | 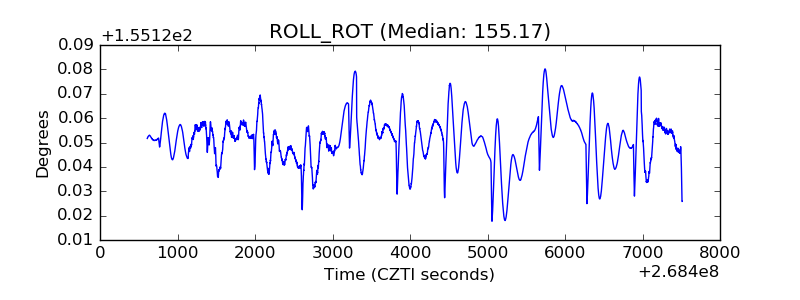 |
| _Roll_DEC | 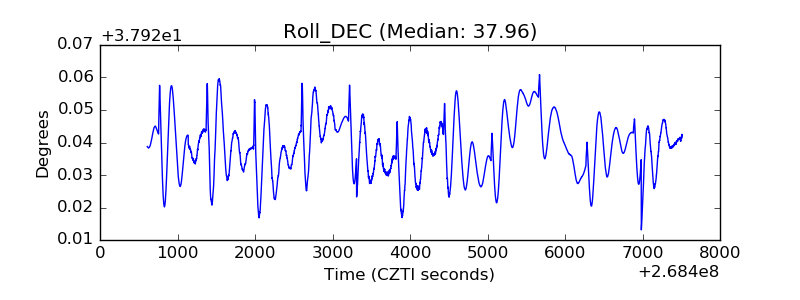 |
| _Roll_RA |  |
| Veto Counter | 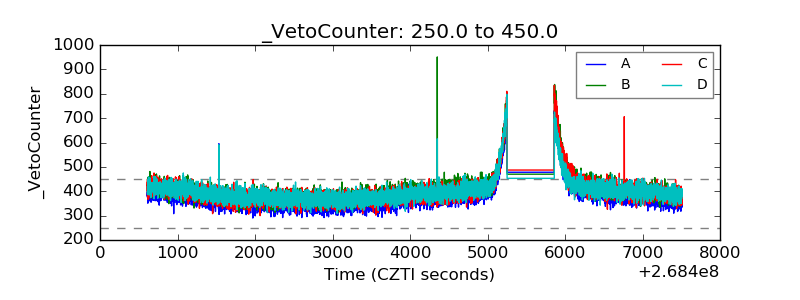 |