| Param | Original file | Final file |
|---|---|---|
| Filename | modeM0/AS1T02_056T01_9000002210_14956cztM0_level2.evt | modeM0/AS1T02_056T01_9000002210_14956cztM0_level2_quad_clean.evt |
| Size (bytes) | 732,614,400 | 87,056,640 |
| Size | 698.7 MB | 83.0 MB |
| Events in quadrant A | 3,269,354 | 581,934 |
| Events in quadrant B | 3,973,362 | 575,655 |
| Events in quadrant C | 3,272,685 | 566,446 |
| Events in quadrant D | 11,221,652 | 446,942 |
| Mode M0 | |||
|---|---|---|---|
| Quadrant | BADHDUFLAG | Total packets | Discarded packets |
| A | 0 | 14063 | 2 |
| B | 0 | 16111 | 1 |
| C | 0 | 14004 | 1 |
| D | 0 | 37965 | 1 |
| Mode M9 | |||
|---|---|---|---|
| Quadrant | BADHDUFLAG | Total packets | Discarded packets |
| A | 0 | 3 | 0 |
| B | 0 | 3 | 0 |
| C | 0 | 3 | 0 |
| D | 0 | 3 | 0 |
| Mode SS | |||
|---|---|---|---|
| Quadrant | BADHDUFLAG | Total packets | Discarded packets |
| A | 0 | 136 | 0 |
| B | 0 | 136 | 0 |
| C | 0 | 136 | 0 |
| D | 0 | 136 | 0 |
| Quadrant | Total seconds | Saturated seconds | Saturation percentage |
|---|---|---|---|
| A | 6665 | 151 | 2.265566% |
| B | 6665 | 347 | 5.206302% |
| C | 6665 | 107 | 1.605401% |
| D | 6665 | 2468 | 37.029257% |
Noise dominated data is calculated using 1-second bins in cleaned event files. If a bin has >2000 counts, and if more than 50% of those come from <1% of pixels, then it is considered to be noise-dominated and hence unusable.
| Quadrant | # 1 sec bins | Bins with >0 counts | Bins with >2000 counts | High rate bins dominated by noise | Noise dominated (total time) | Noise dominated (detector-on time) | Marked lightcurve |
|---|---|---|---|---|---|---|---|
| A | 6906 | 6668 | 1 | 1 | 0.01% | 0.01% | 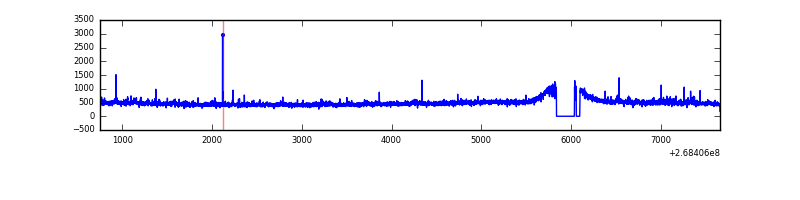 |
| B | 6906 | 6668 | 142 | 142 | 2.06% | 2.13% | 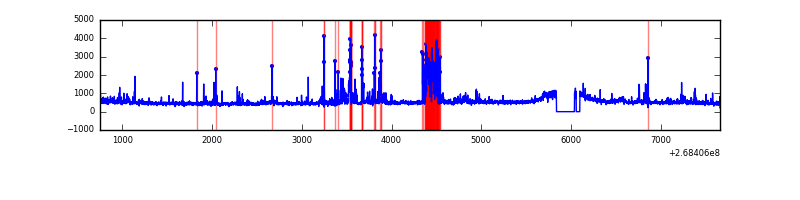 |
| C | 6906 | 6668 | 0 | 0 | 0.00% | 0.00% | 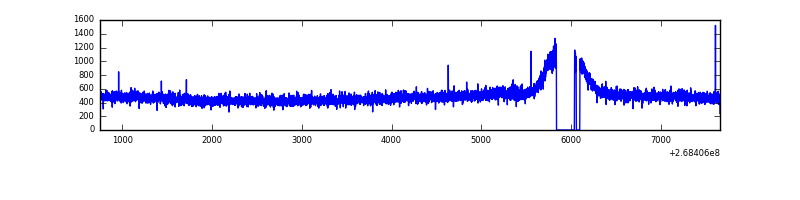 |
| D | 6906 | 6666 | 2511 | 2511 | 36.36% | 37.67% | 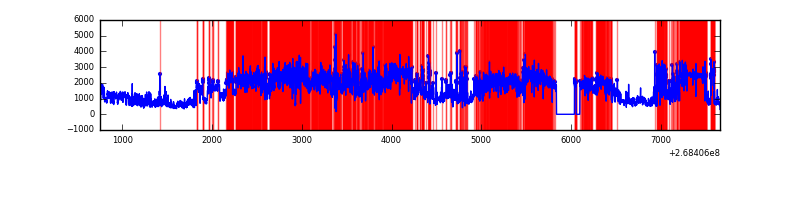 |
Top three noisy pixels from each quadrant. If the there are fewer than three noisy pixels in the level2.evt file, extra rows are filled as -1
| Pixel properties | Quadrant properties | ||||||
|---|---|---|---|---|---|---|---|
| Quadrant | DetID | PixID | Counts | Sigma | Mean | Median | Sigma |
| A | 12 | 189 | 51927 | 306.26 | 819 | 802 | 166.9 |
| A | 1 | 162 | 21812 | 125.86 | 819 | 802 | 166.9 |
| A | 1 | 178 | 10188 | 56.23 | 819 | 802 | 166.9 |
| B | 3 | 64 | 496368 | 3249.22 | 800 | 779 | 152.5 |
| B | 15 | 201 | 112301 | 731.17 | 800 | 779 | 152.5 |
| B | 10 | 246 | 66628 | 431.72 | 800 | 779 | 152.5 |
| C | 3 | 233 | 164342 | 883.58 | 792 | 797 | 185.1 |
| C | 7 | 247 | 7939 | 38.59 | 792 | 797 | 185.1 |
| C | 13 | 61 | 5735 | 26.68 | 792 | 797 | 185.1 |
| D | 7 | 254 | 7297927 | 45283.93 | 674 | 657 | 161.1 |
| D | 13 | 249 | 1253481 | 7774.52 | 674 | 657 | 161.1 |
| D | 7 | 38 | 42152 | 257.5 | 674 | 657 | 161.1 |
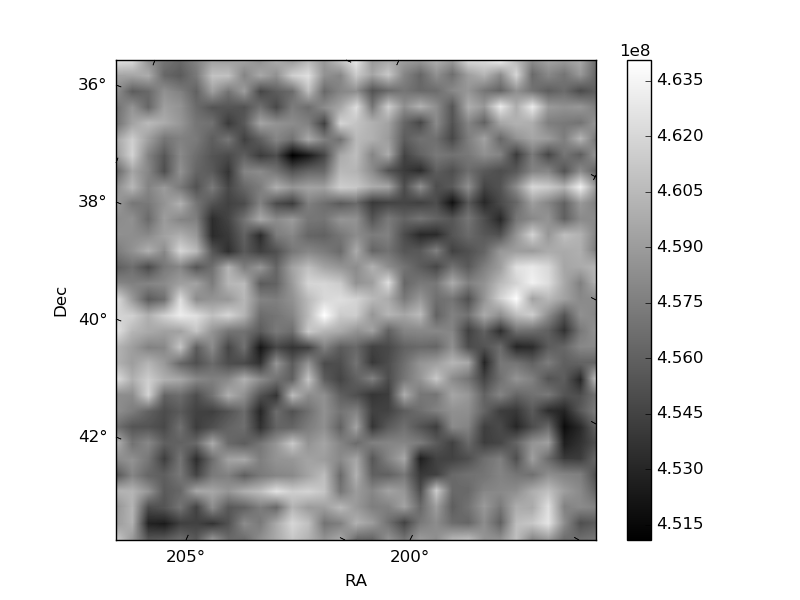
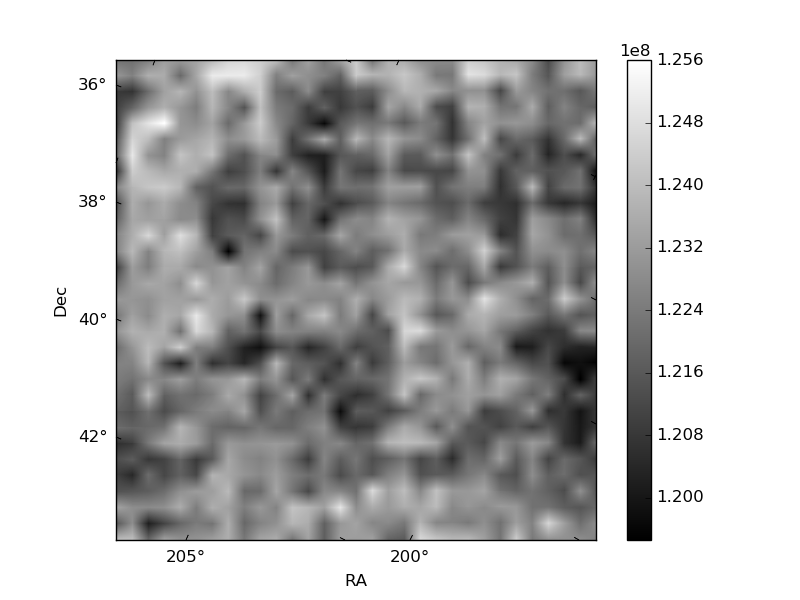
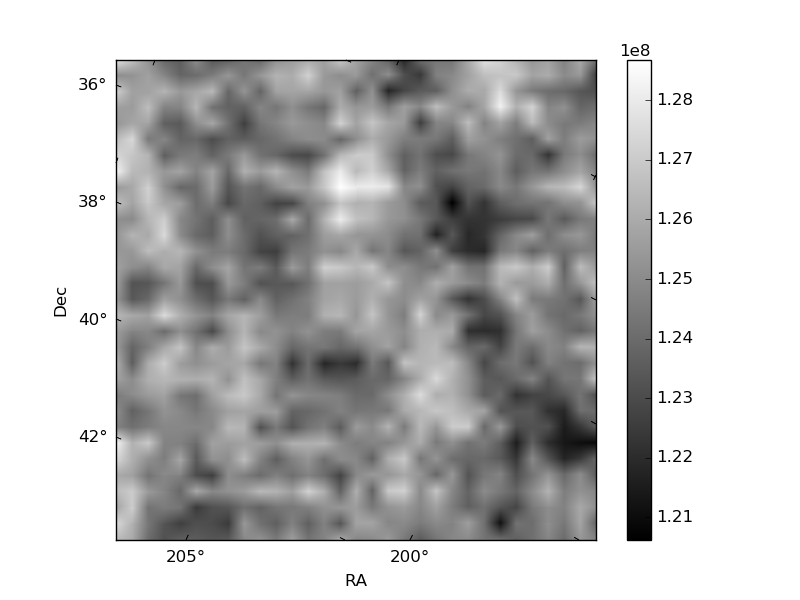
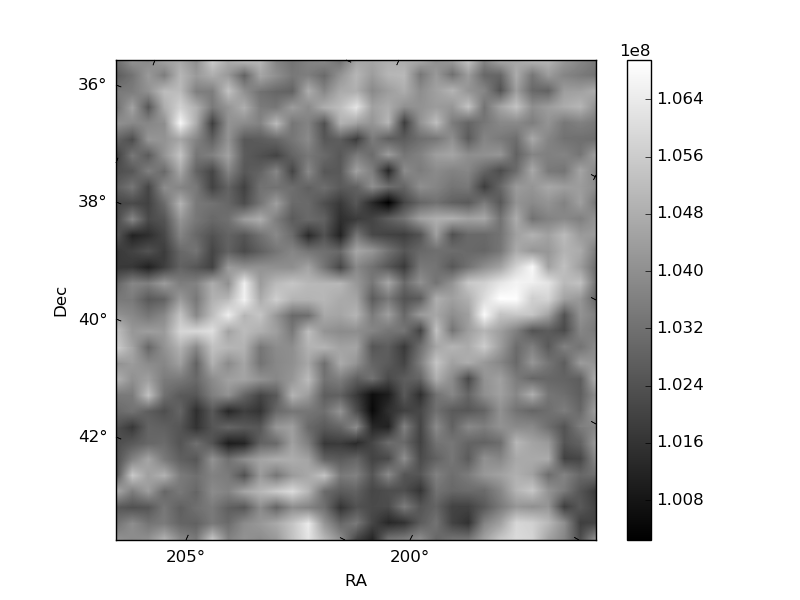
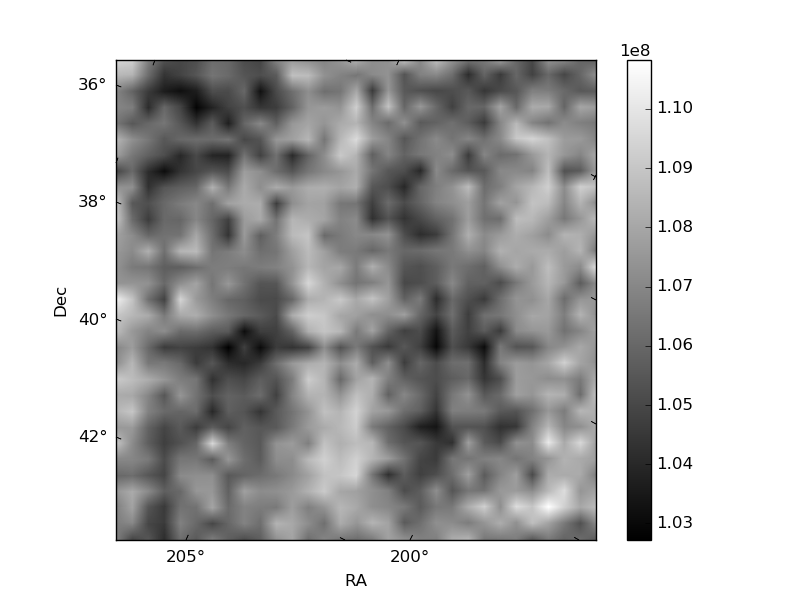
Histogram calculated using DETX and DETY for each event in the final _common_clean file
| Quadrant A | 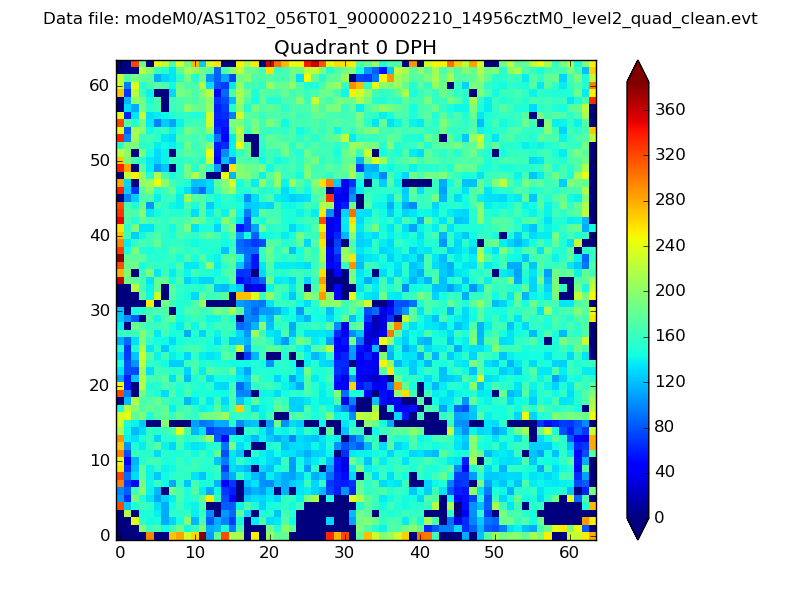 |
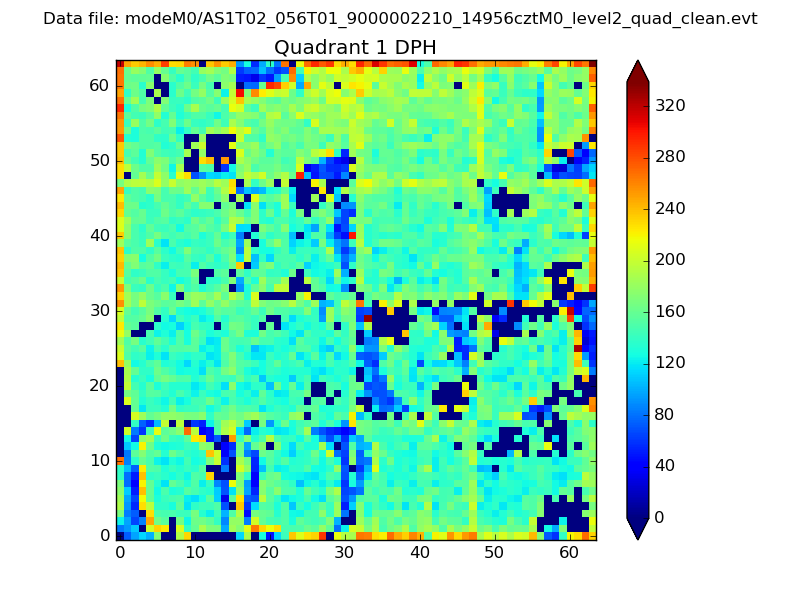 |
Quadrant B |
|---|---|---|---|
| Quadrant D | 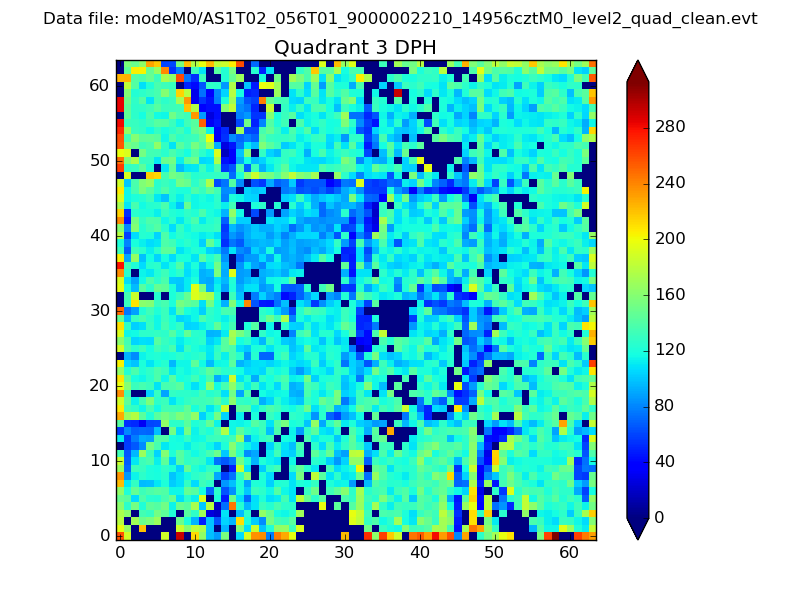 |
 |
Quadrant C |
| Plot type | Count rate plots | Images |
|---|---|---|
| Comparison with Poisson distribution Blue bars denote a histogram of data divided into 1 sec bins. Red curve is a Poisson curve with rate = median count rate of data. |
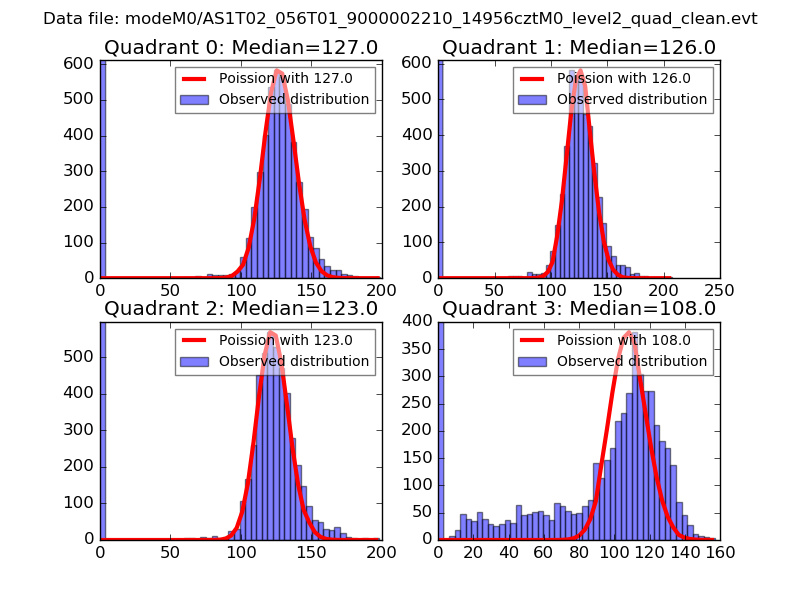 |
 |
| Quadrant-wise count rates Data is divided into 100 sec bins |
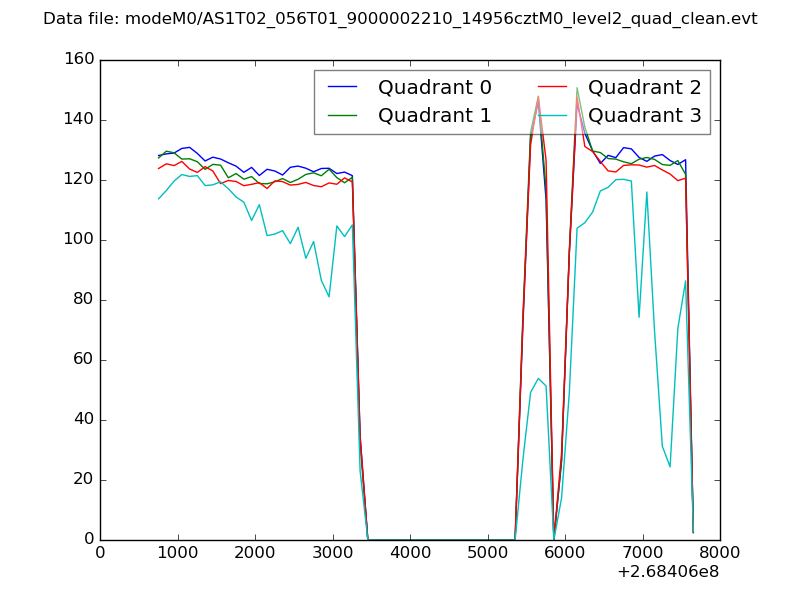 |
|
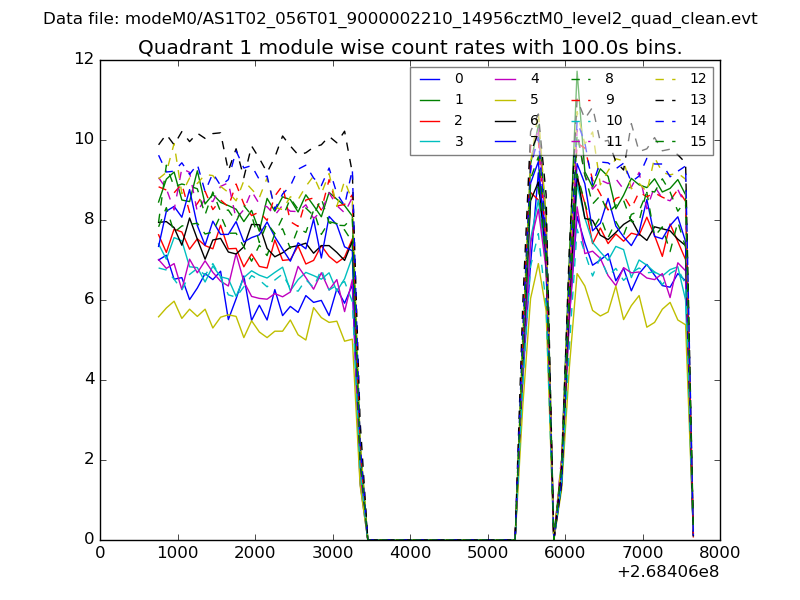
| Module-wise count rates for Quadrant A Data is divided into 100 sec bins |
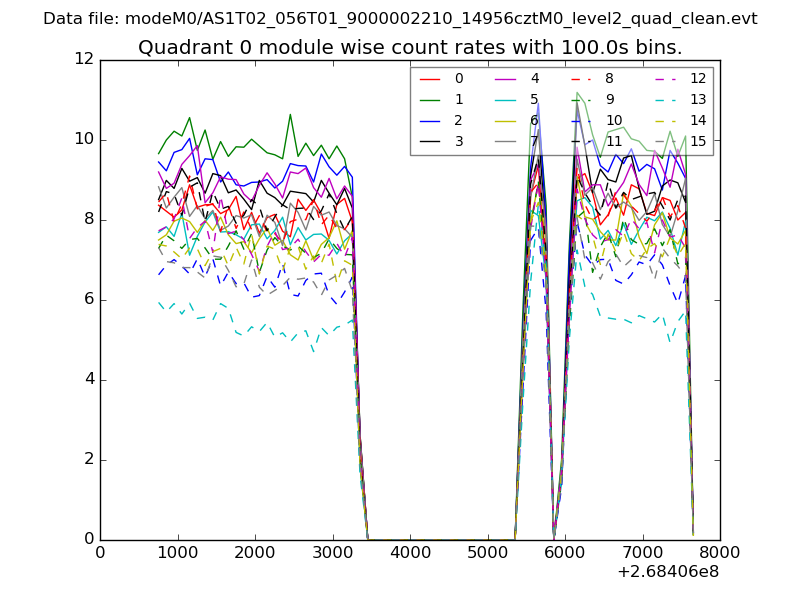 |
 |
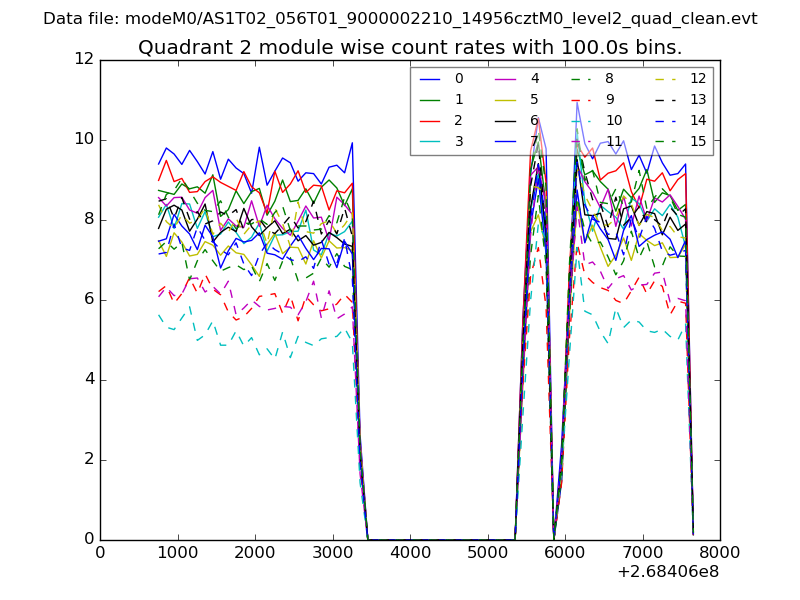
| Module-wise count rates for Quadrant B Data is divided into 100 sec bins |
 |
 |
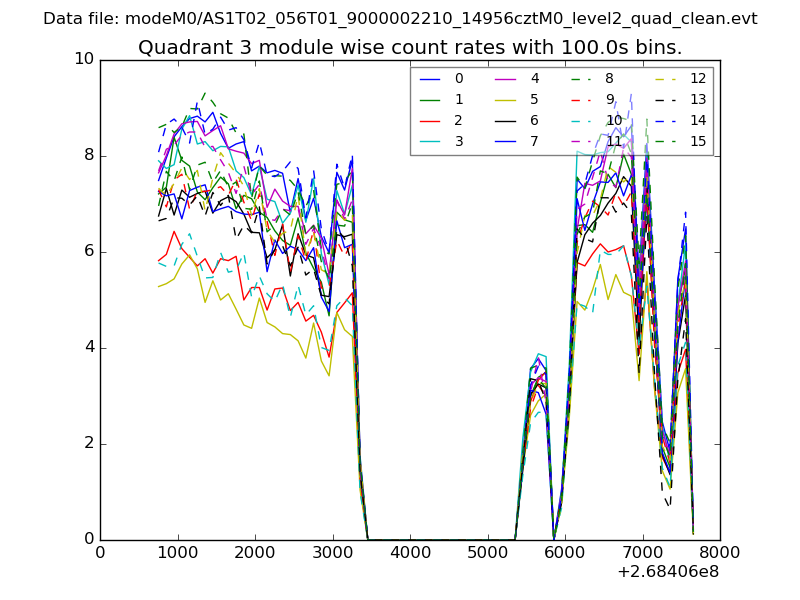
| Module-wise count rates for Quadrant C Data is divided into 100 sec bins |
 |
 |
| Module-wise count rates for Quadrant D Data is divided into 100 sec bins |
 |
 |
| Parameter | Plot |
|---|---|
| CZT HV Monitor | 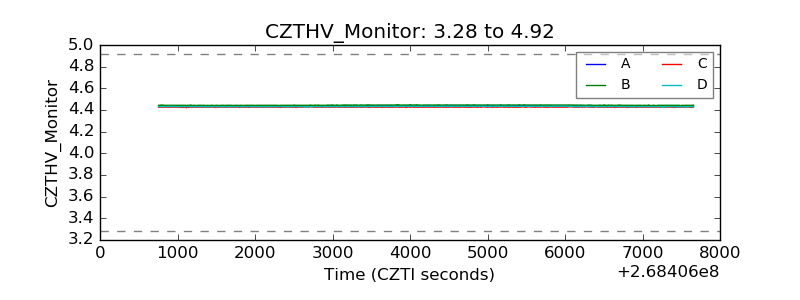 |
| D_VDD | 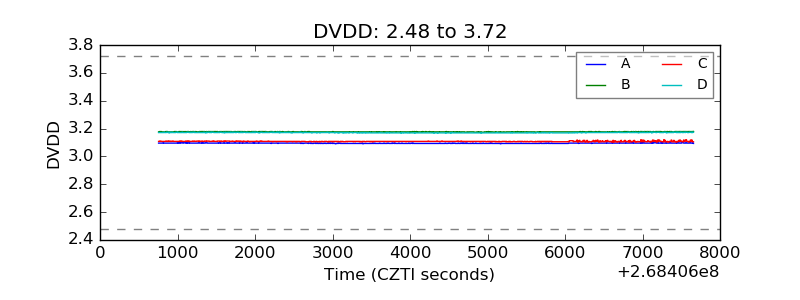 |
| Temperature 1 |  |
| Veto HV Monitor | 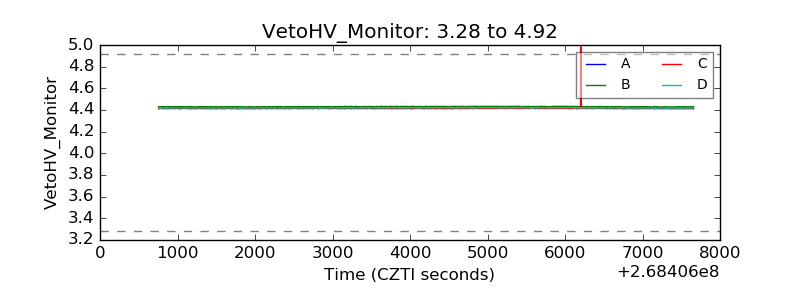 |
| Veto LLD | 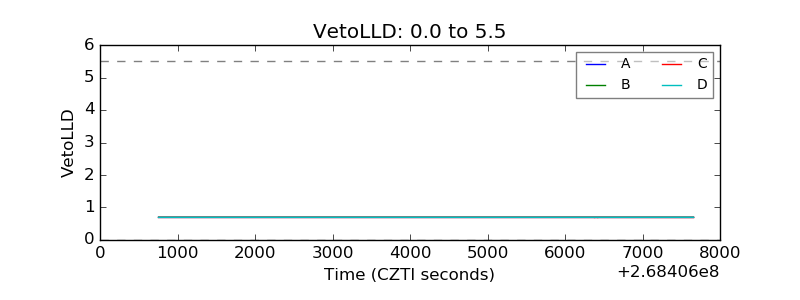 |
| Alpha Counter | 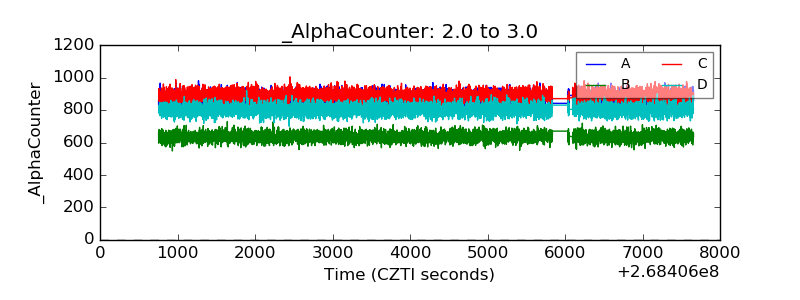 |
| _CPM_Rate | 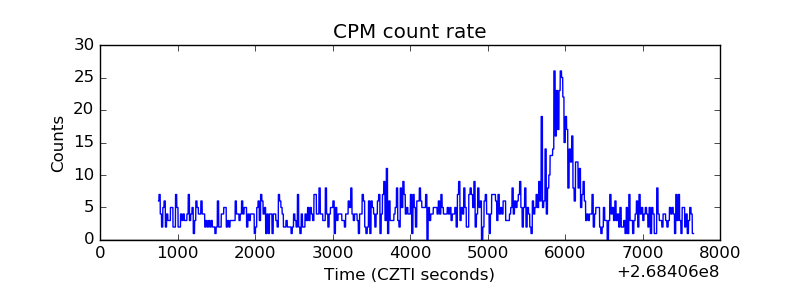 |
| CZT Counter | 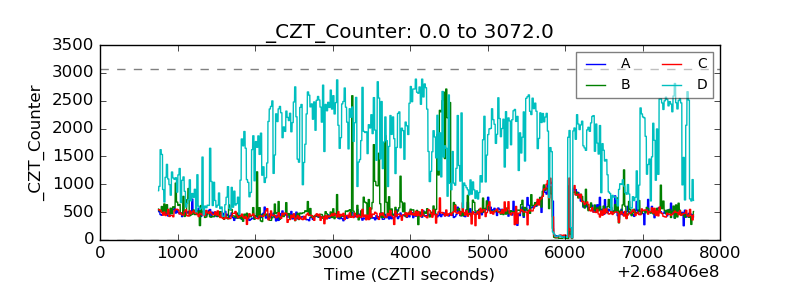 |
| +2.5 Volts monitor | 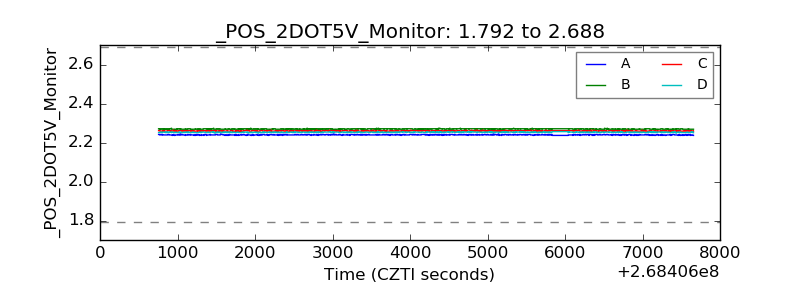 |
| +5 Volts monitor |  |
| _ROLL_ROT | 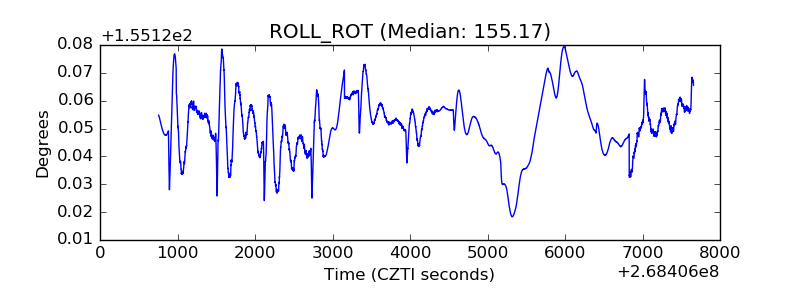 |
| _Roll_DEC | 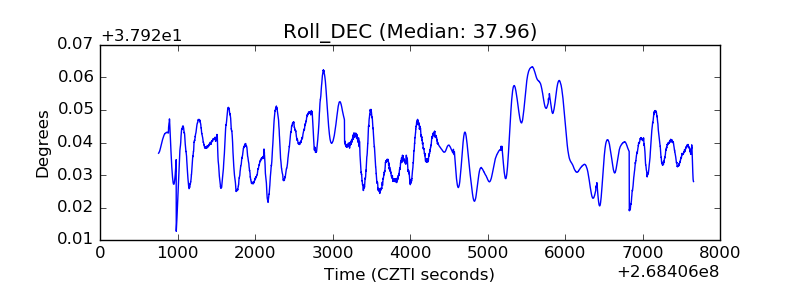 |
| _Roll_RA | 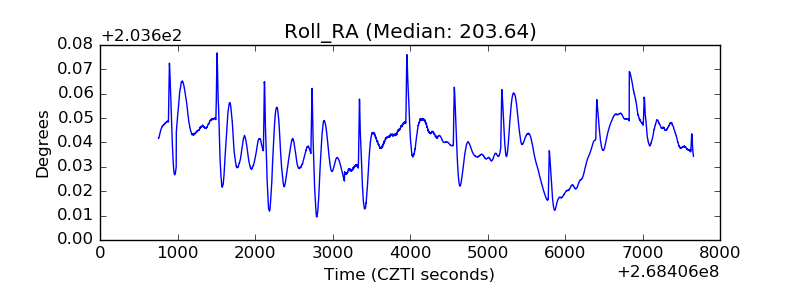 |
| Veto Counter | 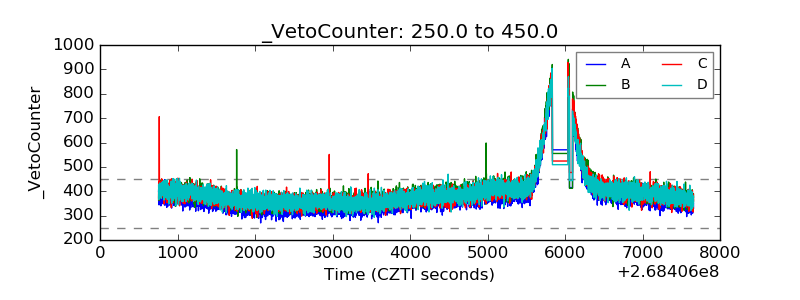 |