| Param | Original file | Final file |
|---|---|---|
| Filename | modeM0/AS1T02_056T01_9000002210_14957cztM0_level2.evt | modeM0/AS1T02_056T01_9000002210_14957cztM0_level2_quad_clean.evt |
| Size (bytes) | 759,121,920 | 90,391,680 |
| Size | 724.0 MB | 86.2 MB |
| Events in quadrant A | 3,424,343 | 598,322 |
| Events in quadrant B | 3,597,629 | 593,892 |
| Events in quadrant C | 3,296,185 | 586,052 |
| Events in quadrant D | 12,206,099 | 478,523 |
| Mode M0 | |||
|---|---|---|---|
| Quadrant | BADHDUFLAG | Total packets | Discarded packets |
| A | 0 | 14613 | 3 |
| B | 0 | 15180 | 2 |
| C | 0 | 14171 | 2 |
| D | 0 | 41004 | 2 |
| Mode M9 | |||
|---|---|---|---|
| Quadrant | BADHDUFLAG | Total packets | Discarded packets |
| A | 0 | 3 | 0 |
| B | 0 | 3 | 0 |
| C | 0 | 3 | 0 |
| D | 0 | 3 | 0 |
| Mode SS | |||
|---|---|---|---|
| Quadrant | BADHDUFLAG | Total packets | Discarded packets |
| A | 0 | 142 | 0 |
| B | 0 | 142 | 0 |
| C | 0 | 142 | 0 |
| D | 0 | 142 | 0 |
| Quadrant | Total seconds | Saturated seconds | Saturation percentage |
|---|---|---|---|
| A | 6878 | 67 | 0.974120% |
| B | 6878 | 91 | 1.323059% |
| C | 6878 | 17 | 0.247165% |
| D | 6878 | 3438 | 49.985461% |
Noise dominated data is calculated using 1-second bins in cleaned event files. If a bin has >2000 counts, and if more than 50% of those come from <1% of pixels, then it is considered to be noise-dominated and hence unusable.
| Quadrant | # 1 sec bins | Bins with >0 counts | Bins with >2000 counts | High rate bins dominated by noise | Noise dominated (total time) | Noise dominated (detector-on time) | Marked lightcurve |
|---|---|---|---|---|---|---|---|
| A | 7254 | 6881 | 10 | 10 | 0.14% | 0.15% | 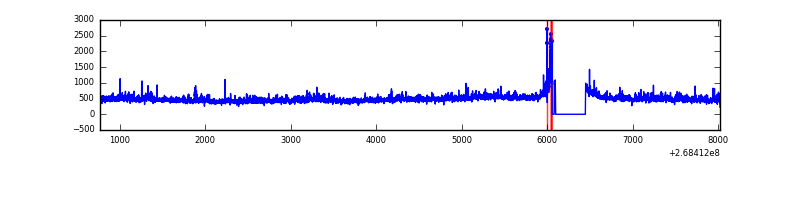 |
| B | 7254 | 6881 | 41 | 41 | 0.57% | 0.60% | 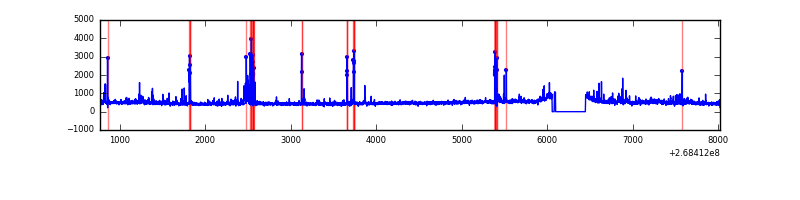 |
| C | 7254 | 6881 | 0 | 0 | 0.00% | 0.00% | 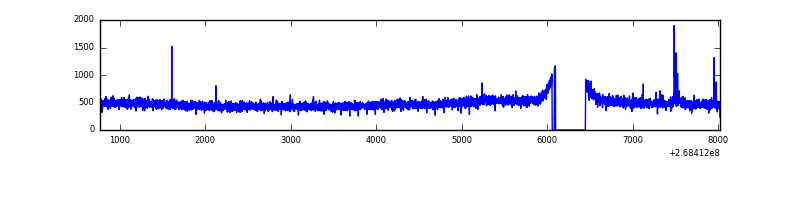 |
| D | 7254 | 6881 | 3277 | 3277 | 45.18% | 47.62% | 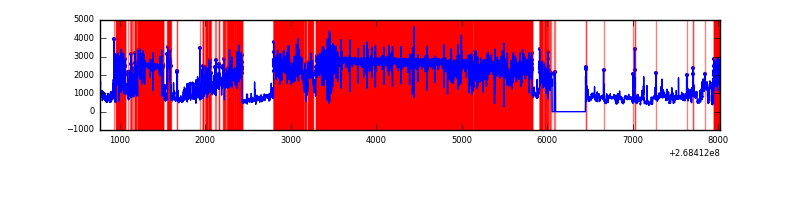 |
Top three noisy pixels from each quadrant. If the there are fewer than three noisy pixels in the level2.evt file, extra rows are filled as -1
| Pixel properties | Quadrant properties | ||||||
|---|---|---|---|---|---|---|---|
| Quadrant | DetID | PixID | Counts | Sigma | Mean | Median | Sigma |
| A | 1 | 162 | 88382 | 526.05 | 814 | 794 | 166.5 |
| A | 12 | 189 | 52239 | 308.98 | 814 | 794 | 166.5 |
| A | 1 | 178 | 41826 | 246.44 | 814 | 794 | 166.5 |
| B | 3 | 64 | 198746 | 1274.05 | 811 | 790 | 155.4 |
| B | 0 | 190 | 31771 | 199.39 | 811 | 790 | 155.4 |
| B | 3 | 209 | 24755 | 154.24 | 811 | 790 | 155.4 |
| C | 3 | 233 | 185967 | 1005.09 | 790 | 794 | 184.2 |
| C | 7 | 247 | 15043 | 77.34 | 790 | 794 | 184.2 |
| C | 14 | 234 | 14855 | 76.32 | 790 | 794 | 184.2 |
| D | 7 | 254 | 8596619 | 59561.25 | 597 | 581 | 144.3 |
| D | 13 | 249 | 1128800 | 7817.34 | 597 | 581 | 144.3 |
| D | 7 | 38 | 78027 | 536.62 | 597 | 581 | 144.3 |
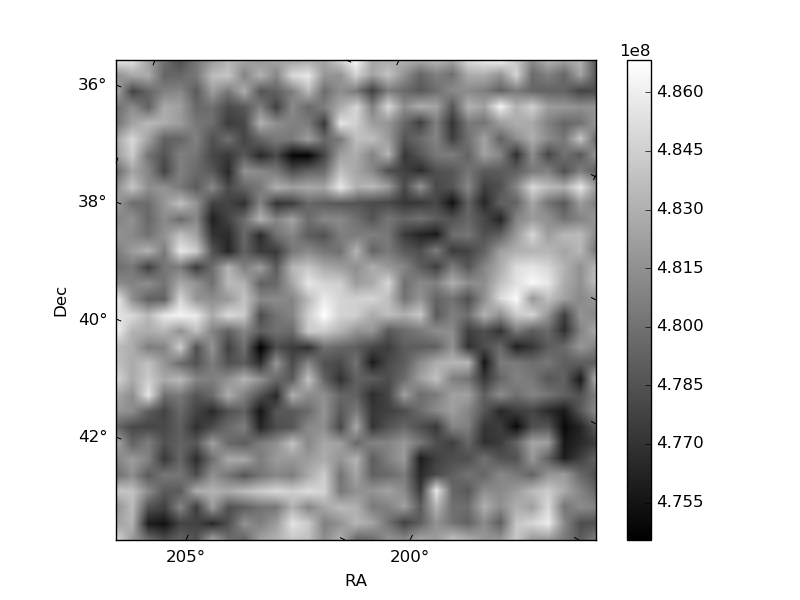
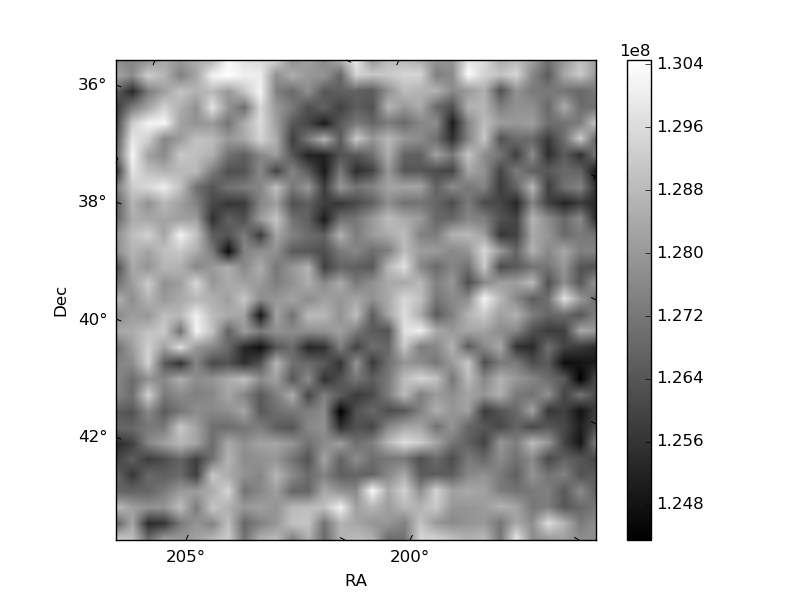
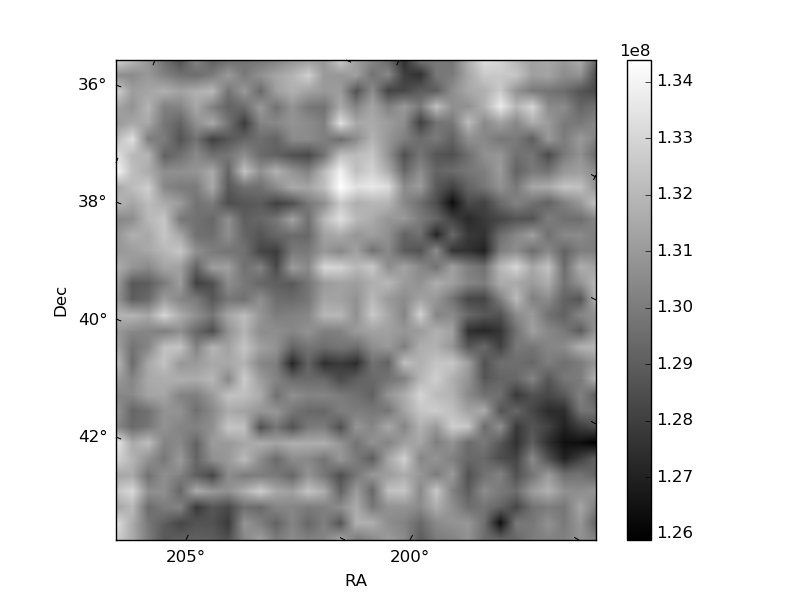
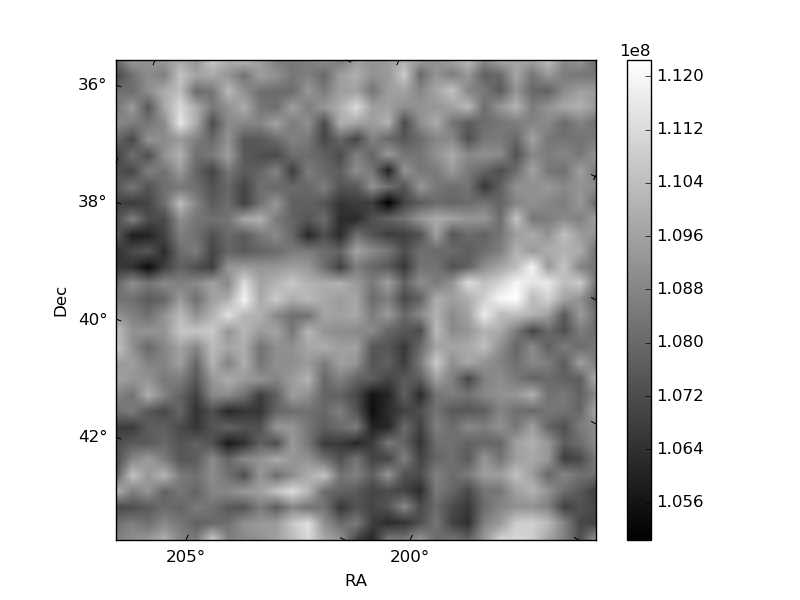
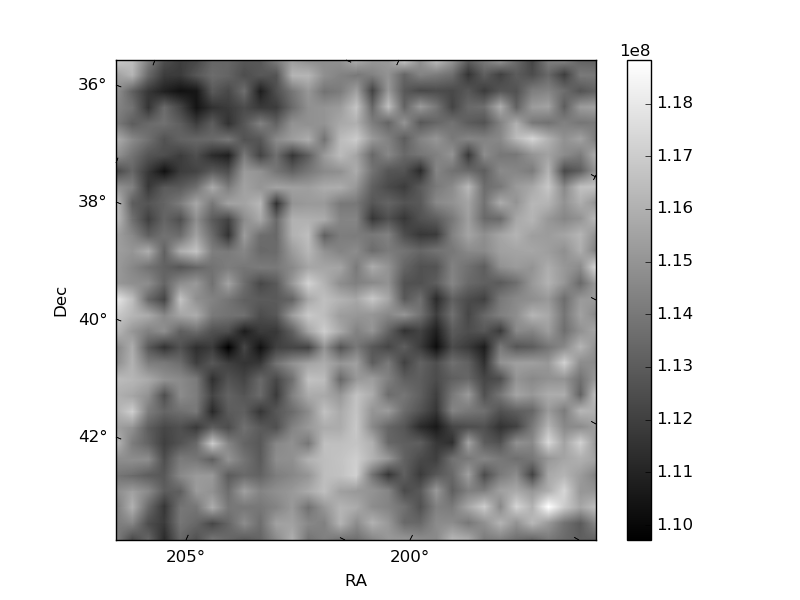
Histogram calculated using DETX and DETY for each event in the final _common_clean file
| Quadrant A | 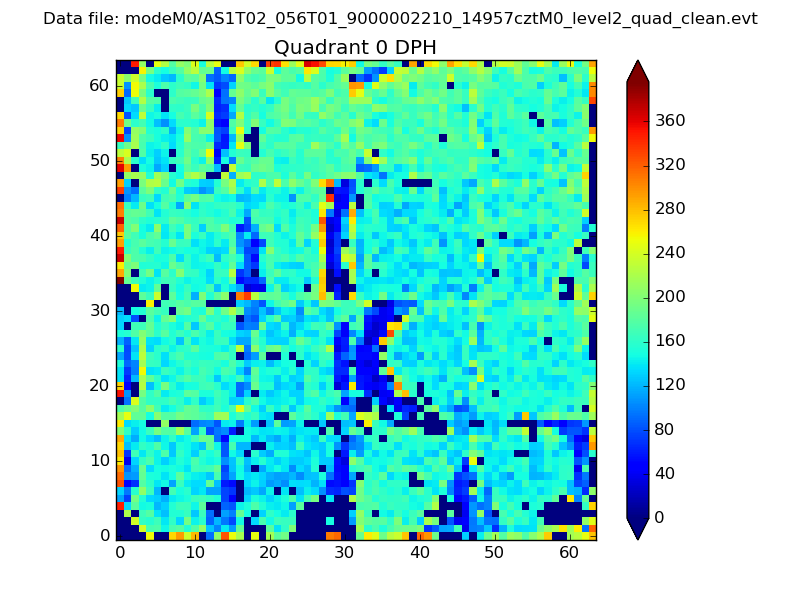 |
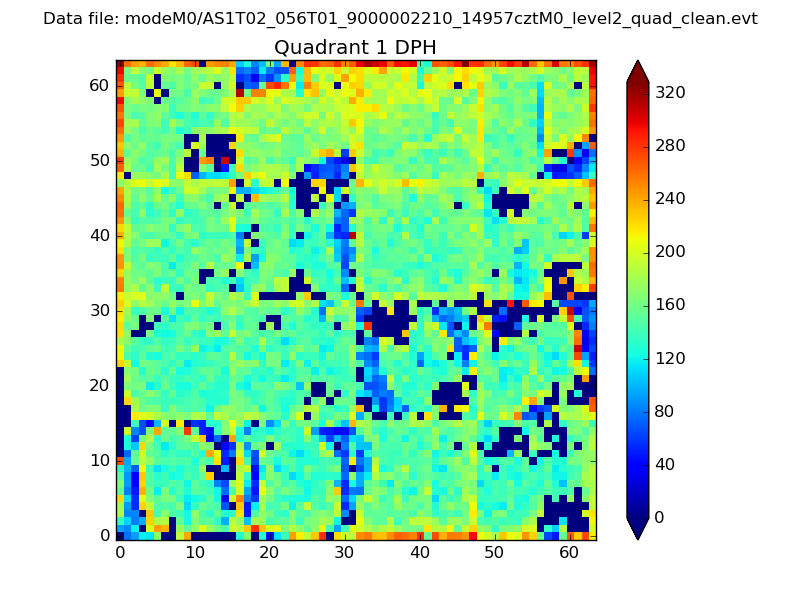 |
Quadrant B |
|---|---|---|---|
| Quadrant D | 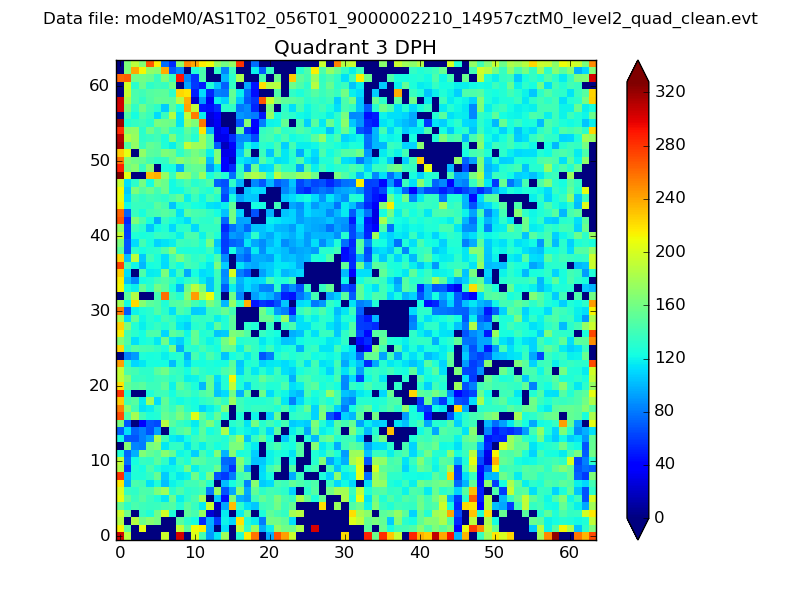 |
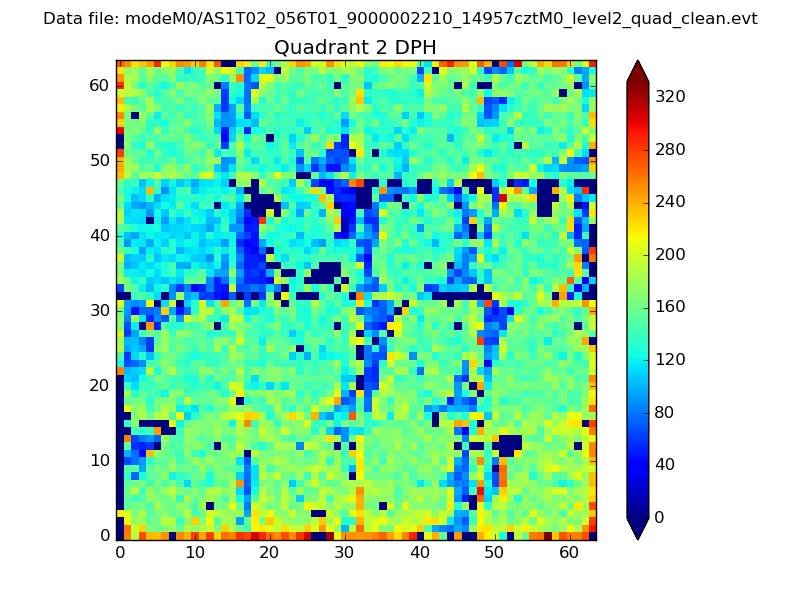 |
Quadrant C |
| Plot type | Count rate plots | Images |
|---|---|---|
| Comparison with Poisson distribution Blue bars denote a histogram of data divided into 1 sec bins. Red curve is a Poisson curve with rate = median count rate of data. |
 |
 |
| Quadrant-wise count rates Data is divided into 100 sec bins |
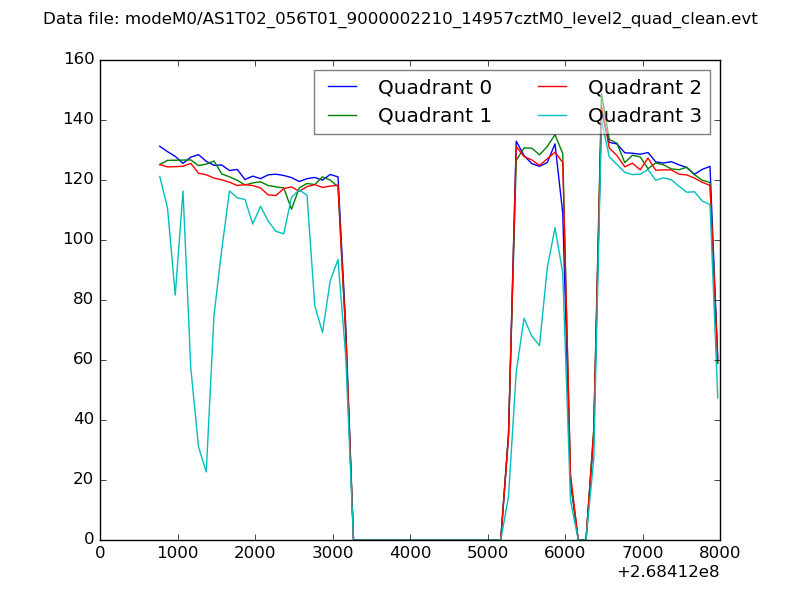 |
|
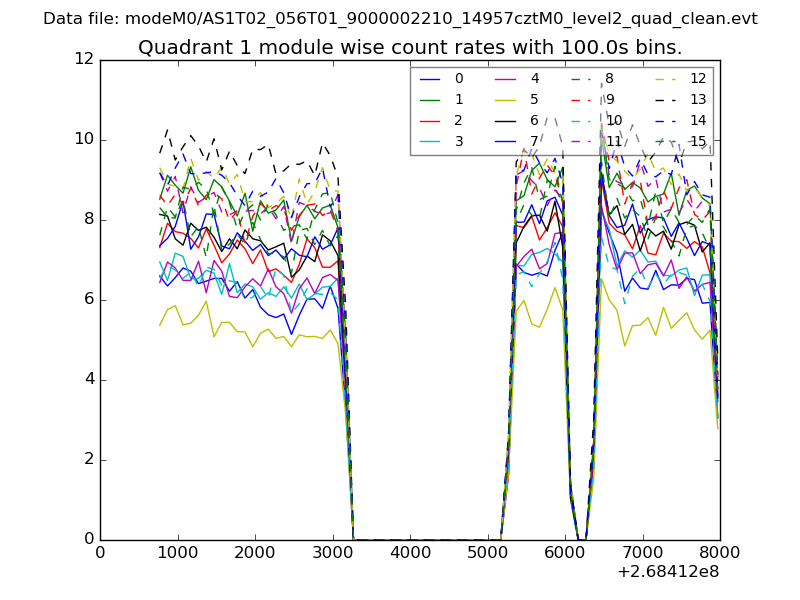
| Module-wise count rates for Quadrant A Data is divided into 100 sec bins |
 |
 |
| Module-wise count rates for Quadrant B Data is divided into 100 sec bins |
 |
 |
| Module-wise count rates for Quadrant C Data is divided into 100 sec bins |
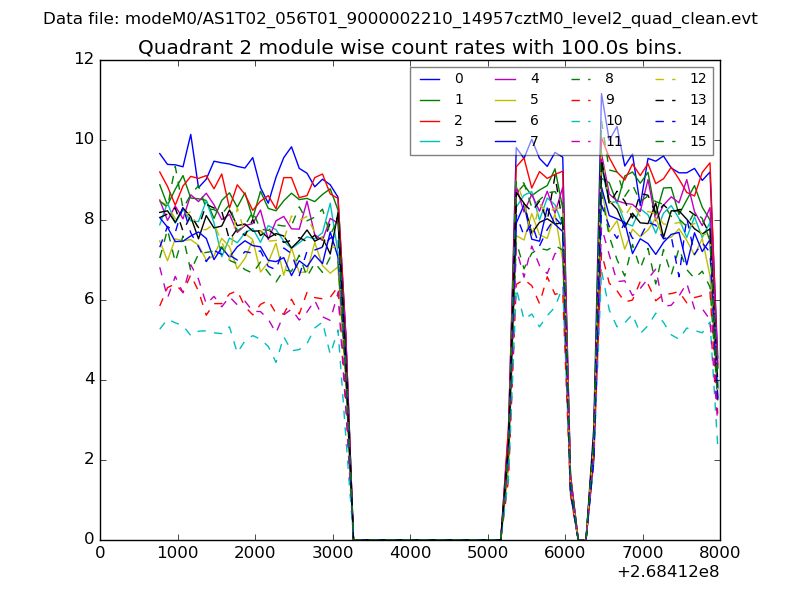 |
 |
| Module-wise count rates for Quadrant D Data is divided into 100 sec bins |
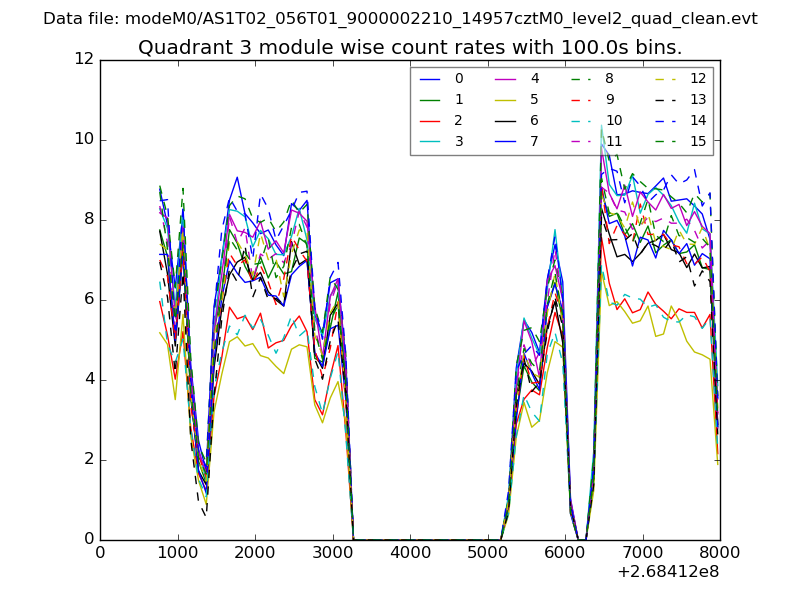 |
 |
| Parameter | Plot |
|---|---|
| CZT HV Monitor | 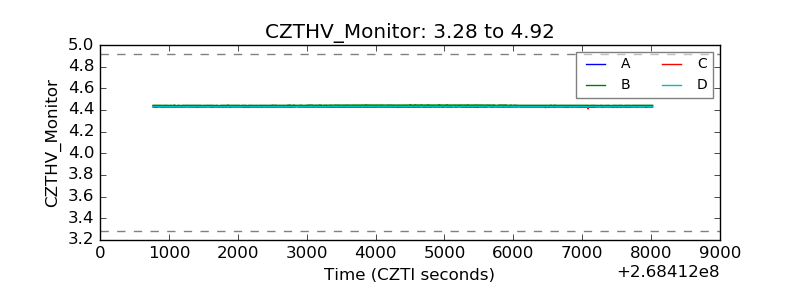 |
| D_VDD | 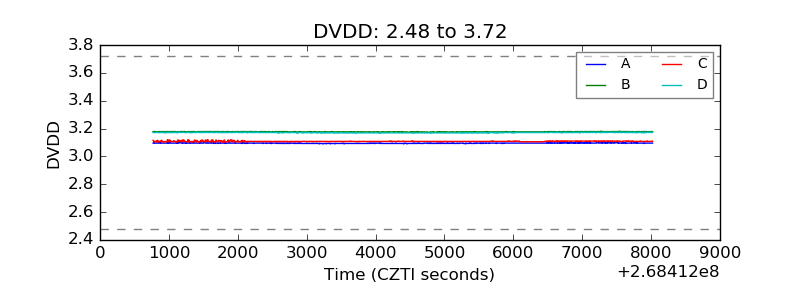 |
| Temperature 1 | 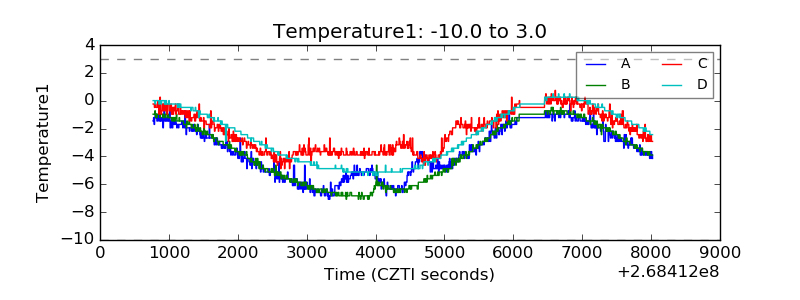 |
| Veto HV Monitor | 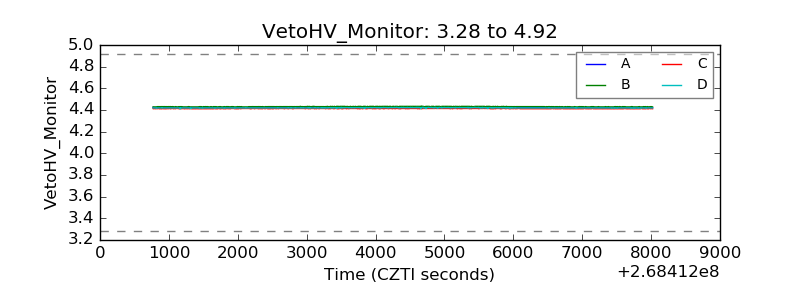 |
| Veto LLD |  |
| Alpha Counter | 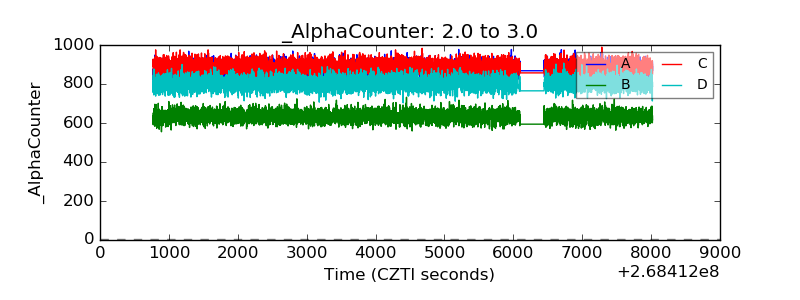 |
| _CPM_Rate | 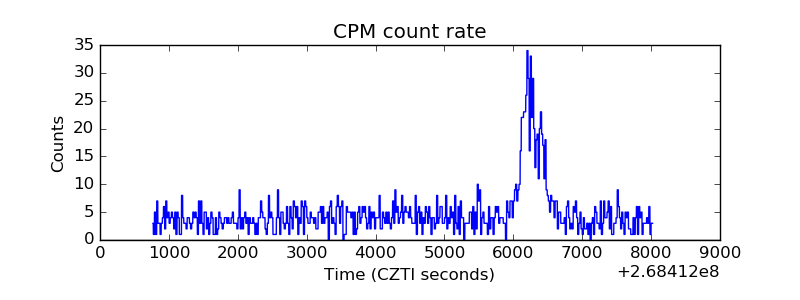 |
| CZT Counter | 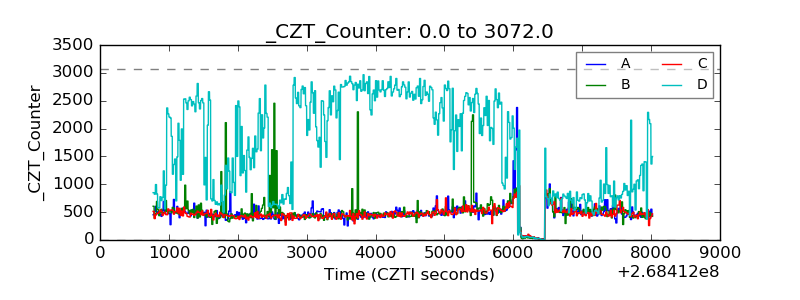 |
| +2.5 Volts monitor |  |
| +5 Volts monitor |  |
| _ROLL_ROT |  |
| _Roll_DEC | 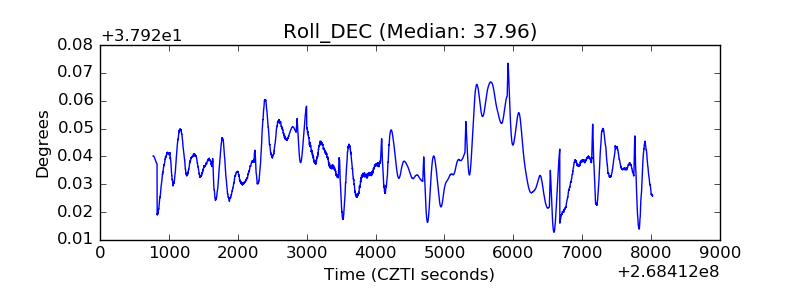 |
| _Roll_RA | 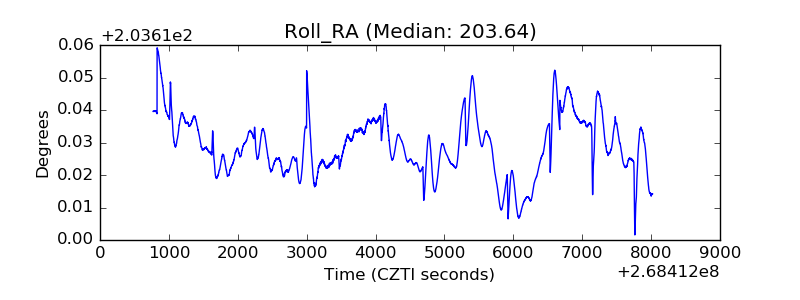 |
| Veto Counter | 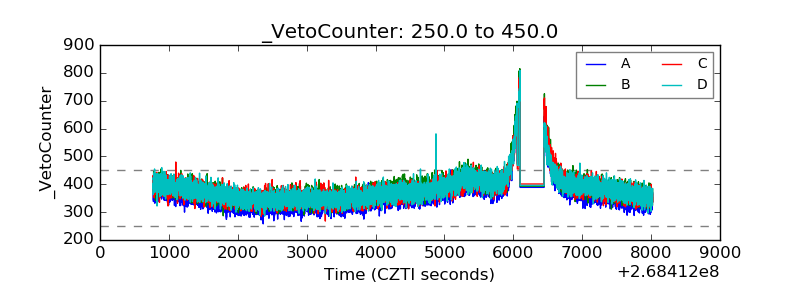 |