| Param | Original file | Final file |
|---|---|---|
| Filename | modeM0/AS1T02_056T01_9000002210_14960cztM0_level2.evt | modeM0/AS1T02_056T01_9000002210_14960cztM0_level2_quad_clean.evt |
| Size (bytes) | 1,968,955,200 | 227,142,720 |
| Size | 1.8 GB | 216.6 MB |
| Events in quadrant A | 9,013,591 | 1,467,753 |
| Events in quadrant B | 10,456,647 | 1,445,485 |
| Events in quadrant C | 8,993,645 | 1,439,936 |
| Events in quadrant D | 29,939,178 | 1,267,703 |
| Mode M0 | |||
|---|---|---|---|
| Quadrant | BADHDUFLAG | Total packets | Discarded packets |
| A | 0 | 38742 | 4 |
| B | 0 | 43115 | 3 |
| C | 0 | 38434 | 3 |
| D | 0 | 101448 | 3 |
| Mode M9 | |||
|---|---|---|---|
| Quadrant | BADHDUFLAG | Total packets | Discarded packets |
| A | 0 | 19 | 0 |
| B | 0 | 19 | 0 |
| C | 0 | 19 | 0 |
| D | 0 | 19 | 0 |
| Mode SS | |||
|---|---|---|---|
| Quadrant | BADHDUFLAG | Total packets | Discarded packets |
| A | 0 | 372 | 0 |
| B | 0 | 372 | 0 |
| C | 0 | 372 | 0 |
| D | 0 | 372 | 0 |
| Quadrant | Total seconds | Saturated seconds | Saturation percentage |
|---|---|---|---|
| A | 18242 | 104 | 0.570113% |
| B | 18242 | 486 | 2.664182% |
| C | 18242 | 56 | 0.306984% |
| D | 18242 | 6529 | 35.791032% |
Noise dominated data is calculated using 1-second bins in cleaned event files. If a bin has >2000 counts, and if more than 50% of those come from <1% of pixels, then it is considered to be noise-dominated and hence unusable.
| Quadrant | # 1 sec bins | Bins with >0 counts | Bins with >2000 counts | High rate bins dominated by noise | Noise dominated (total time) | Noise dominated (detector-on time) | Marked lightcurve |
|---|---|---|---|---|---|---|---|
| A | 20193 | 18246 | 6 | 6 | 0.03% | 0.03% | 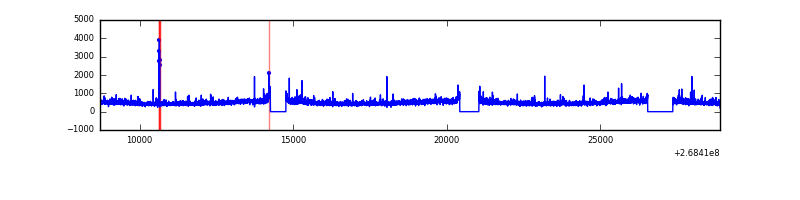 |
| B | 20193 | 18246 | 259 | 259 | 1.28% | 1.42% | 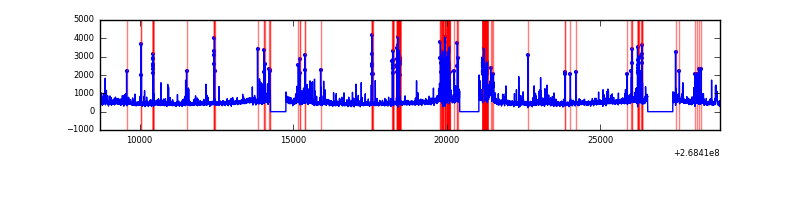 |
| C | 20193 | 18246 | 1 | 1 | 0.00% | 0.01% | 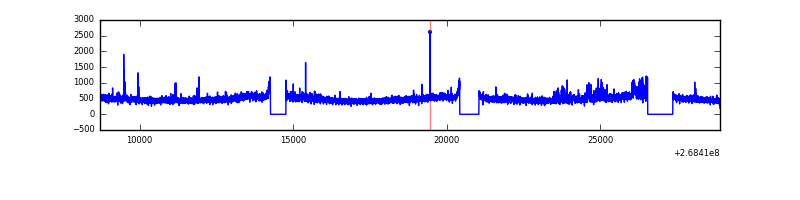 |
| D | 20193 | 18246 | 6516 | 6516 | 32.27% | 35.71% | 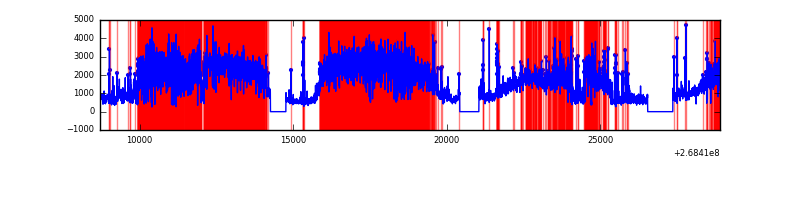 |
Top three noisy pixels from each quadrant. If the there are fewer than three noisy pixels in the level2.evt file, extra rows are filled as -1
| Pixel properties | Quadrant properties | ||||||
|---|---|---|---|---|---|---|---|
| Quadrant | DetID | PixID | Counts | Sigma | Mean | Median | Sigma |
| A | 1 | 162 | 242056 | 553.18 | 2142 | 2098 | 433.8 |
| A | 12 | 189 | 176322 | 401.64 | 2142 | 2098 | 433.8 |
| A | 1 | 178 | 113068 | 255.82 | 2142 | 2098 | 433.8 |
| B | 10 | 16 | 757168 | 1890.27 | 2115 | 2061 | 399.5 |
| B | 3 | 64 | 708848 | 1769.31 | 2115 | 2061 | 399.5 |
| B | 0 | 189 | 195842 | 485.09 | 2115 | 2061 | 399.5 |
| C | 3 | 233 | 523506 | 1086.95 | 2078 | 2090 | 479.7 |
| C | 7 | 247 | 339450 | 703.27 | 2078 | 2090 | 479.7 |
| C | 14 | 234 | 20743 | 38.88 | 2078 | 2090 | 479.7 |
| D | 7 | 254 | 21948669 | 45267.75 | 1814 | 1779 | 484.8 |
| D | 7 | 38 | 339682 | 696.96 | 1814 | 1779 | 484.8 |
| D | 13 | 249 | 142767 | 290.8 | 1814 | 1779 | 484.8 |
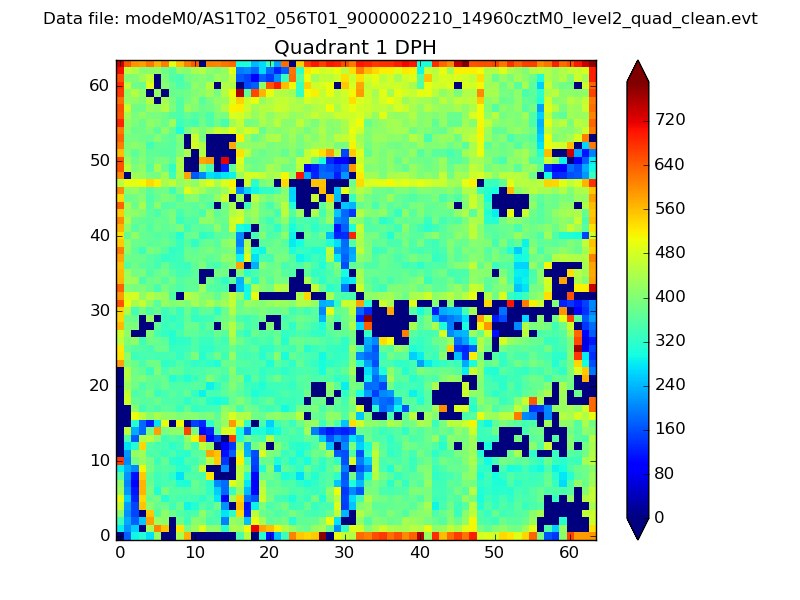
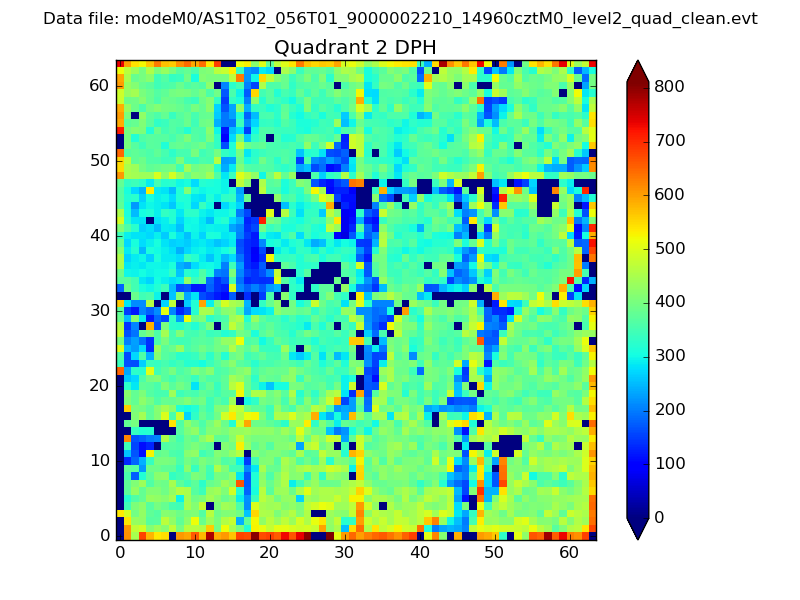
Histogram calculated using DETX and DETY for each event in the final _common_clean file
| Quadrant A |  |
 |
Quadrant B |
|---|---|---|---|
| Quadrant D |  |
 |
Quadrant C |
| Plot type | Count rate plots | Images |
|---|---|---|
| Comparison with Poisson distribution Blue bars denote a histogram of data divided into 1 sec bins. Red curve is a Poisson curve with rate = median count rate of data. |
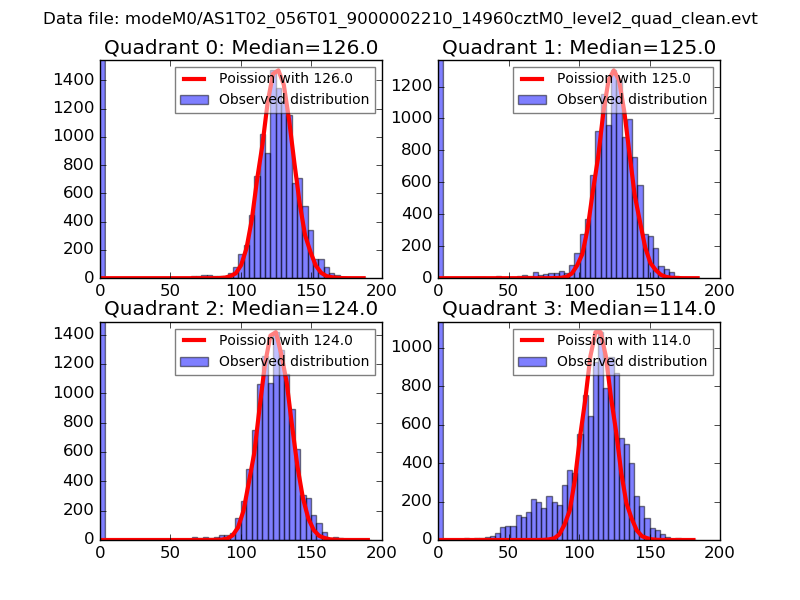 |
 |
| Quadrant-wise count rates Data is divided into 100 sec bins |
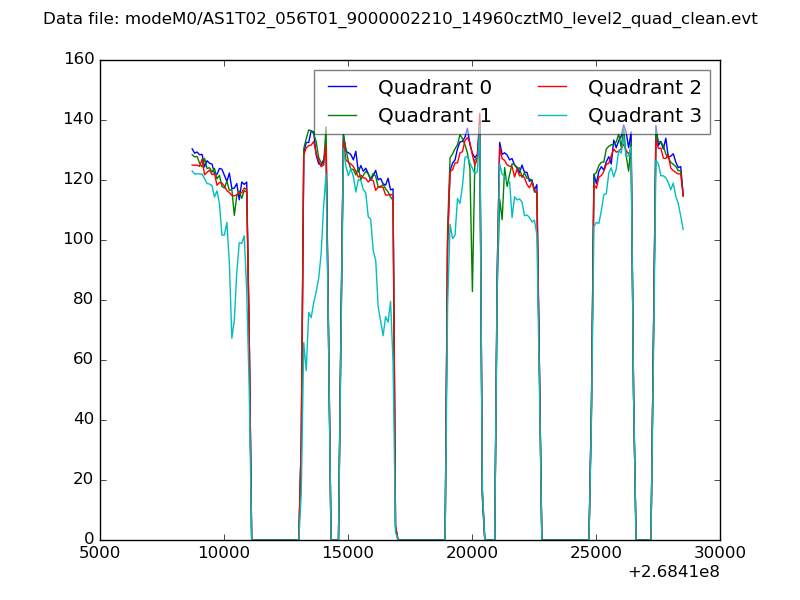 |
|
| Module-wise count rates for Quadrant A Data is divided into 100 sec bins |
 |
 |
| Module-wise count rates for Quadrant B Data is divided into 100 sec bins |
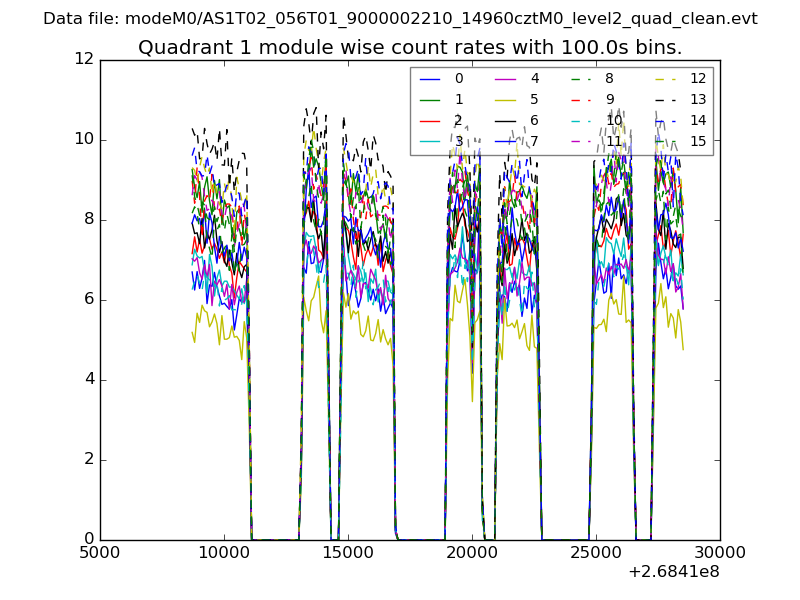 |
 |
| Module-wise count rates for Quadrant C Data is divided into 100 sec bins |
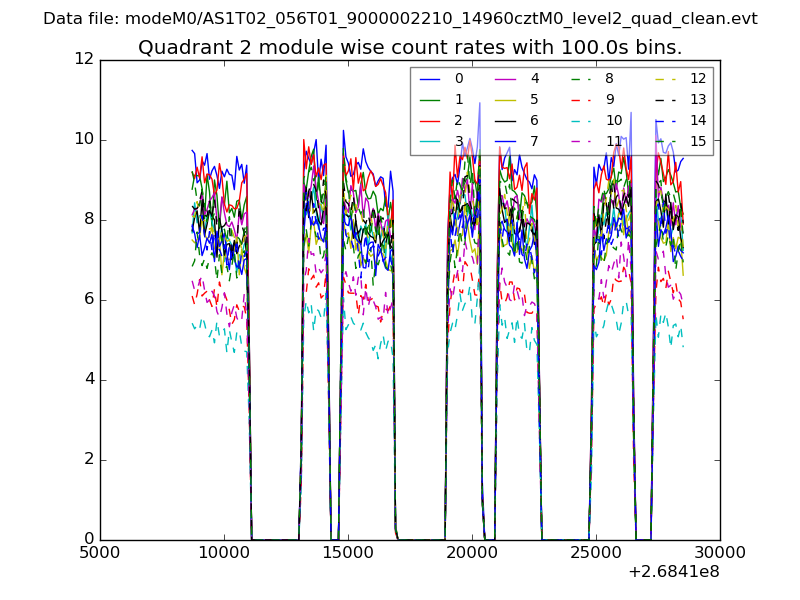 |
 |
| Module-wise count rates for Quadrant D Data is divided into 100 sec bins |
 |
 |
| Parameter | Plot |
|---|---|
| CZT HV Monitor |  |
| D_VDD | 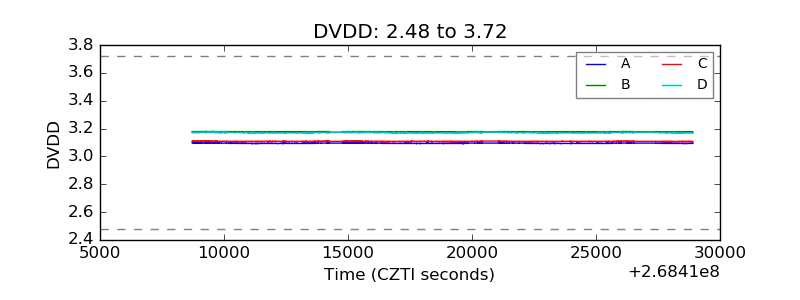 |
| Temperature 1 | 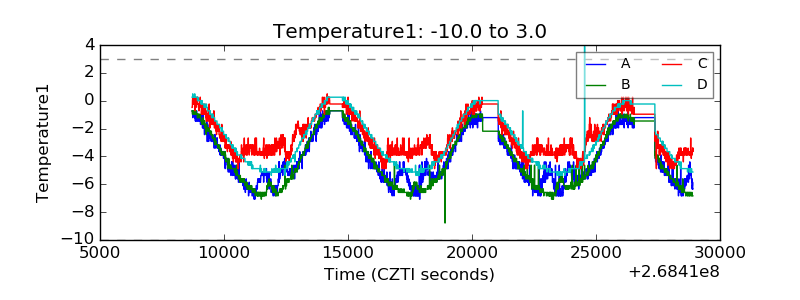 |
| Veto HV Monitor | 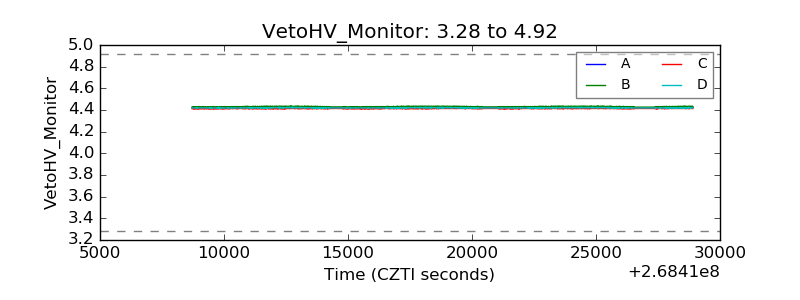 |
| Veto LLD |  |
| Alpha Counter | 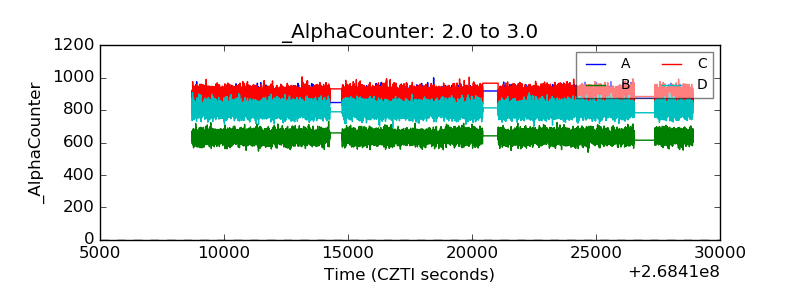 |
| _CPM_Rate | 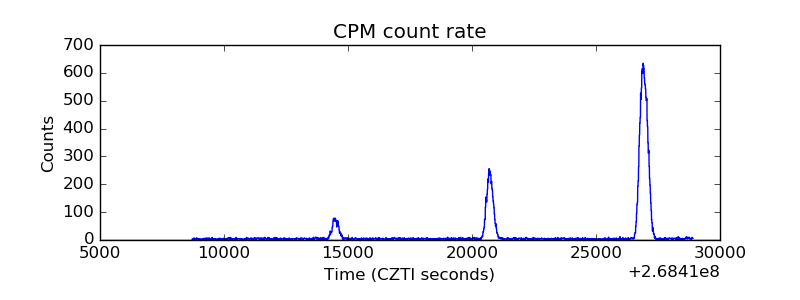 |
| CZT Counter |  |
| +2.5 Volts monitor |  |
| +5 Volts monitor |  |
| _ROLL_ROT | 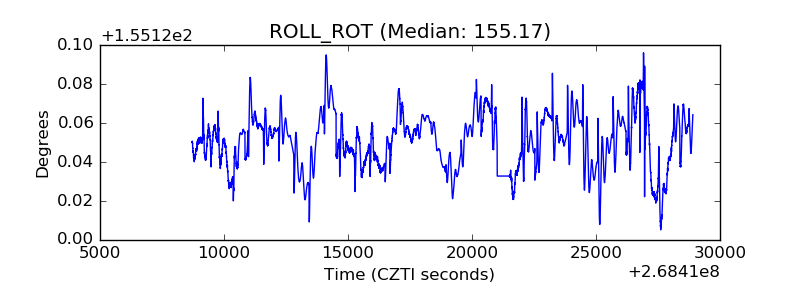 |
| _Roll_DEC | 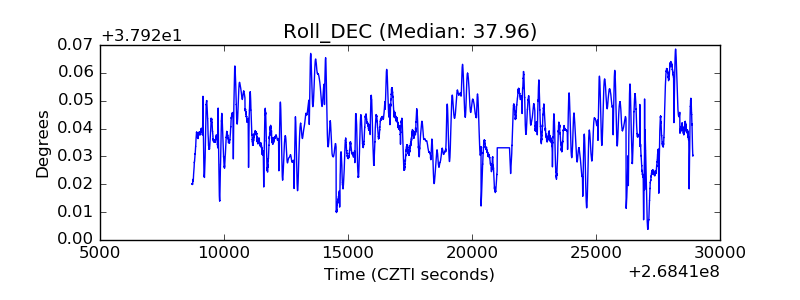 |
| _Roll_RA | 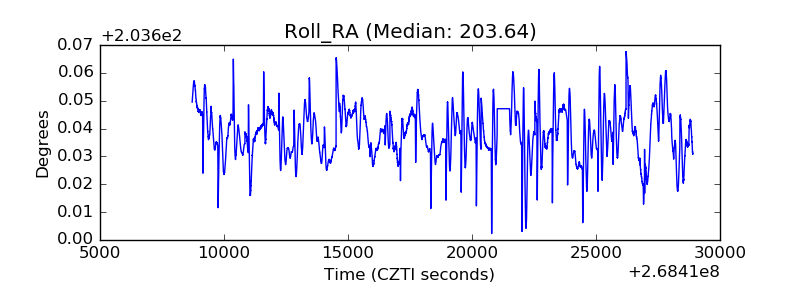 |
| Veto Counter | 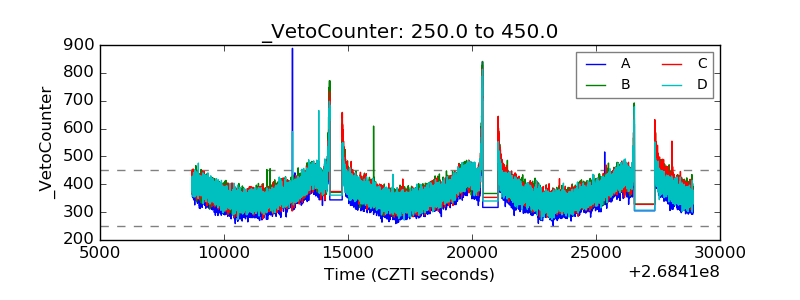 |