| Param | Original file | Final file |
|---|---|---|
| Filename | modeM0/AS1T02_056T01_9000002210_14962cztM0_level2.evt | modeM0/AS1T02_056T01_9000002210_14962cztM0_level2_quad_clean.evt |
| Size (bytes) | 811,042,560 | 70,295,040 |
| Size | 773.5 MB | 67.0 MB |
| Events in quadrant A | 3,383,127 | 469,269 |
| Events in quadrant B | 3,695,847 | 463,135 |
| Events in quadrant C | 3,361,198 | 458,868 |
| Events in quadrant D | 13,680,800 | 280,453 |
| Mode M0 | |||
|---|---|---|---|
| Quadrant | BADHDUFLAG | Total packets | Discarded packets |
| A | 0 | 14059 | 3 |
| B | 0 | 14960 | 2 |
| C | 0 | 14151 | 2 |
| D | 0 | 45252 | 2 |
| Mode M9 | |||
|---|---|---|---|
| Quadrant | BADHDUFLAG | Total packets | Discarded packets |
| A | 0 | 13 | 0 |
| B | 0 | 13 | 0 |
| C | 0 | 13 | 0 |
| D | 0 | 14 | 0 |
| Mode SS | |||
|---|---|---|---|
| Quadrant | BADHDUFLAG | Total packets | Discarded packets |
| A | 0 | 132 | 0 |
| B | 0 | 132 | 0 |
| C | 0 | 132 | 0 |
| D | 0 | 132 | 0 |
| Quadrant | Total seconds | Saturated seconds | Saturation percentage |
|---|---|---|---|
| A | 6534 | 44 | 0.673401% |
| B | 6534 | 155 | 2.372207% |
| C | 6534 | 37 | 0.566269% |
| D | 6534 | 4263 | 65.243343% |
Noise dominated data is calculated using 1-second bins in cleaned event files. If a bin has >2000 counts, and if more than 50% of those come from <1% of pixels, then it is considered to be noise-dominated and hence unusable.
| Quadrant | # 1 sec bins | Bins with >0 counts | Bins with >2000 counts | High rate bins dominated by noise | Noise dominated (total time) | Noise dominated (detector-on time) | Marked lightcurve |
|---|---|---|---|---|---|---|---|
| A | 7615 | 6536 | 2 | 2 | 0.03% | 0.03% | 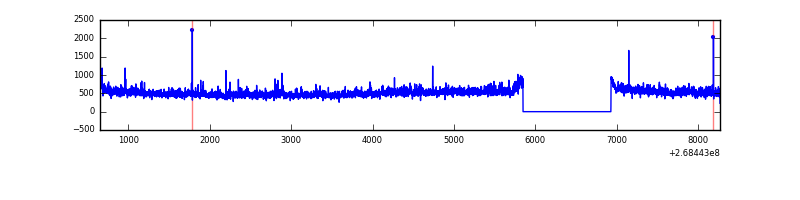 |
| B | 7615 | 6536 | 66 | 66 | 0.87% | 1.01% | 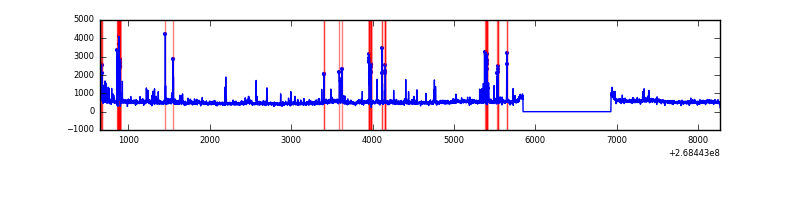 |
| C | 7615 | 6536 | 0 | 0 | 0.00% | 0.00% | 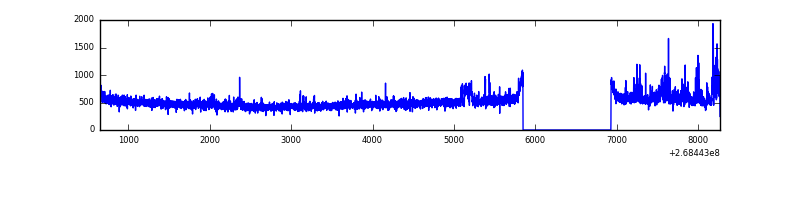 |
| D | 7615 | 6536 | 4054 | 4054 | 53.24% | 62.03% | 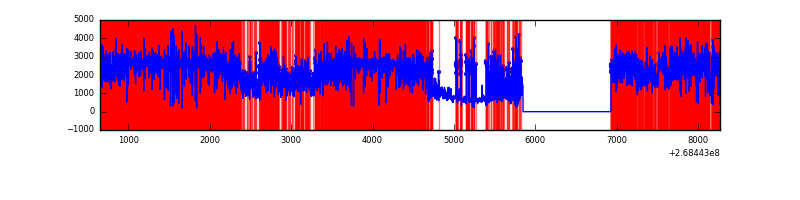 |
Top three noisy pixels from each quadrant. If the there are fewer than three noisy pixels in the level2.evt file, extra rows are filled as -1
| Pixel properties | Quadrant properties | ||||||
|---|---|---|---|---|---|---|---|
| Quadrant | DetID | PixID | Counts | Sigma | Mean | Median | Sigma |
| A | 12 | 189 | 113138 | 698.4 | 798 | 780 | 160.9 |
| A | 1 | 162 | 87371 | 538.24 | 798 | 780 | 160.9 |
| A | 1 | 178 | 41972 | 256.04 | 798 | 780 | 160.9 |
| B | 10 | 16 | 200473 | 1330.42 | 793 | 773 | 150.1 |
| B | 3 | 64 | 170581 | 1131.27 | 793 | 773 | 150.1 |
| B | 0 | 229 | 92677 | 612.27 | 793 | 773 | 150.1 |
| C | 7 | 247 | 218012 | 1217.8 | 774 | 778 | 178.4 |
| C | 3 | 233 | 119521 | 665.67 | 774 | 778 | 178.4 |
| C | 13 | 61 | 5533 | 26.66 | 774 | 778 | 178.4 |
| D | 7 | 254 | 11364497 | 84645.43 | 555 | 539 | 134.3 |
| D | 10 | 70 | 91770 | 679.54 | 555 | 539 | 134.3 |
| D | 13 | 249 | 55457 | 409.06 | 555 | 539 | 134.3 |
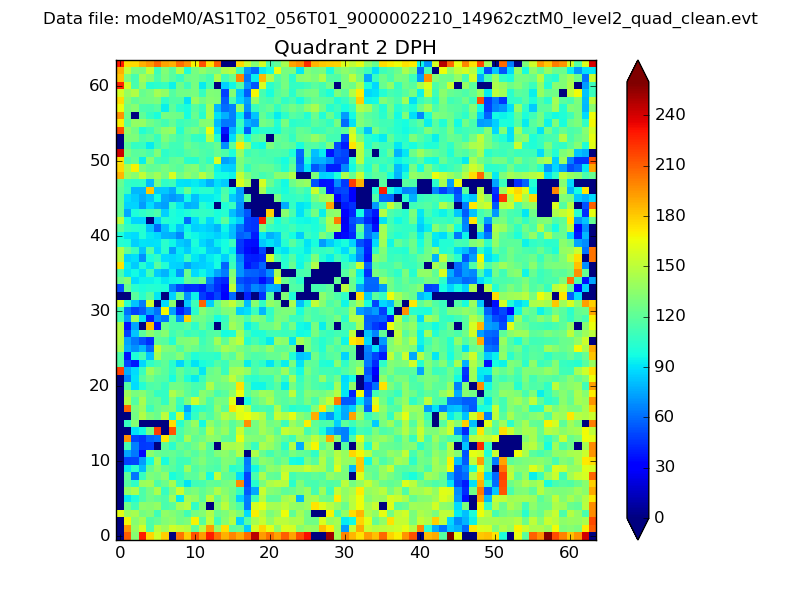
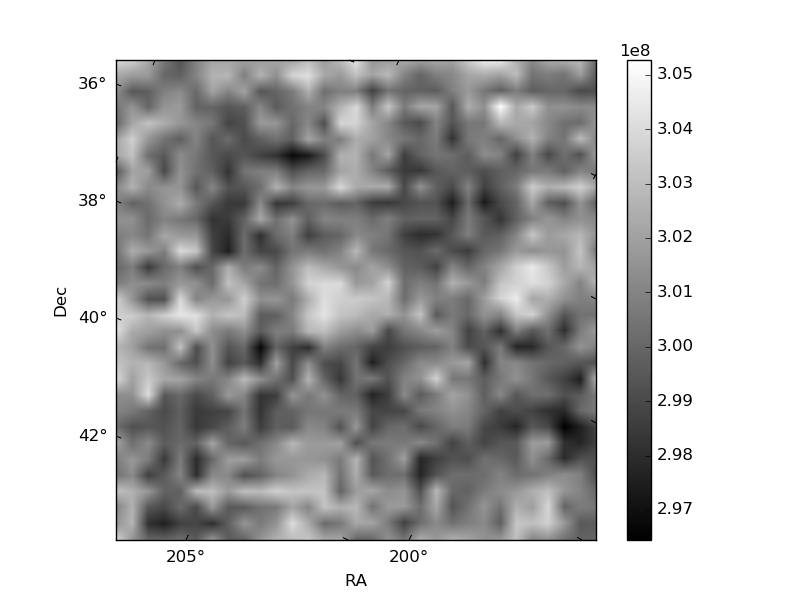
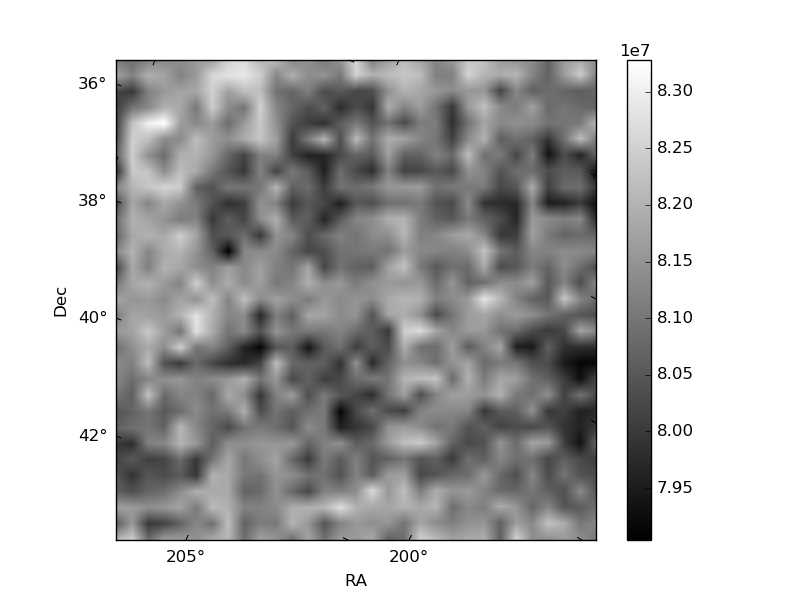
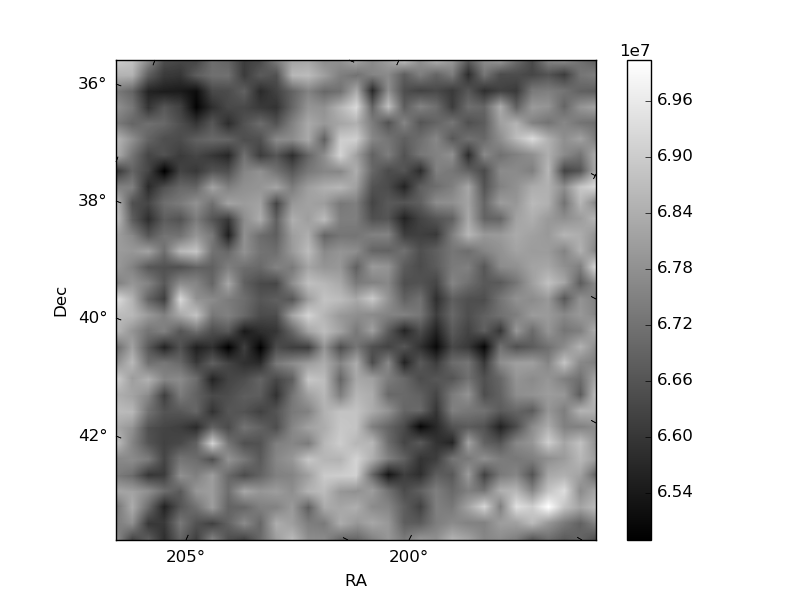
Histogram calculated using DETX and DETY for each event in the final _common_clean file
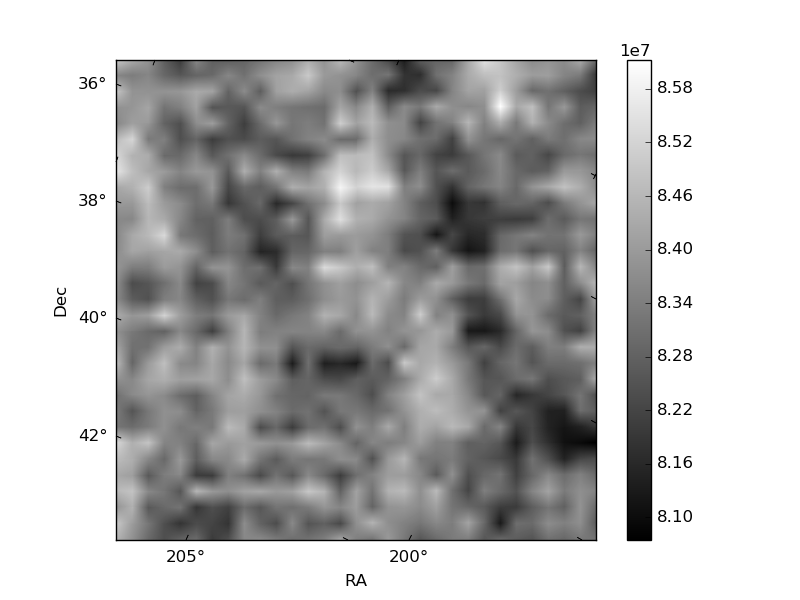
| Quadrant A | 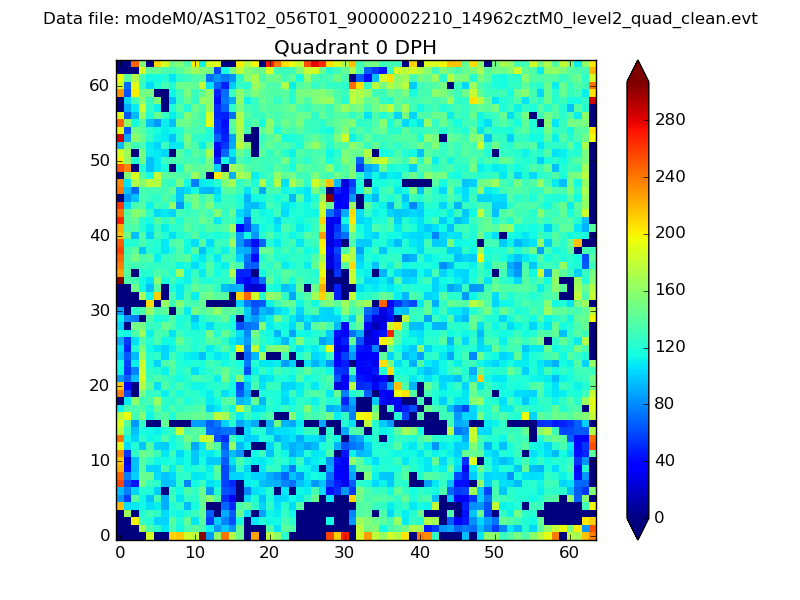 |
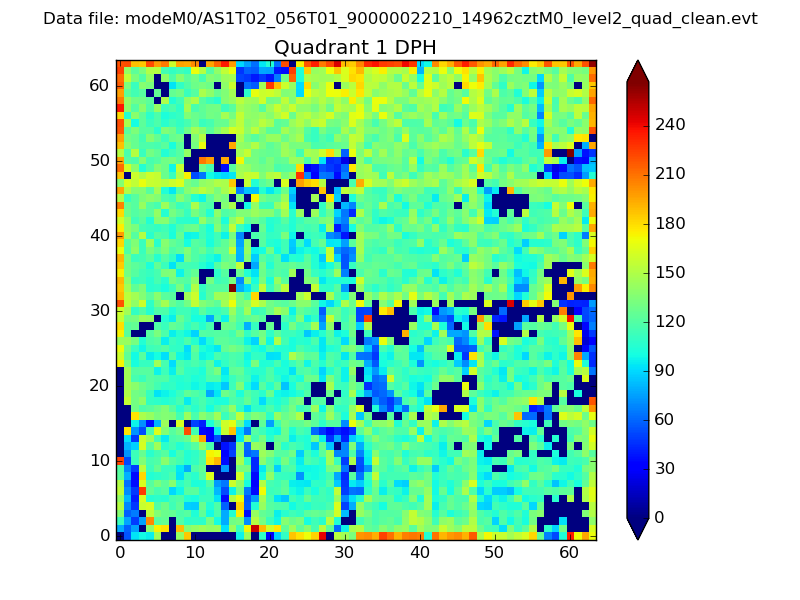 |
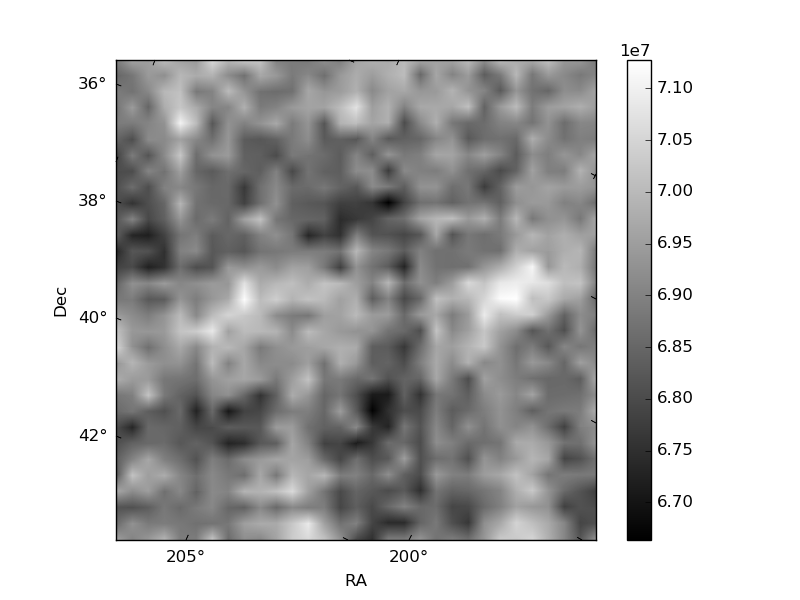
Quadrant B |
|---|---|---|---|
| Quadrant D | 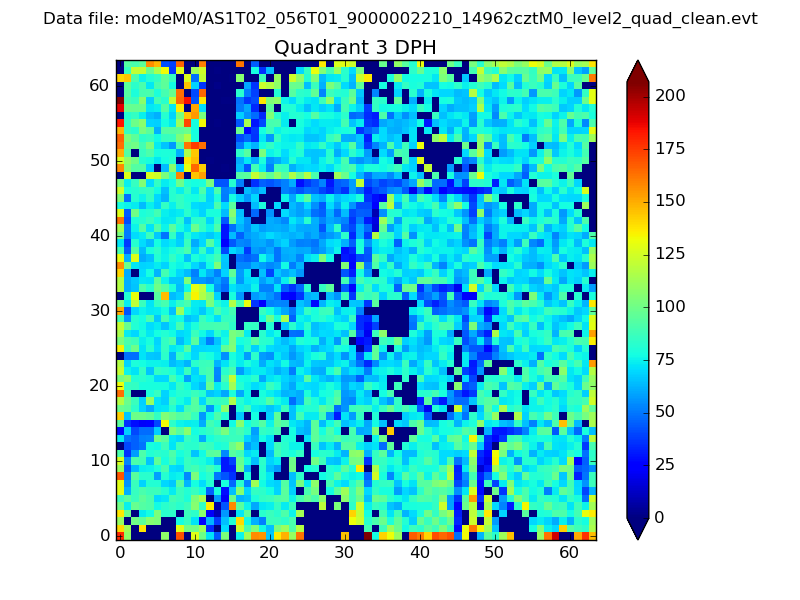 |
 |
Quadrant C |
| Plot type | Count rate plots | Images |
|---|---|---|
| Comparison with Poisson distribution Blue bars denote a histogram of data divided into 1 sec bins. Red curve is a Poisson curve with rate = median count rate of data. |
 |
 |
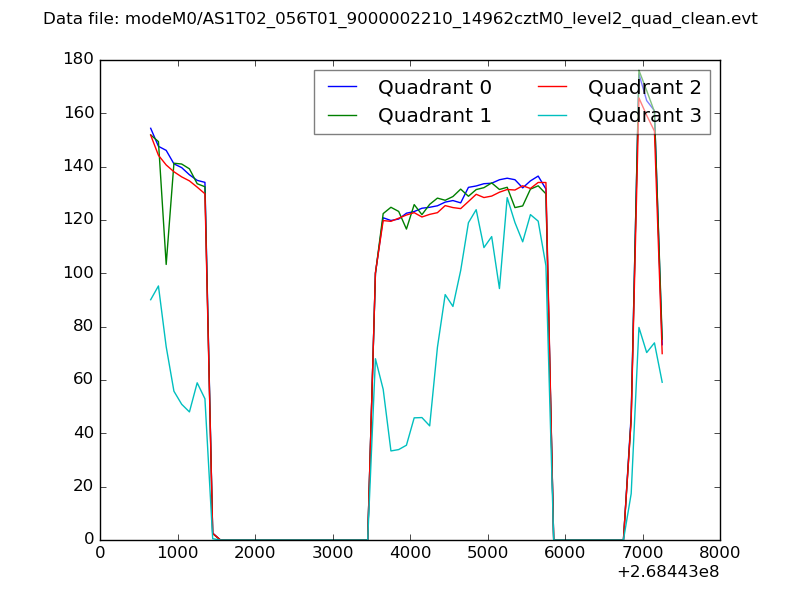
| Quadrant-wise count rates Data is divided into 100 sec bins |
 |
|
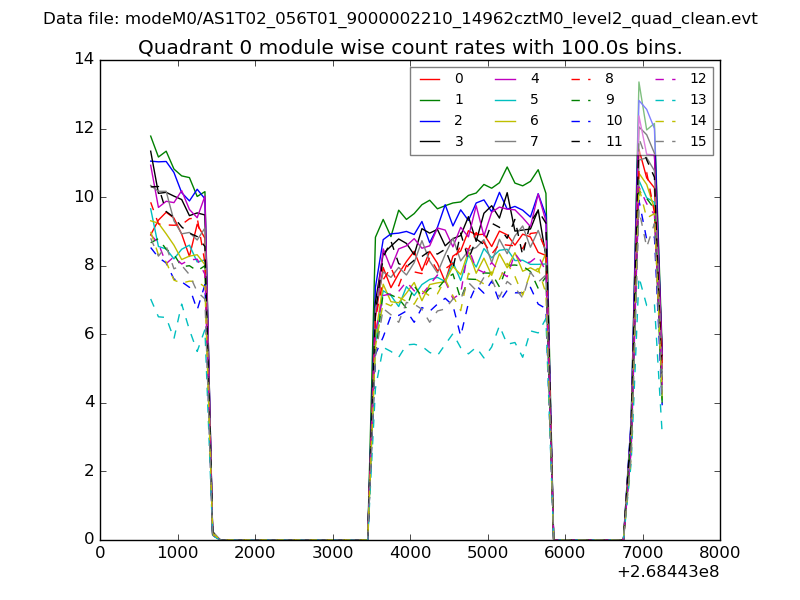
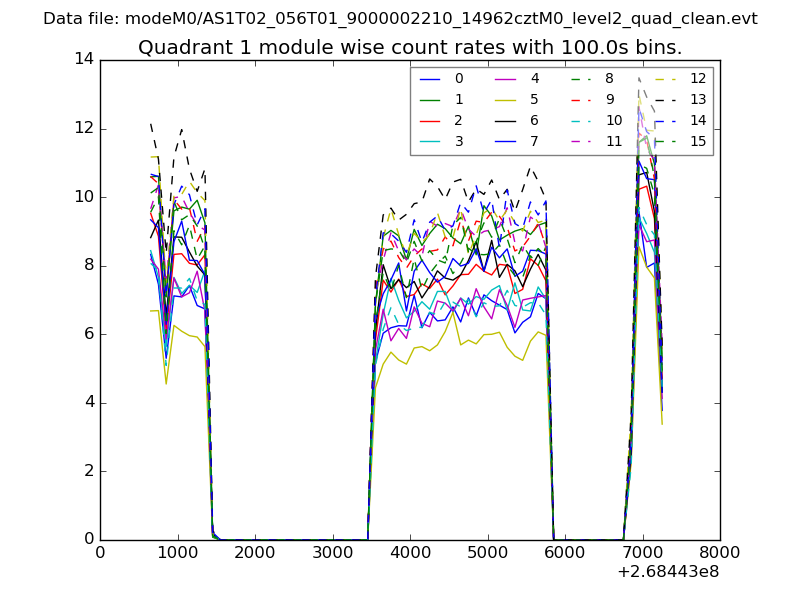
| Module-wise count rates for Quadrant A Data is divided into 100 sec bins |
 |
 |
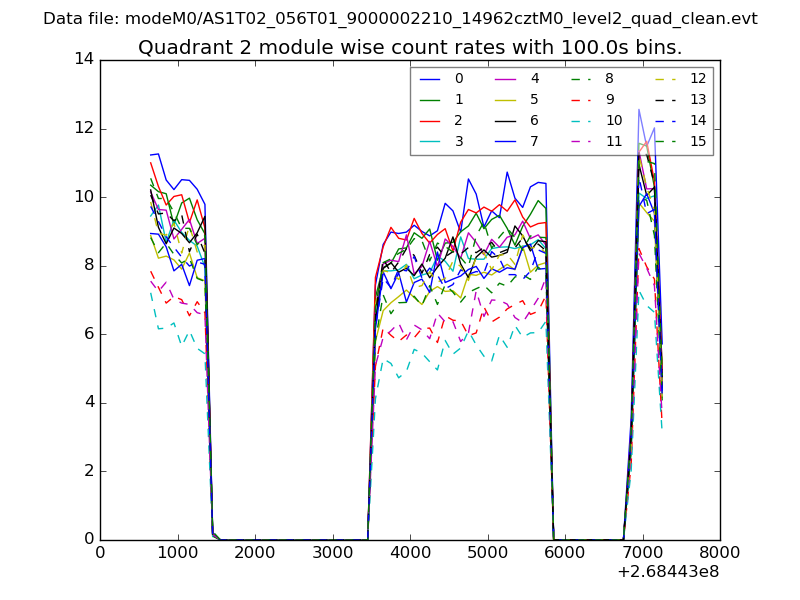
| Module-wise count rates for Quadrant B Data is divided into 100 sec bins |
 |
 |
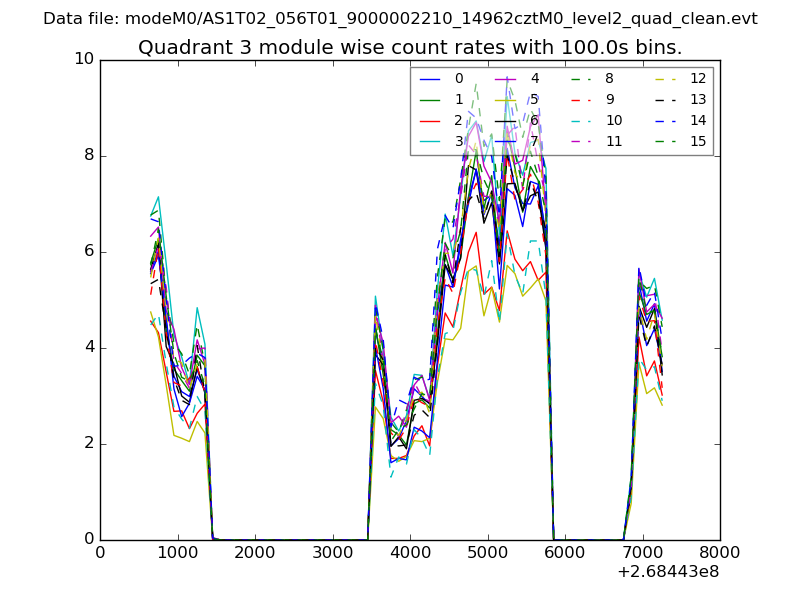
| Module-wise count rates for Quadrant C Data is divided into 100 sec bins |
 |
 |
| Module-wise count rates for Quadrant D Data is divided into 100 sec bins |
 |
 |
| Parameter | Plot |
|---|---|
| CZT HV Monitor | 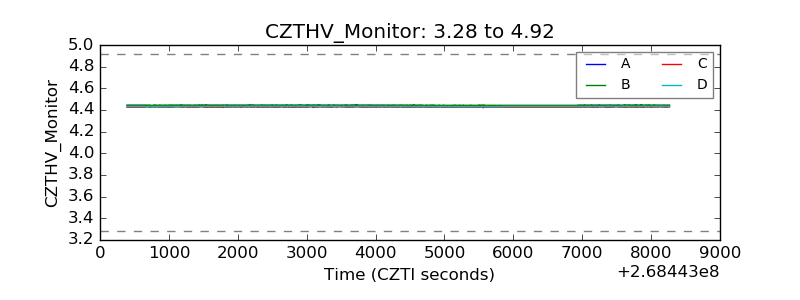 |
| D_VDD |  |
| Temperature 1 | 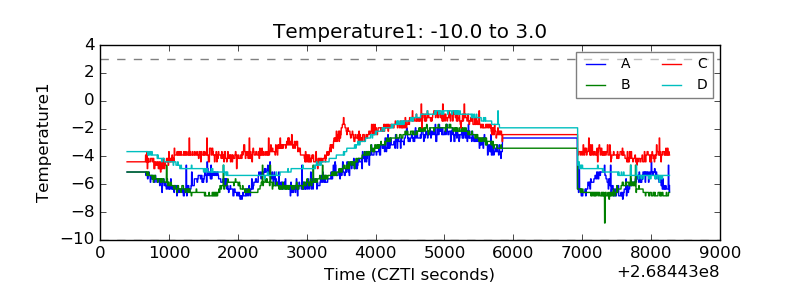 |
| Veto HV Monitor | 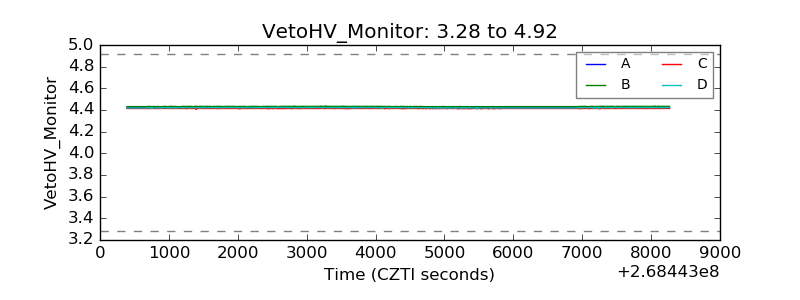 |
| Veto LLD | 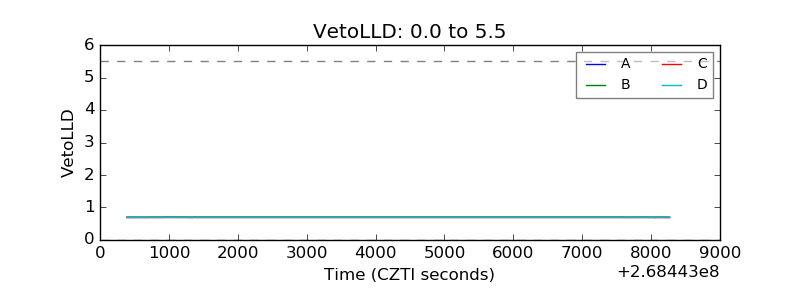 |
| Alpha Counter | 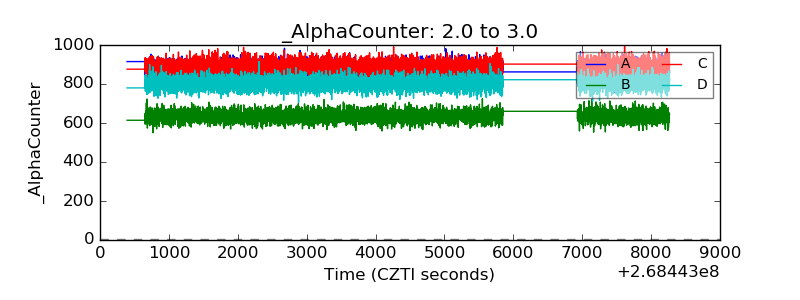 |
| _CPM_Rate | 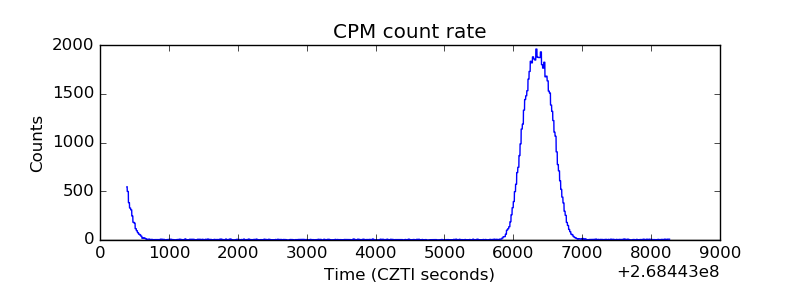 |
| CZT Counter | 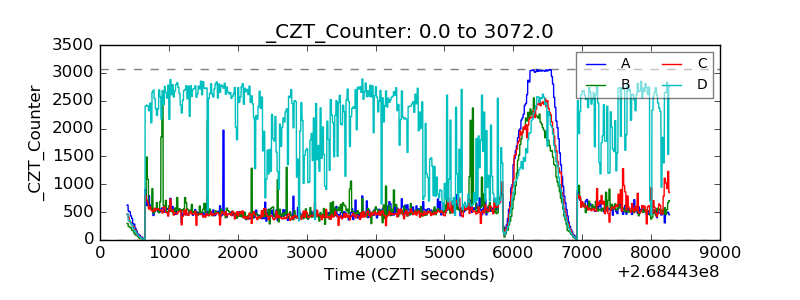 |
| +2.5 Volts monitor |  |
| +5 Volts monitor |  |
| _ROLL_ROT | 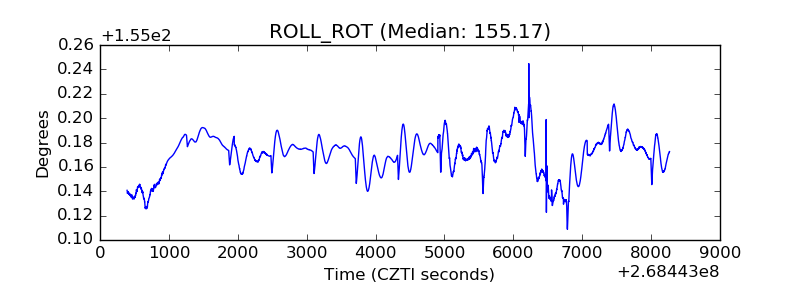 |
| _Roll_DEC | 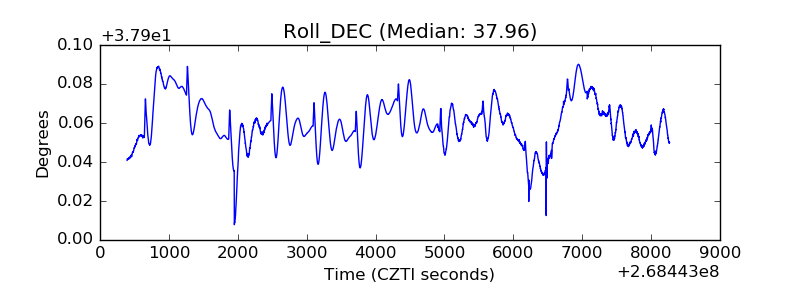 |
| _Roll_RA | 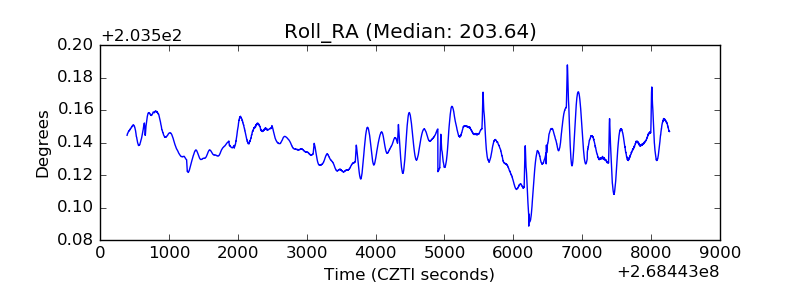 |
| Veto Counter | 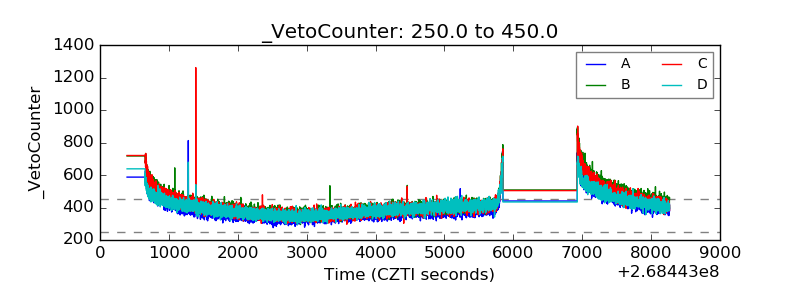 |