| Param | Original file | Final file |
|---|---|---|
| Filename | modeM0/AS1T02_056T01_9000002210_14964cztM0_level2.evt | modeM0/AS1T02_056T01_9000002210_14964cztM0_level2_quad_clean.evt |
| Size (bytes) | 828,889,920 | 61,692,480 |
| Size | 790.5 MB | 58.8 MB |
| Events in quadrant A | 3,598,863 | 400,321 |
| Events in quadrant B | 3,839,834 | 394,164 |
| Events in quadrant C | 3,454,993 | 390,041 |
| Events in quadrant D | 13,768,337 | 226,890 |
| Mode M0 | |||
|---|---|---|---|
| Quadrant | BADHDUFLAG | Total packets | Discarded packets |
| A | 0 | 14705 | 3 |
| B | 0 | 15356 | 2 |
| C | 0 | 14219 | 2 |
| D | 0 | 45399 | 2 |
| Mode M9 | |||
|---|---|---|---|
| Quadrant | BADHDUFLAG | Total packets | Discarded packets |
| A | 0 | 17 | 0 |
| B | 0 | 17 | 0 |
| C | 0 | 17 | 0 |
| D | 0 | 18 | 0 |
| Mode SS | |||
|---|---|---|---|
| Quadrant | BADHDUFLAG | Total packets | Discarded packets |
| A | 0 | 132 | 0 |
| B | 0 | 132 | 0 |
| C | 0 | 132 | 0 |
| D | 0 | 132 | 0 |
| Quadrant | Total seconds | Saturated seconds | Saturation percentage |
|---|---|---|---|
| A | 6531 | 39 | 0.597152% |
| B | 6531 | 175 | 2.679528% |
| C | 6531 | 13 | 0.199051% |
| D | 6531 | 4159 | 63.680906% |
Noise dominated data is calculated using 1-second bins in cleaned event files. If a bin has >2000 counts, and if more than 50% of those come from <1% of pixels, then it is considered to be noise-dominated and hence unusable.
| Quadrant | # 1 sec bins | Bins with >0 counts | Bins with >2000 counts | High rate bins dominated by noise | Noise dominated (total time) | Noise dominated (detector-on time) | Marked lightcurve |
|---|---|---|---|---|---|---|---|
| A | 7742 | 6533 | 1 | 1 | 0.01% | 0.02% | 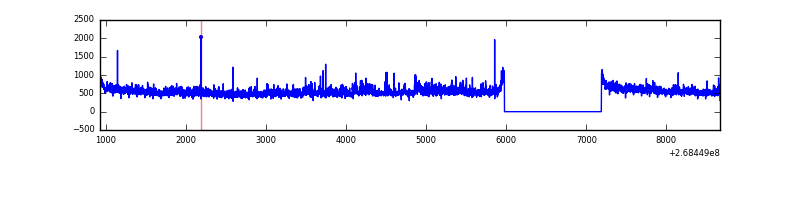 |
| B | 7742 | 6533 | 105 | 105 | 1.36% | 1.61% | 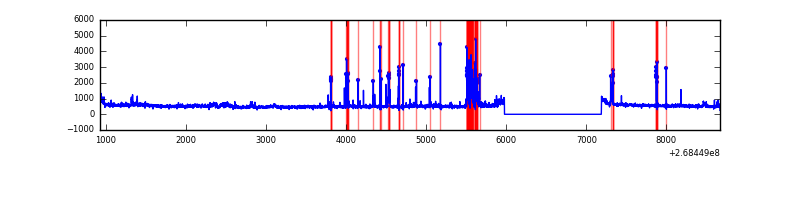 |
| C | 7742 | 6533 | 0 | 0 | 0.00% | 0.00% | 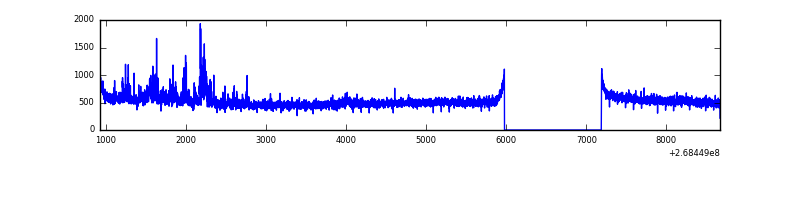 |
| D | 7742 | 6532 | 3967 | 3967 | 51.24% | 60.73% | 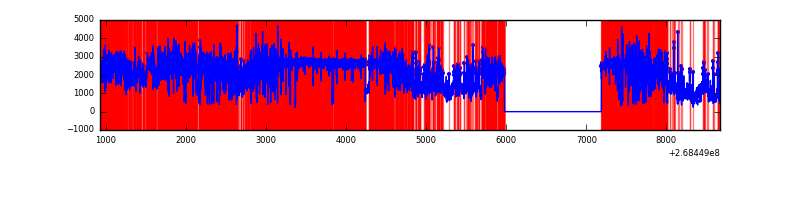 |
Top three noisy pixels from each quadrant. If the there are fewer than three noisy pixels in the level2.evt file, extra rows are filled as -1
| Pixel properties | Quadrant properties | ||||||
|---|---|---|---|---|---|---|---|
| Quadrant | DetID | PixID | Counts | Sigma | Mean | Median | Sigma |
| A | 12 | 189 | 126197 | 746.77 | 835 | 820 | 167.9 |
| A | 1 | 162 | 114125 | 674.87 | 835 | 820 | 167.9 |
| A | 1 | 178 | 56009 | 328.72 | 835 | 820 | 167.9 |
| B | 3 | 64 | 354011 | 2253.33 | 829 | 810 | 156.7 |
| B | 10 | 16 | 161183 | 1023.14 | 829 | 810 | 156.7 |
| B | 4 | 48 | 30337 | 188.37 | 829 | 810 | 156.7 |
| C | 7 | 247 | 197080 | 1062.16 | 801 | 806 | 184.8 |
| C | 3 | 233 | 118229 | 635.45 | 801 | 806 | 184.8 |
| C | 8 | 128 | 10845 | 54.33 | 801 | 806 | 184.8 |
| D | 7 | 254 | 11330935 | 83279.66 | 563 | 547 | 136.1 |
| D | 7 | 223 | 128342 | 939.31 | 563 | 547 | 136.1 |
| D | 9 | 1 | 58755 | 427.84 | 563 | 547 | 136.1 |
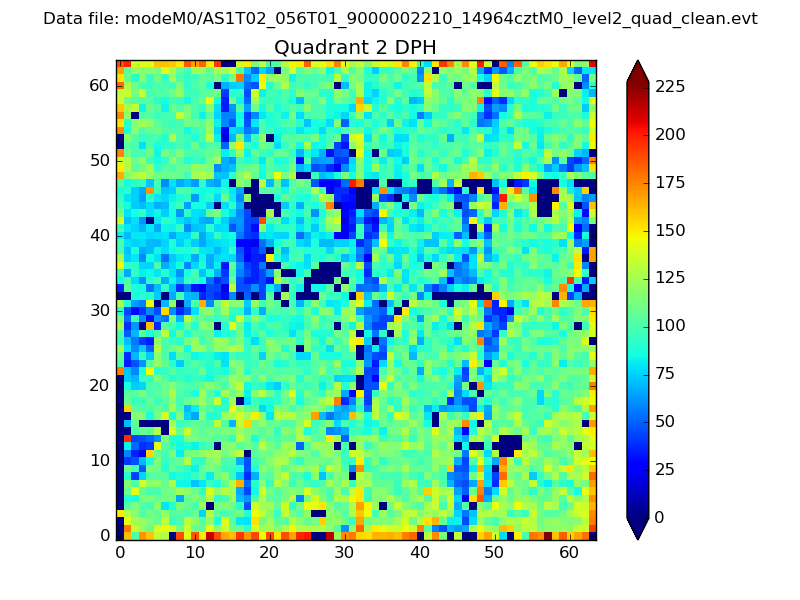
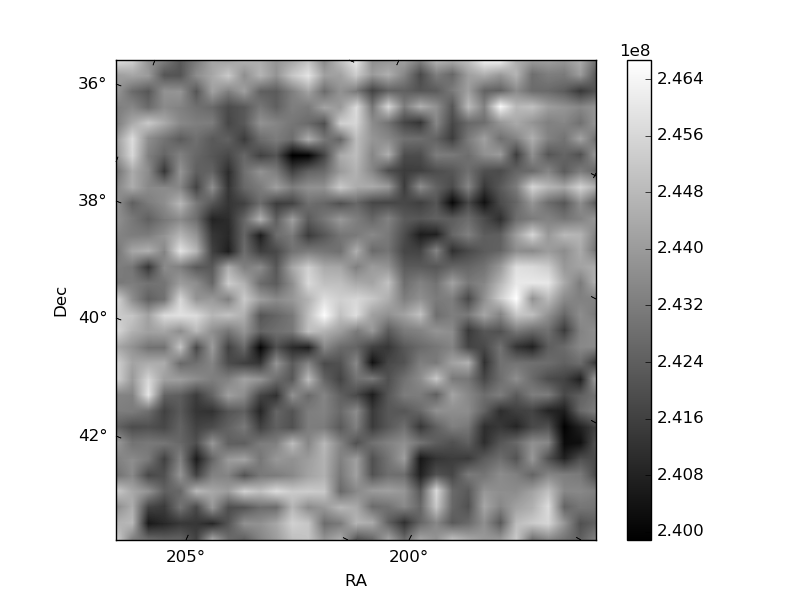
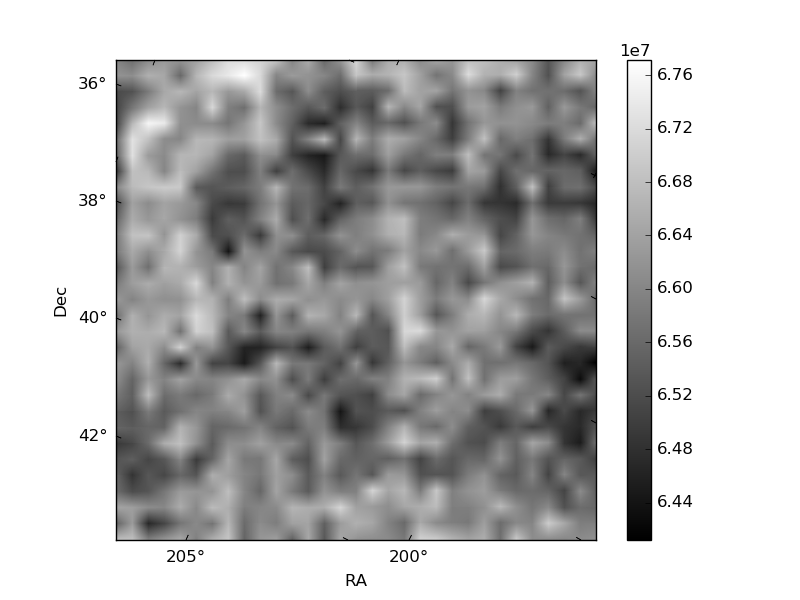
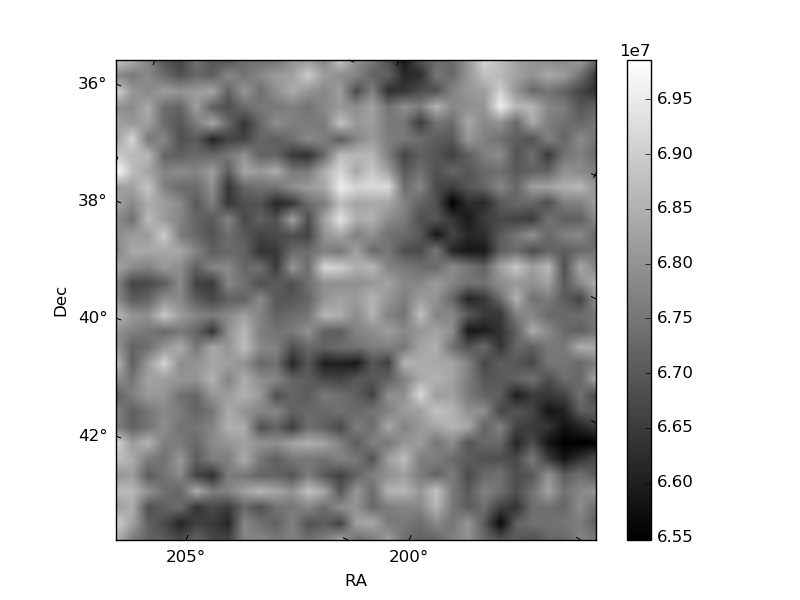
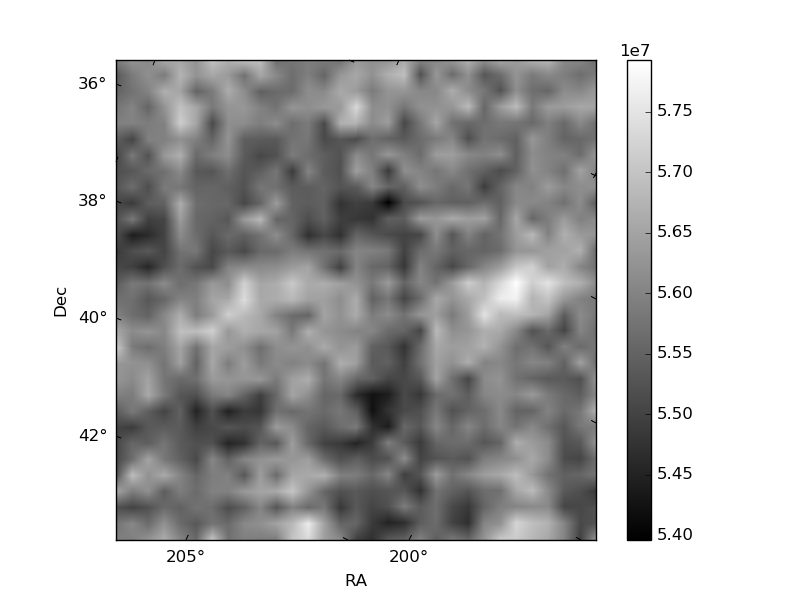
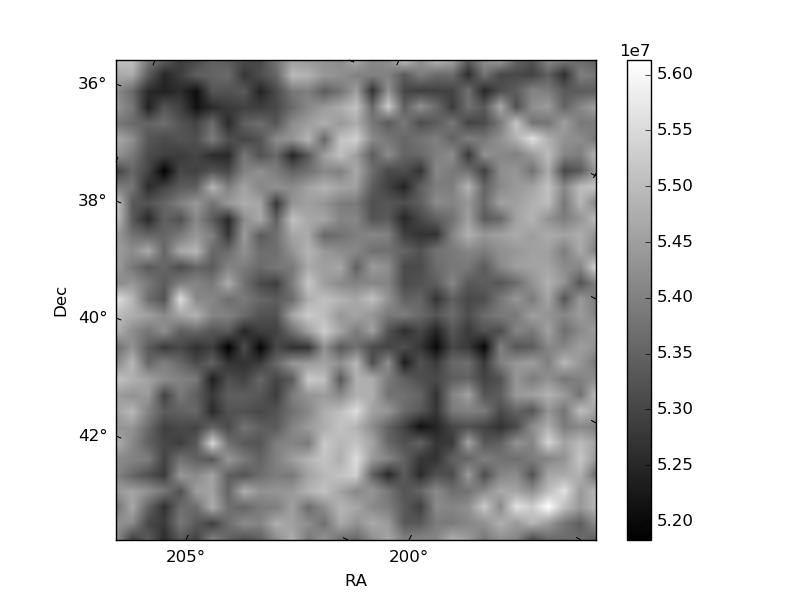
Histogram calculated using DETX and DETY for each event in the final _common_clean file
| Quadrant A | 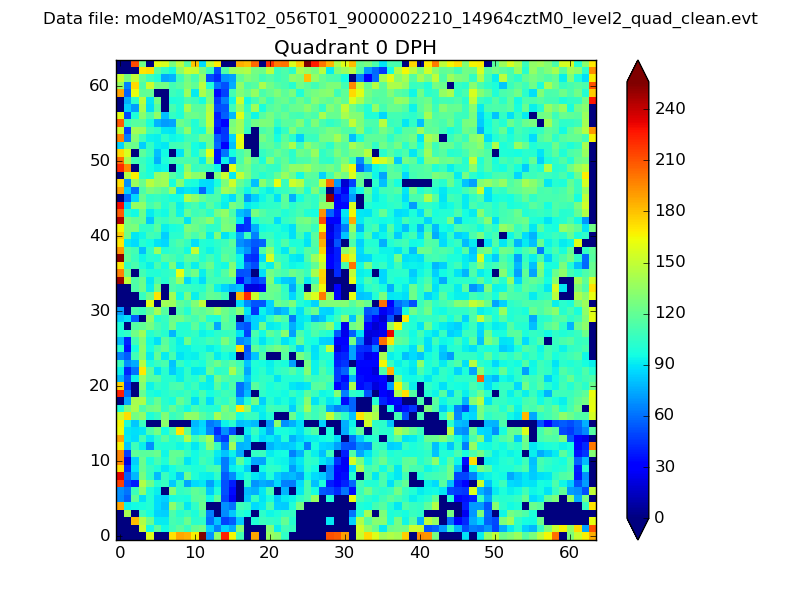 |
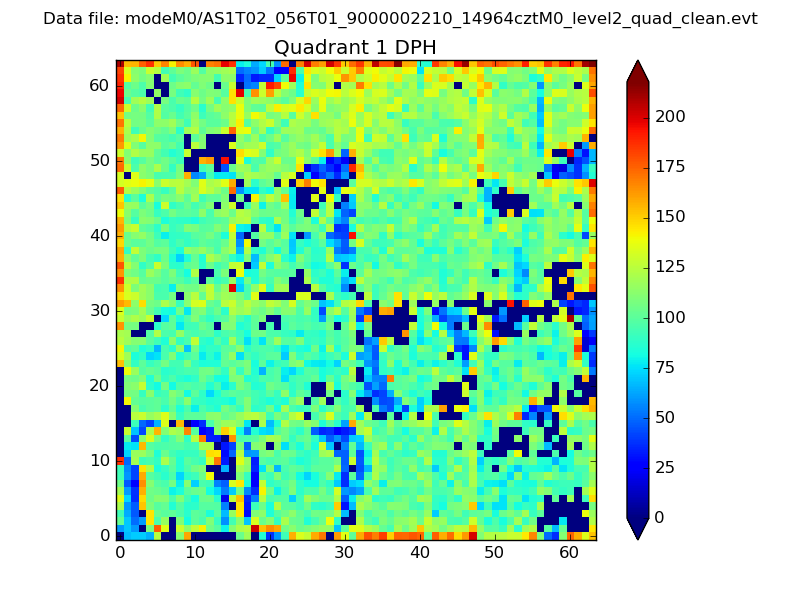 |
Quadrant B |
|---|---|---|---|
| Quadrant D | 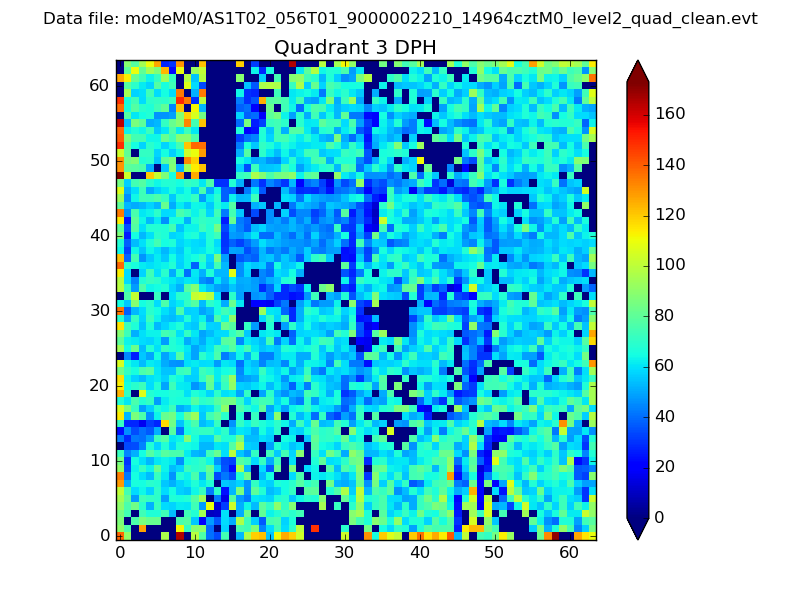 |
 |
Quadrant C |
| Plot type | Count rate plots | Images |
|---|---|---|
| Comparison with Poisson distribution Blue bars denote a histogram of data divided into 1 sec bins. Red curve is a Poisson curve with rate = median count rate of data. |
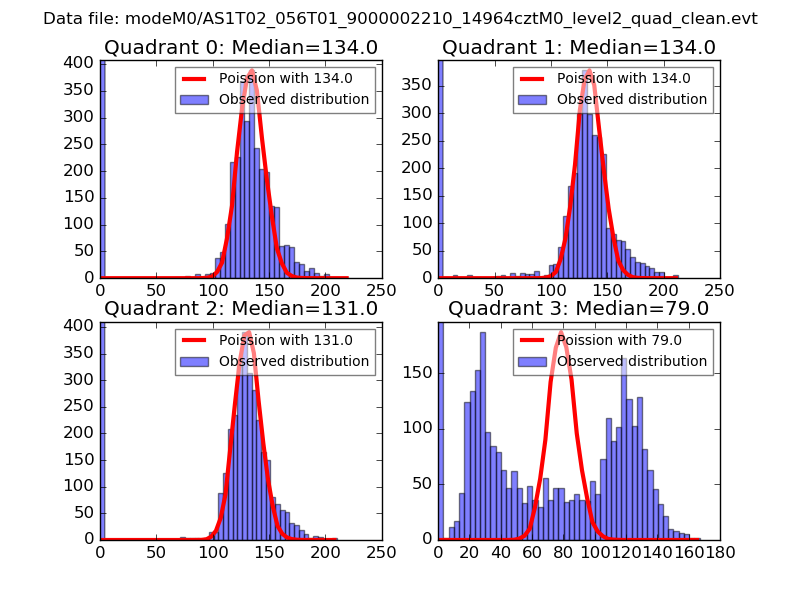 |
 |
| Quadrant-wise count rates Data is divided into 100 sec bins |
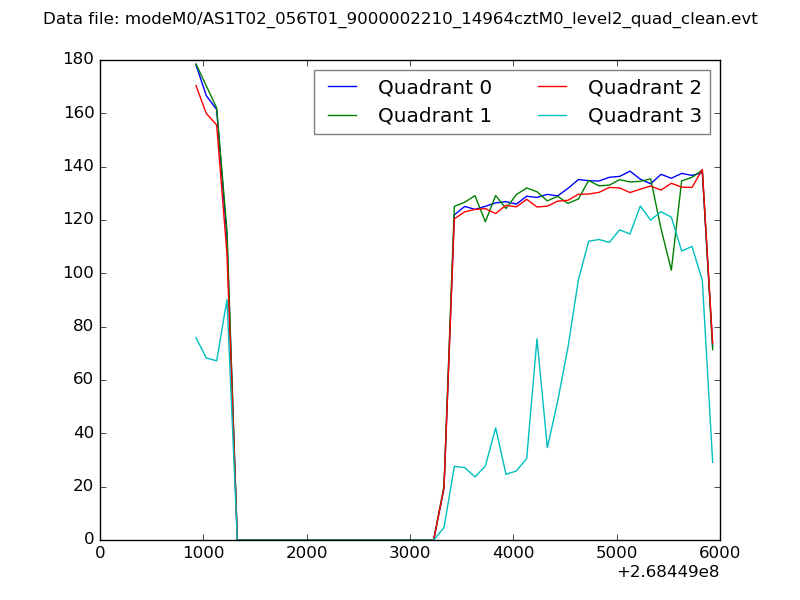 |
|
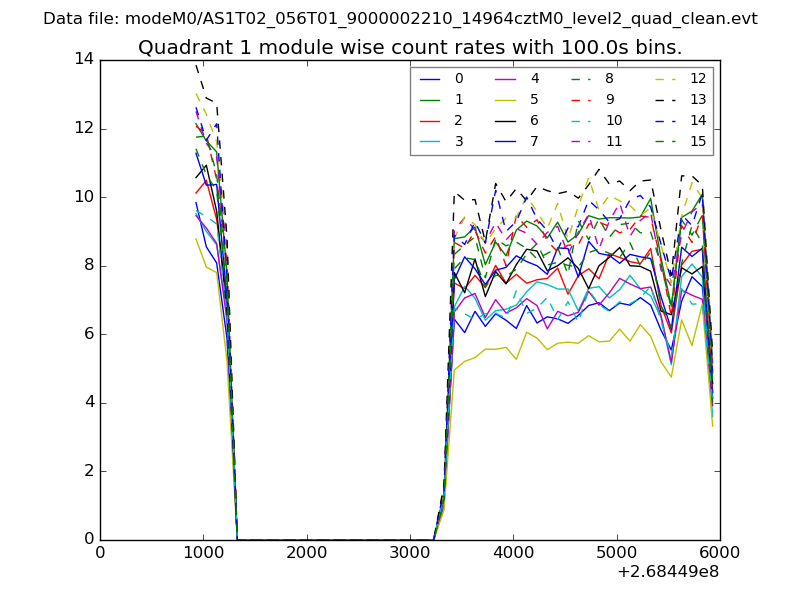
| Module-wise count rates for Quadrant A Data is divided into 100 sec bins |
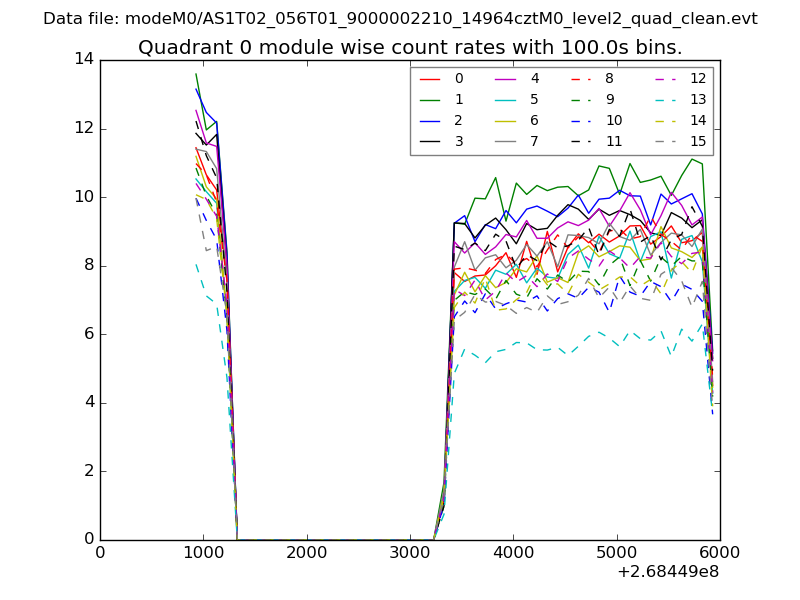 |
 |
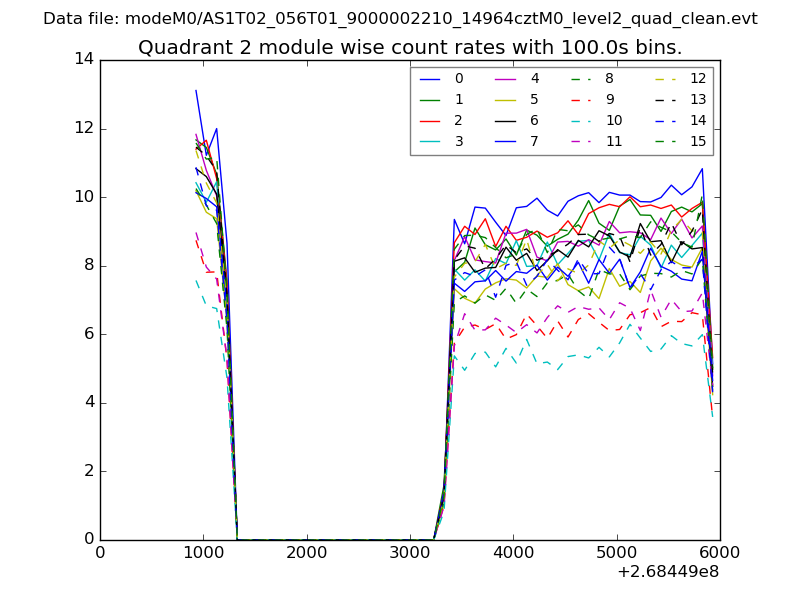
| Module-wise count rates for Quadrant B Data is divided into 100 sec bins |
 |
 |
| Module-wise count rates for Quadrant C Data is divided into 100 sec bins |
 |
 |
| Module-wise count rates for Quadrant D Data is divided into 100 sec bins |
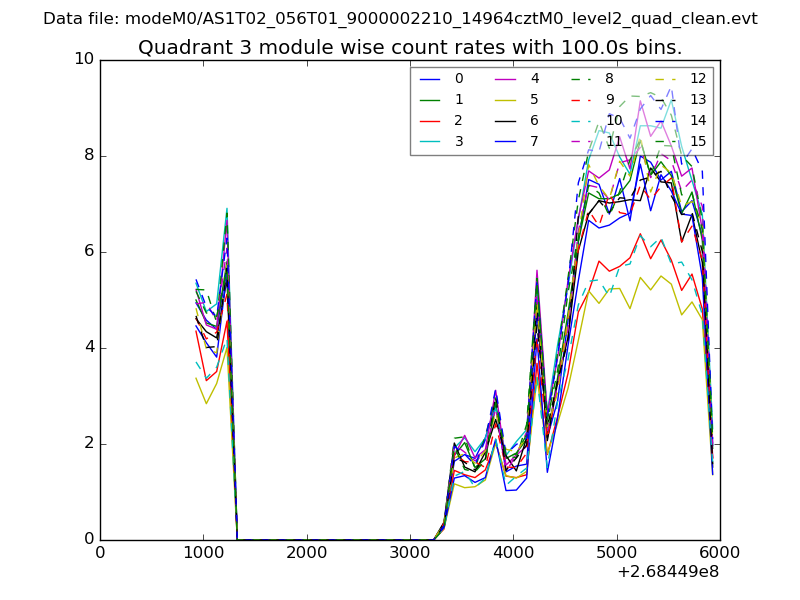 |
 |
| Parameter | Plot |
|---|---|
| CZT HV Monitor | 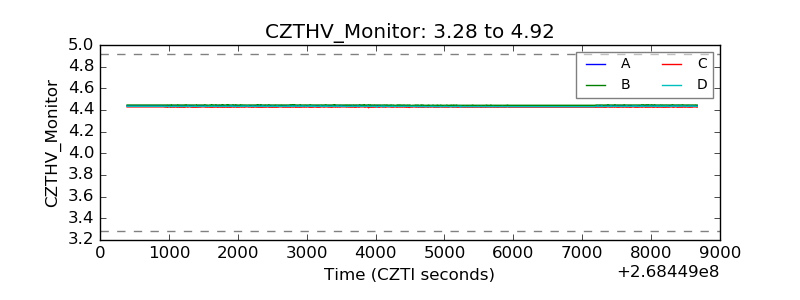 |
| D_VDD | 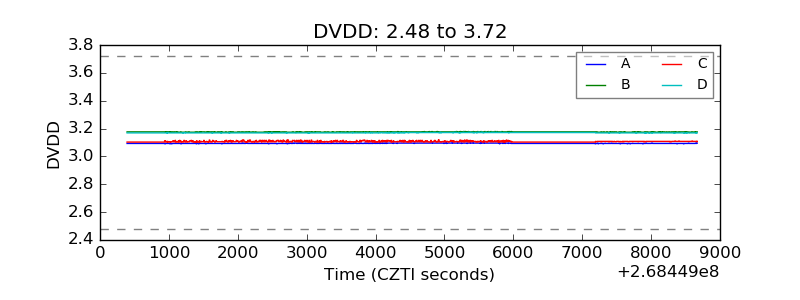 |
| Temperature 1 | 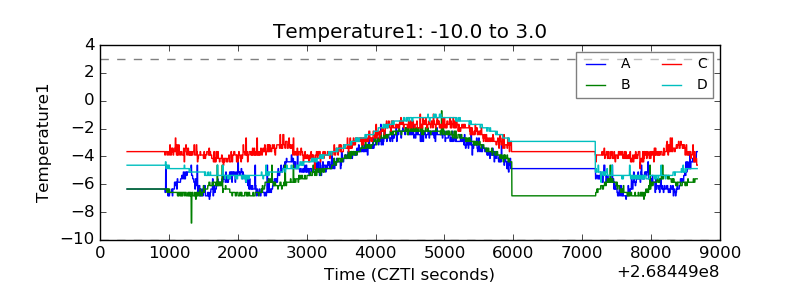 |
| Veto HV Monitor | 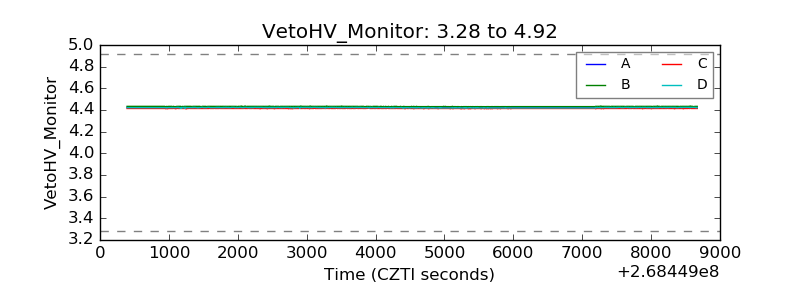 |
| Veto LLD | 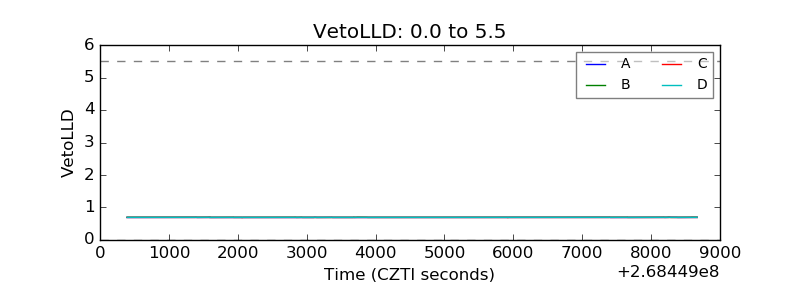 |
| Alpha Counter | 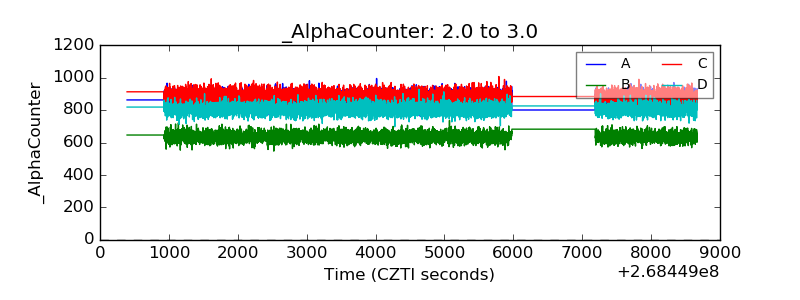 |
| _CPM_Rate | 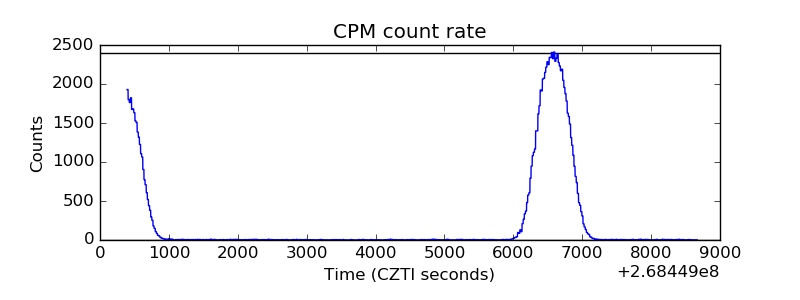 |
| CZT Counter |  |
| +2.5 Volts monitor |  |
| +5 Volts monitor | 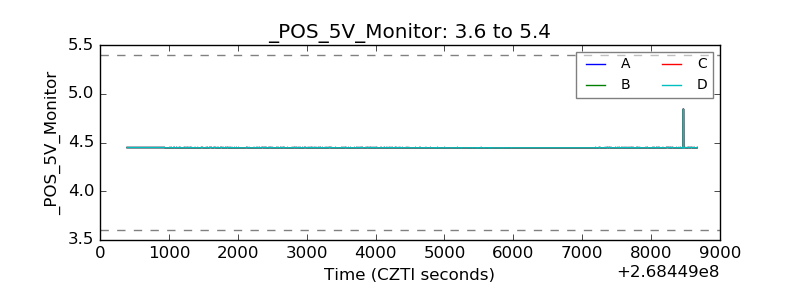 |
| _ROLL_ROT | 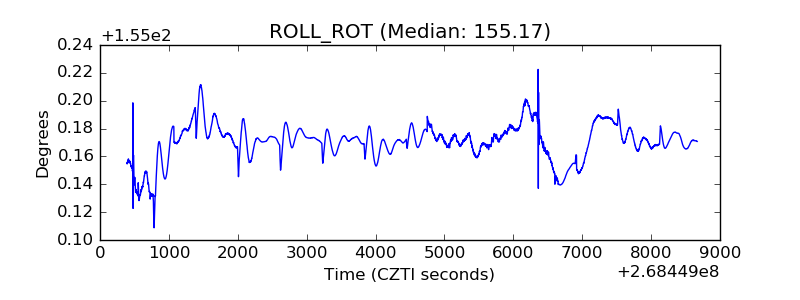 |
| _Roll_DEC | 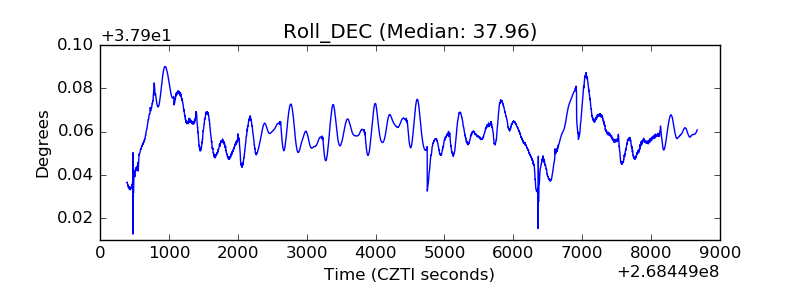 |
| _Roll_RA | 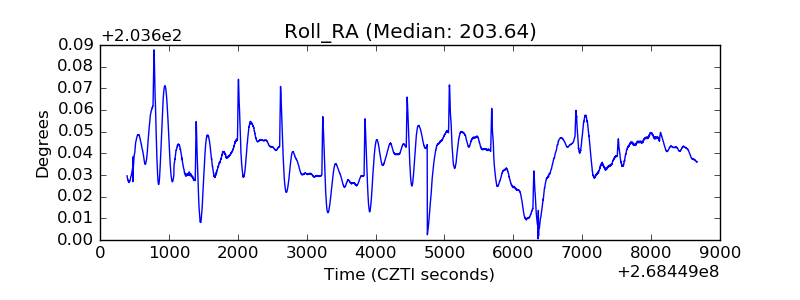 |
| Veto Counter | 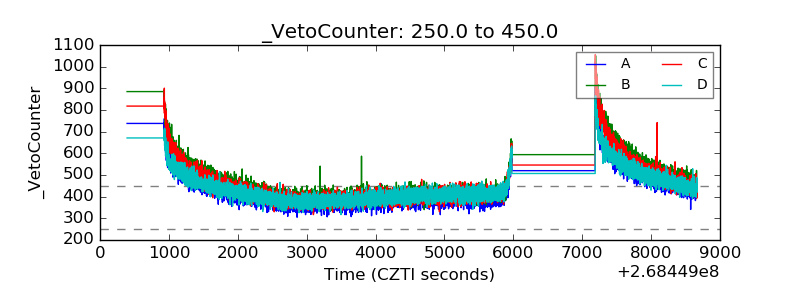 |