| Param | Original file | Final file |
|---|---|---|
| Filename | modeM0/AS1T02_056T01_9000002210_14965cztM0_level2.evt | modeM0/AS1T02_056T01_9000002210_14965cztM0_level2_quad_clean.evt |
| Size (bytes) | 624,902,400 | 64,249,920 |
| Size | 596.0 MB | 61.3 MB |
| Events in quadrant A | 3,496,788 | 397,422 |
| Events in quadrant B | 3,558,820 | 397,713 |
| Events in quadrant C | 3,239,534 | 386,603 |
| Events in quadrant D | 8,213,607 | 333,213 |
| Mode M0 | |||
|---|---|---|---|
| Quadrant | BADHDUFLAG | Total packets | Discarded packets |
| A | 0 | 14261 | 2 |
| B | 0 | 14332 | 1 |
| C | 0 | 13227 | 1 |
| D | 0 | 28697 | 1 |
| Mode M9 | |||
|---|---|---|---|
| Quadrant | BADHDUFLAG | Total packets | Discarded packets |
| A | 0 | 13 | 0 |
| B | 0 | 13 | 0 |
| C | 0 | 13 | 0 |
| D | 0 | 13 | 0 |
| Mode SS | |||
|---|---|---|---|
| Quadrant | BADHDUFLAG | Total packets | Discarded packets |
| A | 0 | 126 | 0 |
| B | 0 | 126 | 0 |
| C | 0 | 126 | 0 |
| D | 0 | 126 | 0 |
| Quadrant | Total seconds | Saturated seconds | Saturation percentage |
|---|---|---|---|
| A | 6157 | 36 | 0.584700% |
| B | 6157 | 114 | 1.851551% |
| C | 6157 | 15 | 0.243625% |
| D | 6157 | 1363 | 22.137405% |
Noise dominated data is calculated using 1-second bins in cleaned event files. If a bin has >2000 counts, and if more than 50% of those come from <1% of pixels, then it is considered to be noise-dominated and hence unusable.
| Quadrant | # 1 sec bins | Bins with >0 counts | Bins with >2000 counts | High rate bins dominated by noise | Noise dominated (total time) | Noise dominated (detector-on time) | Marked lightcurve |
|---|---|---|---|---|---|---|---|
| A | 7473 | 6159 | 0 | 0 | 0.00% | 0.00% | 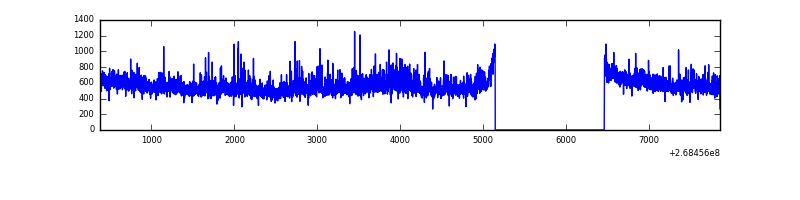 |
| B | 7473 | 6159 | 46 | 46 | 0.62% | 0.75% | 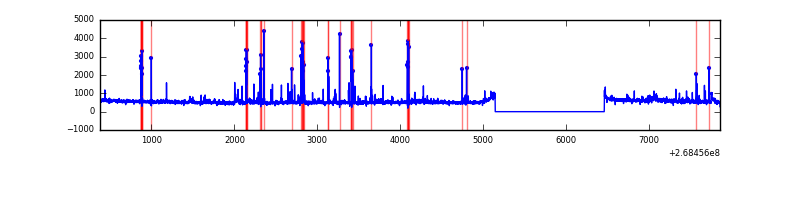 |
| C | 7473 | 6159 | 0 | 0 | 0.00% | 0.00% | 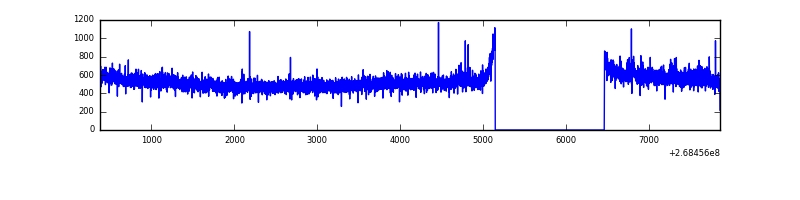 |
| D | 7473 | 6159 | 1270 | 1270 | 16.99% | 20.62% | 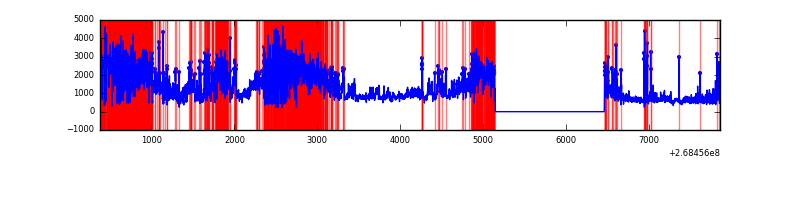 |
Top three noisy pixels from each quadrant. If the there are fewer than three noisy pixels in the level2.evt file, extra rows are filled as -1
| Pixel properties | Quadrant properties | ||||||
|---|---|---|---|---|---|---|---|
| Quadrant | DetID | PixID | Counts | Sigma | Mean | Median | Sigma |
| A | 1 | 162 | 122400 | 742.86 | 818 | 803 | 163.7 |
| A | 12 | 189 | 76342 | 461.48 | 818 | 803 | 163.7 |
| A | 1 | 178 | 56642 | 341.13 | 818 | 803 | 163.7 |
| B | 3 | 64 | 274171 | 1811.17 | 810 | 791 | 150.9 |
| B | 10 | 16 | 42737 | 277.9 | 810 | 791 | 150.9 |
| B | 0 | 230 | 24132 | 154.64 | 810 | 791 | 150.9 |
| C | 3 | 233 | 138257 | 771.66 | 776 | 780 | 178.2 |
| C | 7 | 247 | 77423 | 430.2 | 776 | 780 | 178.2 |
| C | 13 | 61 | 5568 | 26.88 | 776 | 780 | 178.2 |
| D | 7 | 254 | 5073109 | 29071.36 | 720 | 698 | 174.5 |
| D | 7 | 223 | 203731 | 1163.64 | 720 | 698 | 174.5 |
| D | 10 | 70 | 129009 | 735.39 | 720 | 698 | 174.5 |
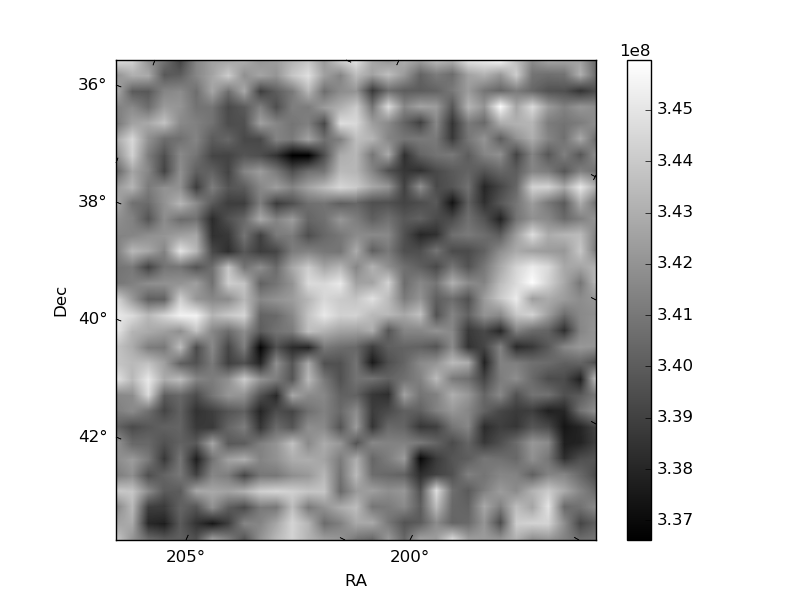
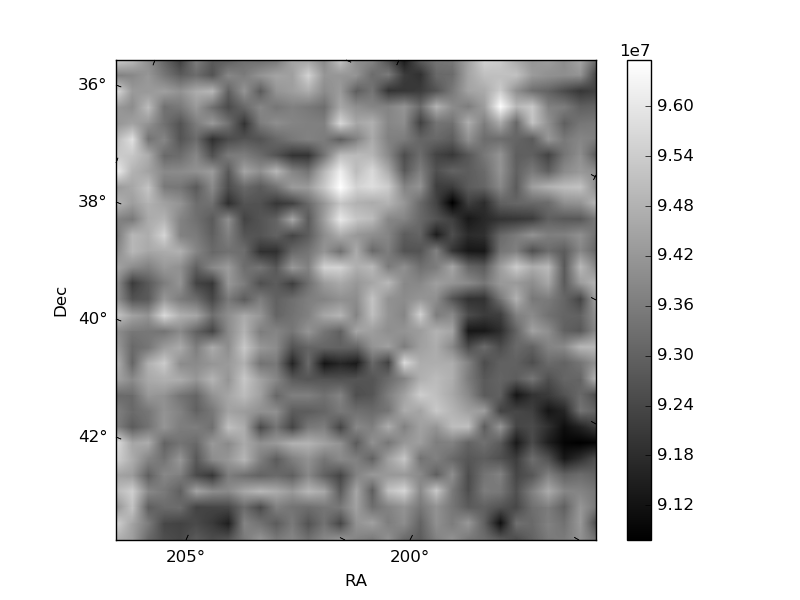
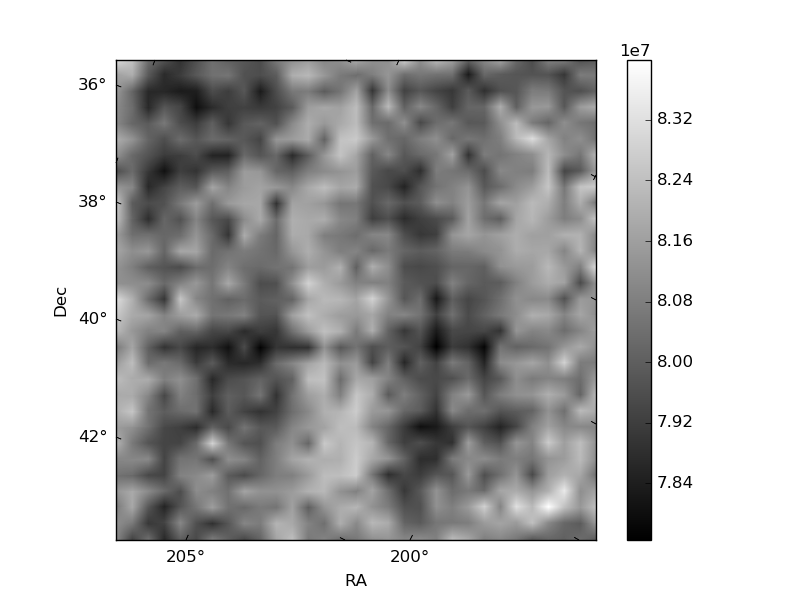
Histogram calculated using DETX and DETY for each event in the final _common_clean file
| Quadrant A | 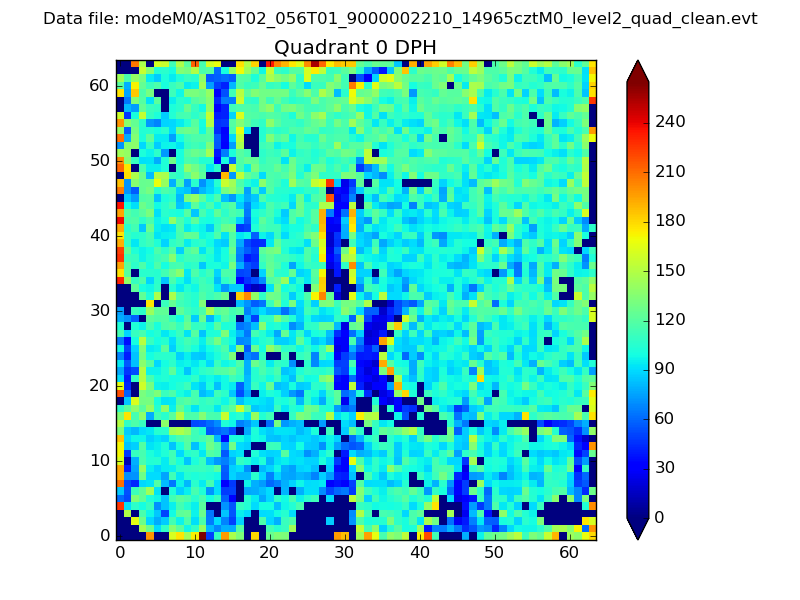 |
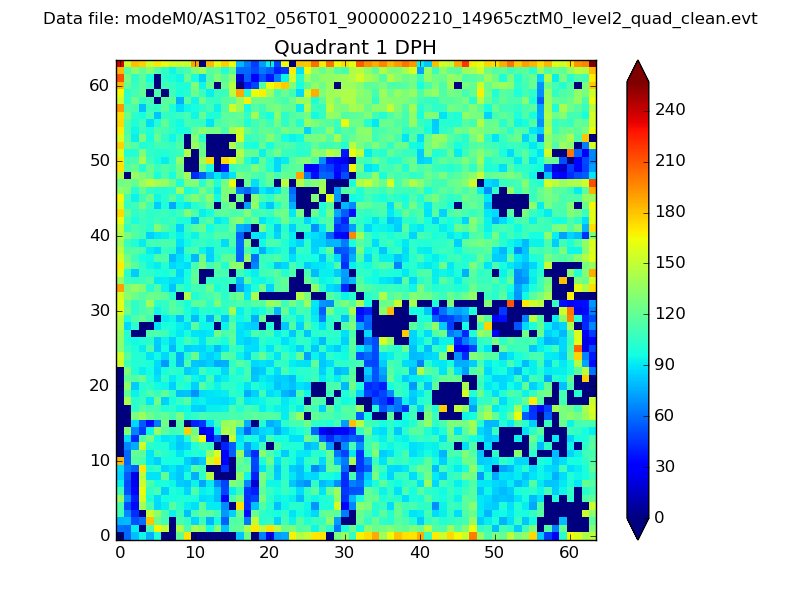 |
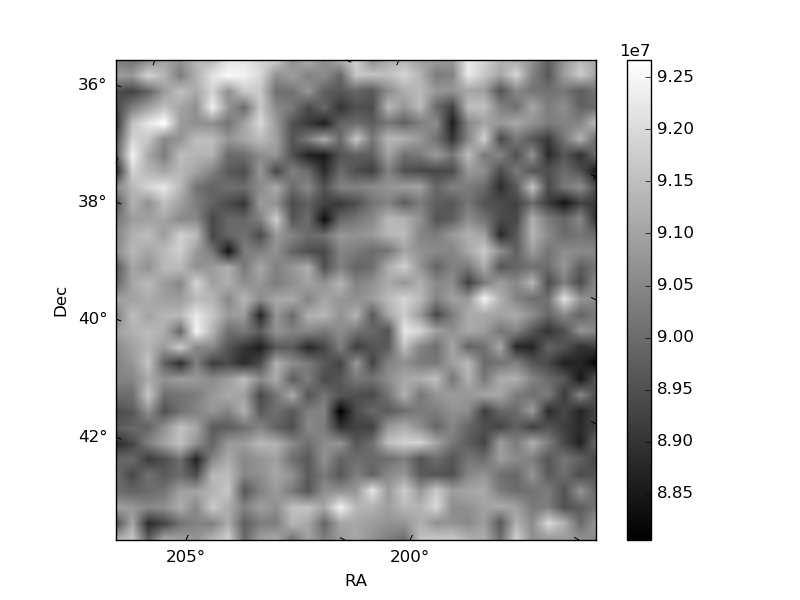
Quadrant B |
|---|---|---|---|
| Quadrant D | 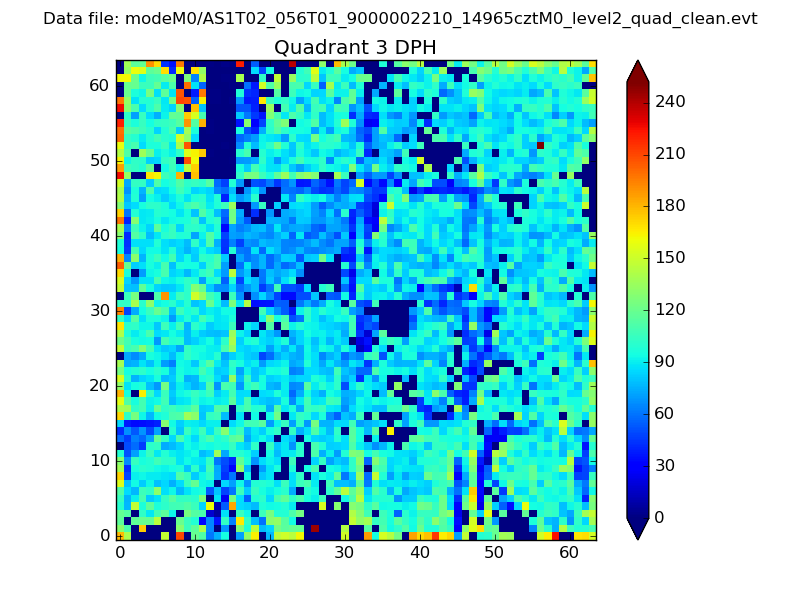 |
 |
Quadrant C |
| Plot type | Count rate plots | Images |
|---|---|---|
| Comparison with Poisson distribution Blue bars denote a histogram of data divided into 1 sec bins. Red curve is a Poisson curve with rate = median count rate of data. |
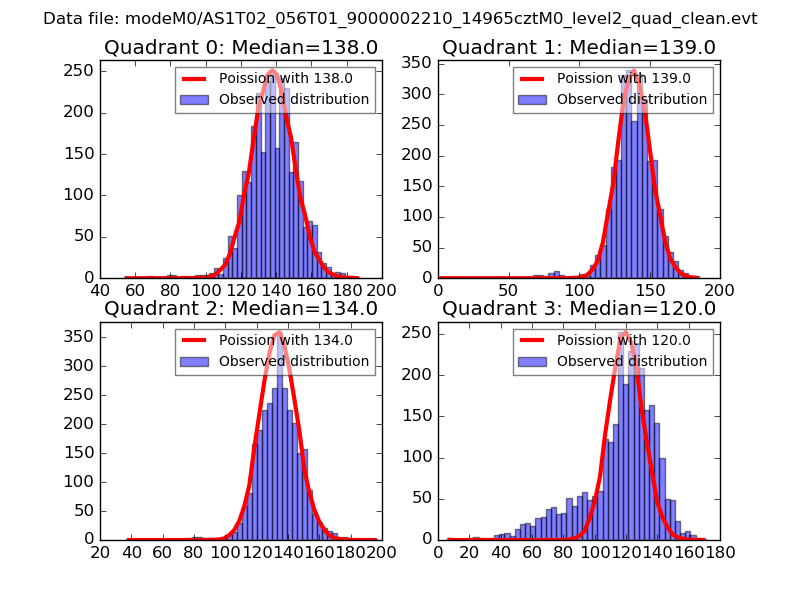 |
 |
| Quadrant-wise count rates Data is divided into 100 sec bins |
 |
|
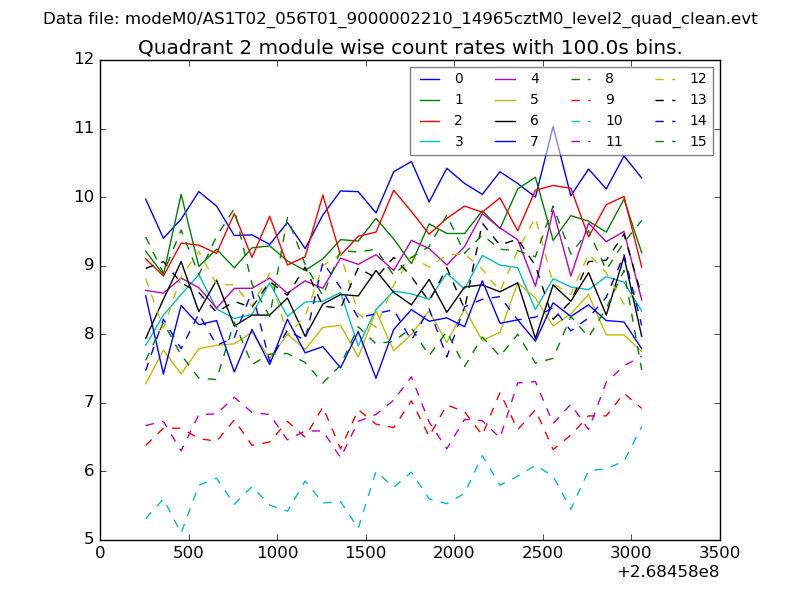
| Module-wise count rates for Quadrant A Data is divided into 100 sec bins |
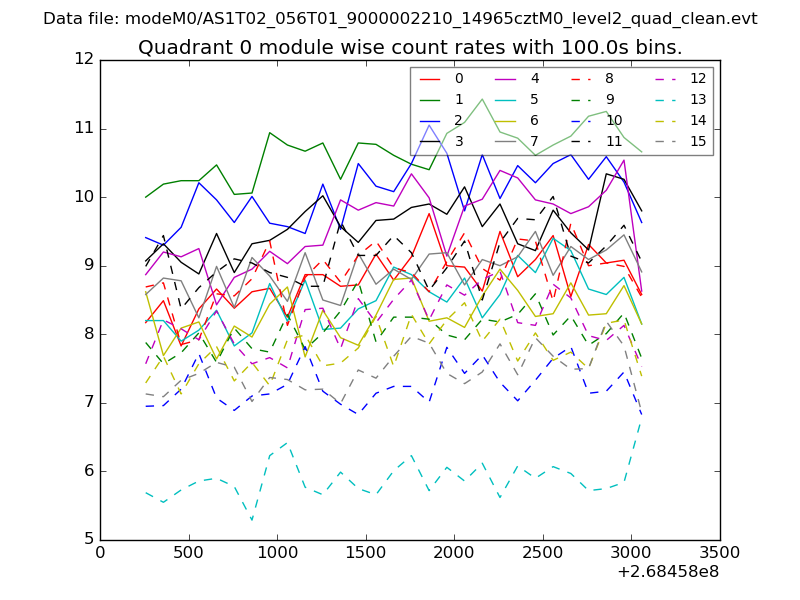 |
 |
| Module-wise count rates for Quadrant B Data is divided into 100 sec bins |
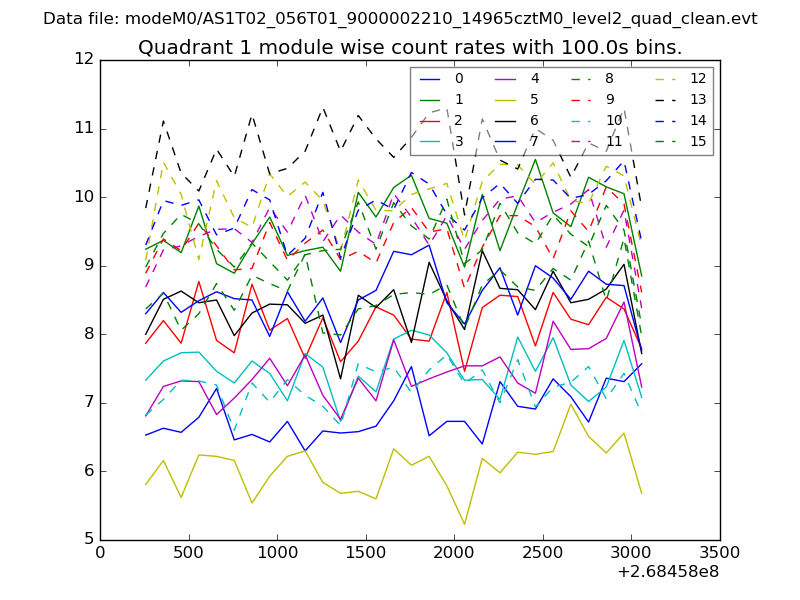 |
 |
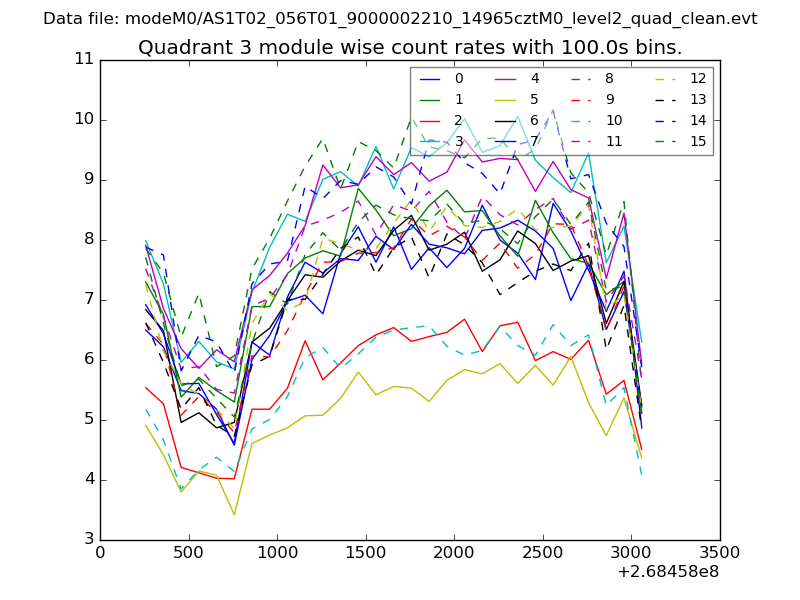
| Module-wise count rates for Quadrant C Data is divided into 100 sec bins |
 |
 |
| Module-wise count rates for Quadrant D Data is divided into 100 sec bins |
 |
 |
| Parameter | Plot |
|---|---|
| CZT HV Monitor | 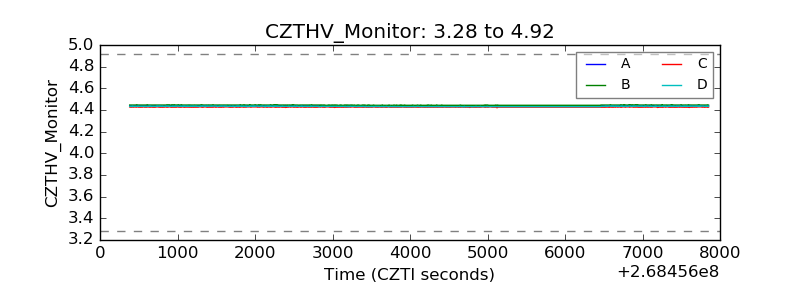 |
| D_VDD | 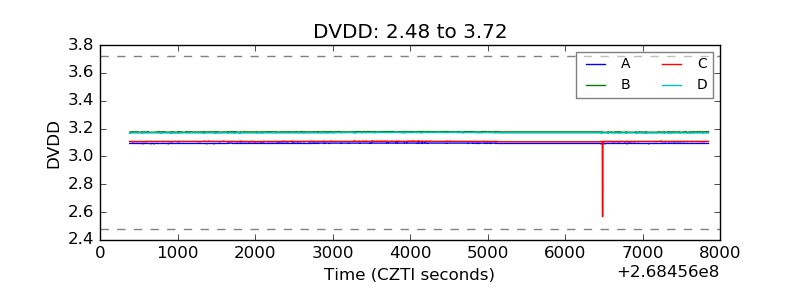 |
| Temperature 1 | 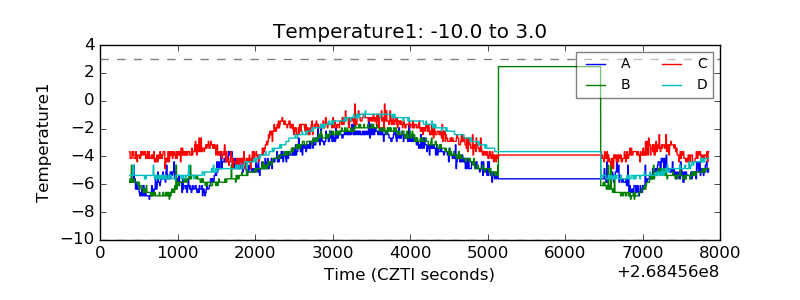 |
| Veto HV Monitor | 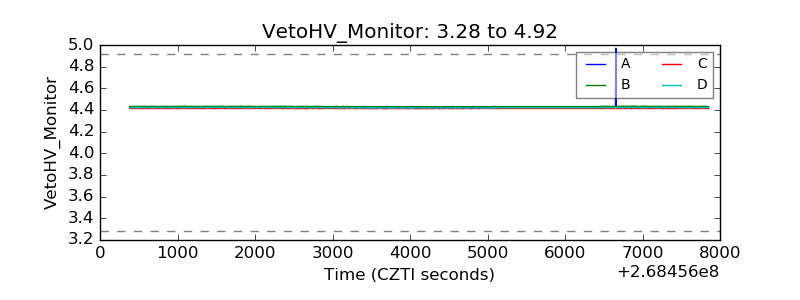 |
| Veto LLD | 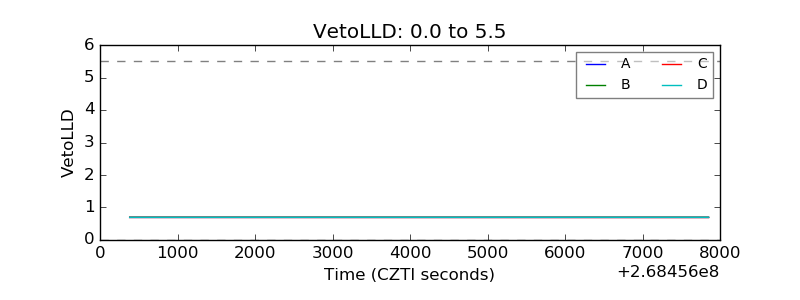 |
| Alpha Counter | 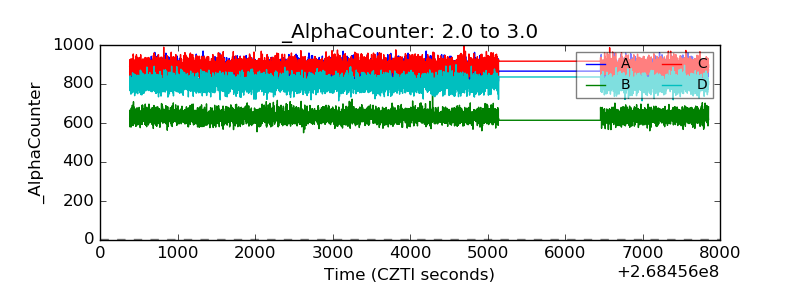 |
| _CPM_Rate | 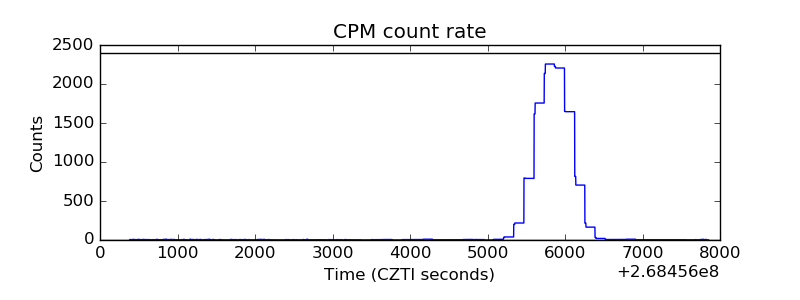 |
| CZT Counter |  |
| +2.5 Volts monitor |  |
| +5 Volts monitor |  |
| _ROLL_ROT | 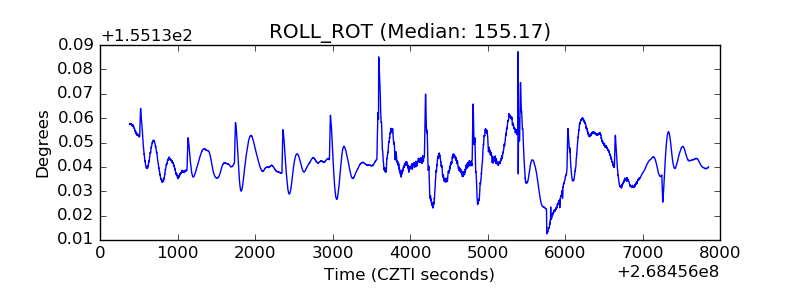 |
| _Roll_DEC | 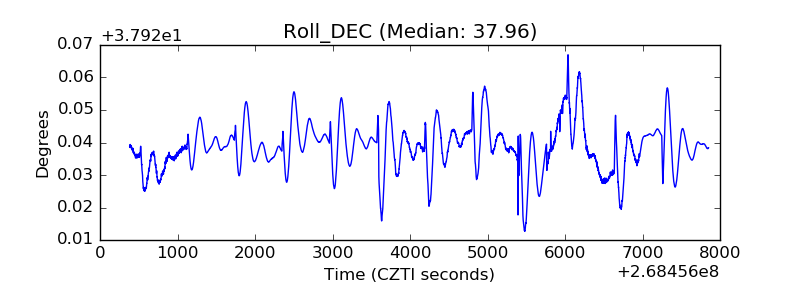 |
| _Roll_RA | 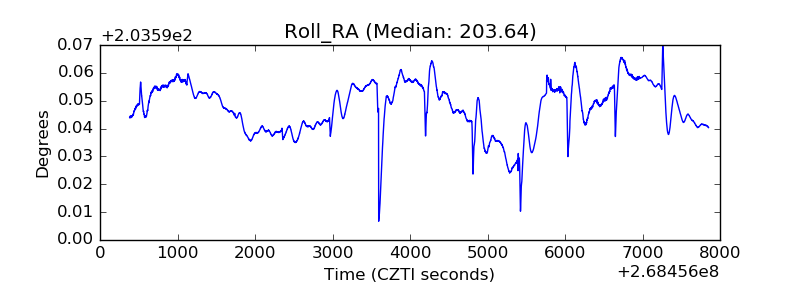 |
| Veto Counter | 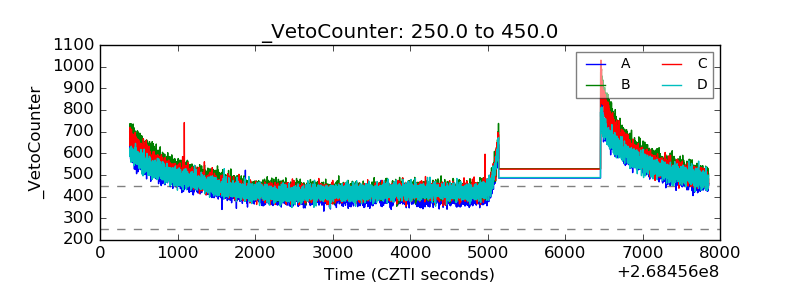 |