| Param | Original file | Final file |
|---|---|---|
| Filename | modeM0/AS1T02_056T01_9000002210_14966cztM0_level2.evt | modeM0/AS1T02_056T01_9000002210_14966cztM0_level2_quad_clean.evt |
| Size (bytes) | 492,117,120 | 74,488,320 |
| Size | 469.3 MB | 71.0 MB |
| Events in quadrant A | 3,675,369 | 467,860 |
| Events in quadrant B | 3,853,929 | 465,680 |
| Events in quadrant C | 3,359,121 | 454,449 |
| Events in quadrant D | 3,599,376 | 439,225 |
| Mode M0 | |||
|---|---|---|---|
| Quadrant | BADHDUFLAG | Total packets | Discarded packets |
| A | 0 | 14879 | 2 |
| B | 0 | 15490 | 1 |
| C | 0 | 13560 | 1 |
| D | 0 | 14662 | 2 |
| Mode M9 | |||
|---|---|---|---|
| Quadrant | BADHDUFLAG | Total packets | Discarded packets |
| A | 0 | 13 | 0 |
| B | 0 | 13 | 0 |
| C | 0 | 13 | 0 |
| D | 0 | 13 | 0 |
| Mode SS | |||
|---|---|---|---|
| Quadrant | BADHDUFLAG | Total packets | Discarded packets |
| A | 0 | 124 | 0 |
| B | 0 | 124 | 0 |
| C | 0 | 124 | 0 |
| D | 0 | 124 | 0 |
| Quadrant | Total seconds | Saturated seconds | Saturation percentage |
|---|---|---|---|
| A | 6143 | 106 | 1.725541% |
| B | 6143 | 197 | 3.206902% |
| C | 6143 | 71 | 1.155787% |
| D | 6119 | 155 | 2.533094% |
Noise dominated data is calculated using 1-second bins in cleaned event files. If a bin has >2000 counts, and if more than 50% of those come from <1% of pixels, then it is considered to be noise-dominated and hence unusable.
| Quadrant | # 1 sec bins | Bins with >0 counts | Bins with >2000 counts | High rate bins dominated by noise | Noise dominated (total time) | Noise dominated (detector-on time) | Marked lightcurve |
|---|---|---|---|---|---|---|---|
| A | 7444 | 6144 | 0 | 0 | 0.00% | 0.00% | 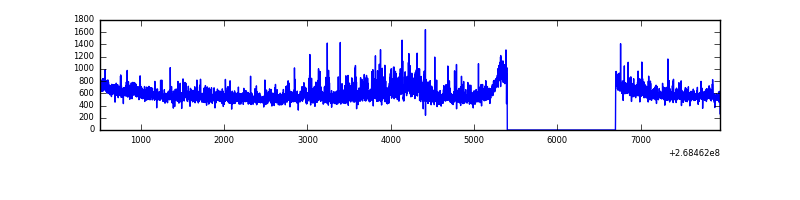 |
| B | 7444 | 6144 | 58 | 58 | 0.78% | 0.94% | 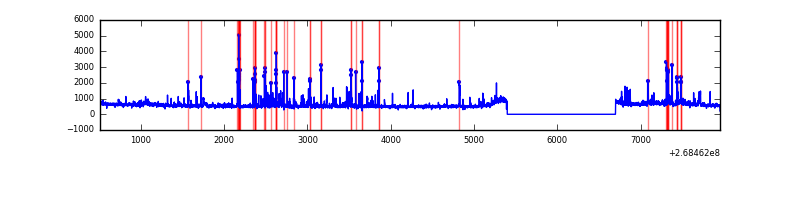 |
| C | 7444 | 6144 | 0 | 0 | 0.00% | 0.00% | 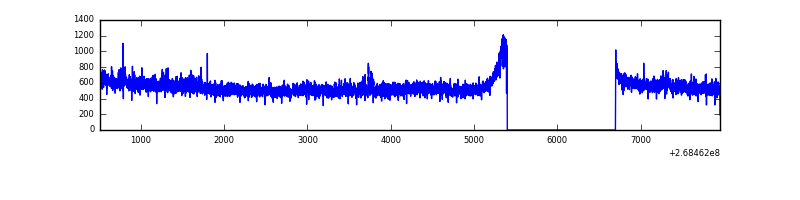 |
| D | 7444 | 6121 | 75 | 75 | 1.01% | 1.23% | 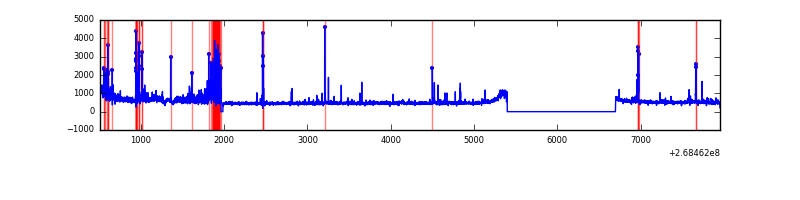 |
Top three noisy pixels from each quadrant. If the there are fewer than three noisy pixels in the level2.evt file, extra rows are filled as -1
| Pixel properties | Quadrant properties | ||||||
|---|---|---|---|---|---|---|---|
| Quadrant | DetID | PixID | Counts | Sigma | Mean | Median | Sigma |
| A | 1 | 162 | 133695 | 793.47 | 841 | 825 | 167.5 |
| A | 12 | 189 | 124103 | 736.19 | 841 | 825 | 167.5 |
| A | 1 | 178 | 66796 | 393.97 | 841 | 825 | 167.5 |
| B | 3 | 64 | 331336 | 2123.88 | 832 | 815 | 155.6 |
| B | 10 | 16 | 112090 | 715.04 | 832 | 815 | 155.6 |
| B | 0 | 219 | 73723 | 468.5 | 832 | 815 | 155.6 |
| C | 3 | 233 | 128935 | 704.96 | 796 | 801 | 181.8 |
| C | 7 | 247 | 124671 | 681.5 | 796 | 801 | 181.8 |
| C | 13 | 61 | 5720 | 27.06 | 796 | 801 | 181.8 |
| D | 7 | 254 | 423440 | 2186.89 | 796 | 772 | 193.3 |
| D | 10 | 70 | 86403 | 443.06 | 796 | 772 | 193.3 |
| D | 7 | 38 | 25246 | 126.63 | 796 | 772 | 193.3 |
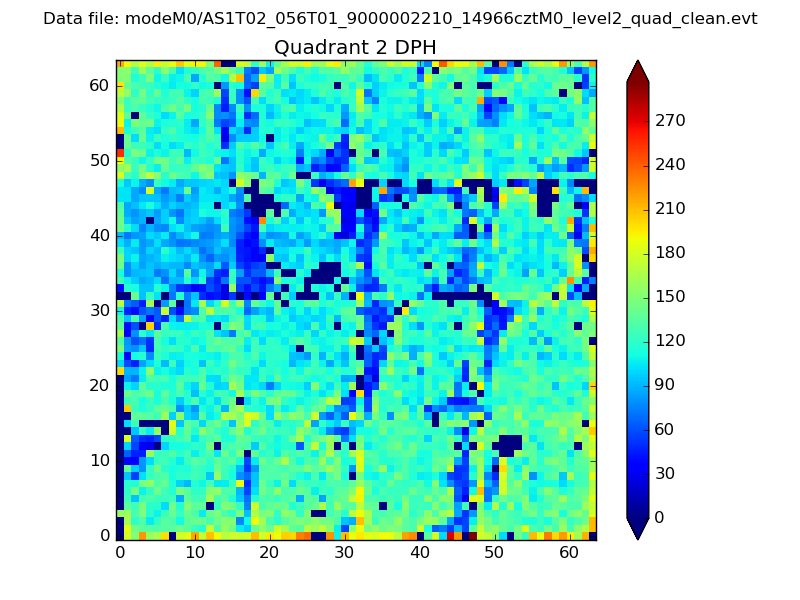
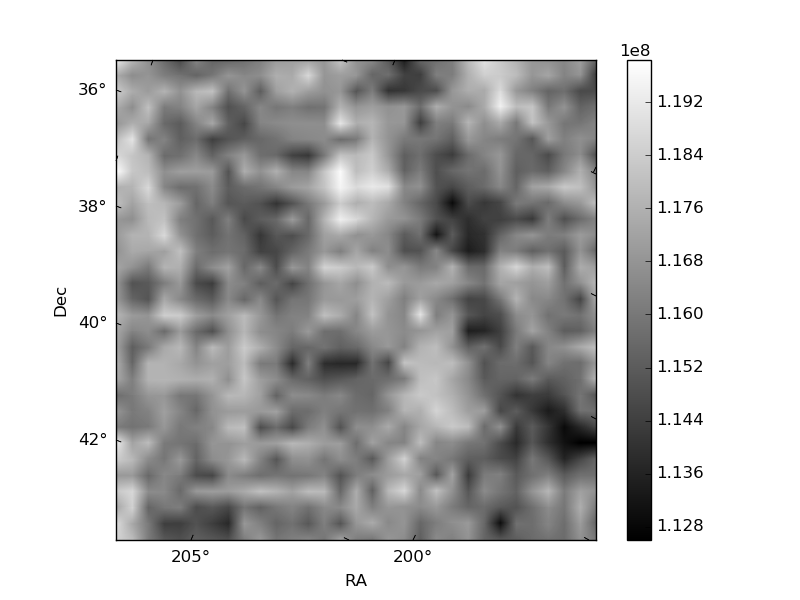
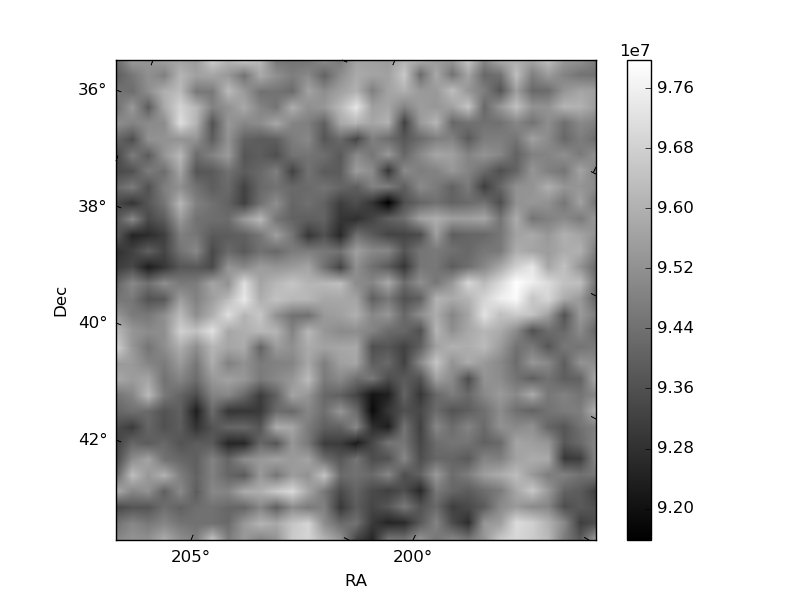
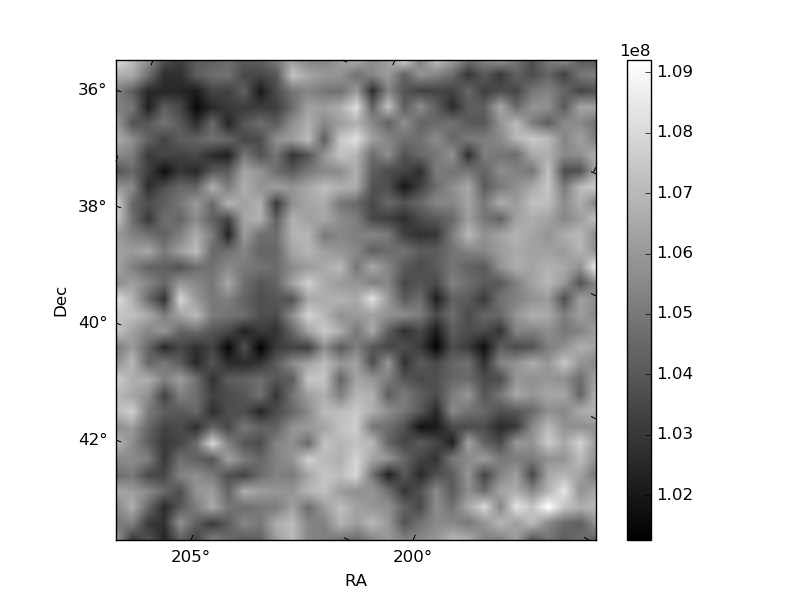
Histogram calculated using DETX and DETY for each event in the final _common_clean file
| Quadrant A | 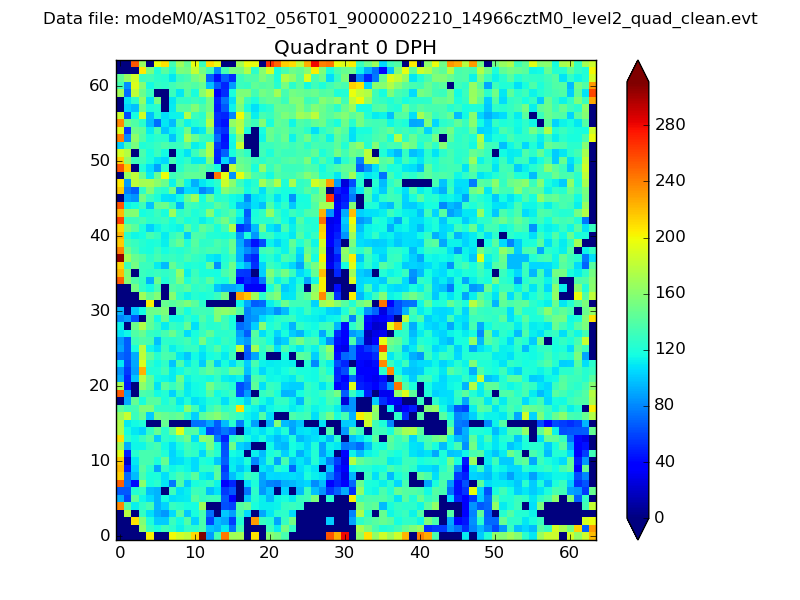 |
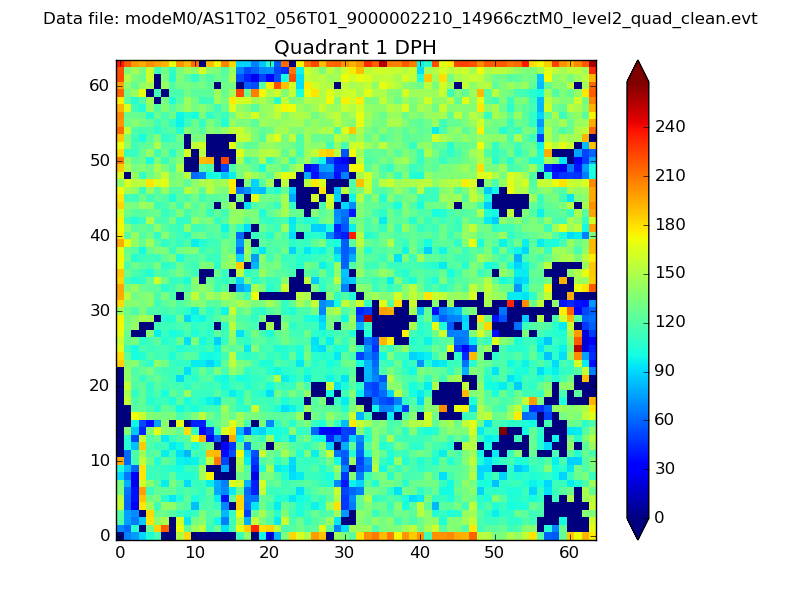 |
Quadrant B |
|---|---|---|---|
| Quadrant D | 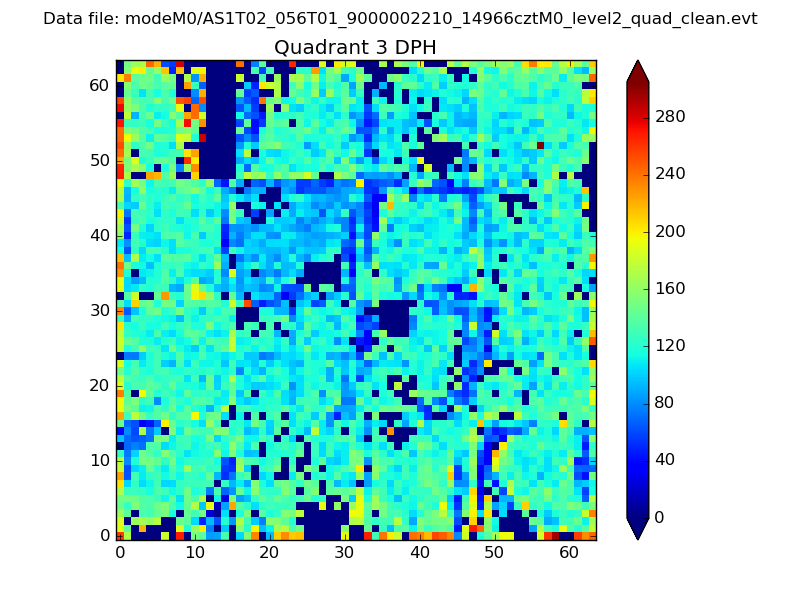 |
 |
Quadrant C |
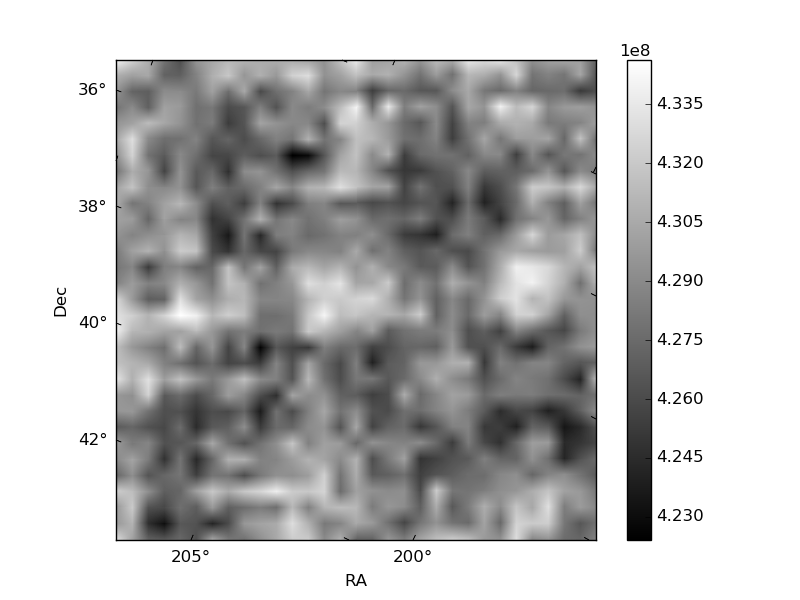
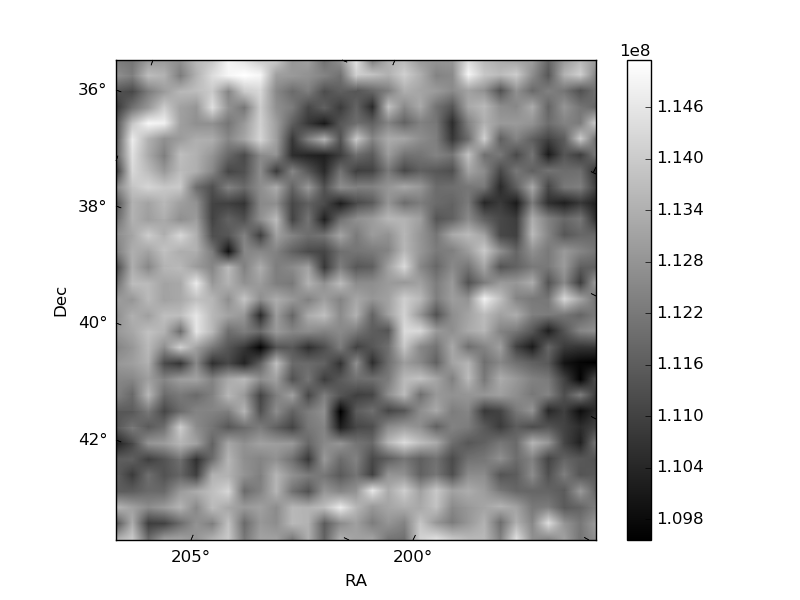
| Plot type | Count rate plots | Images |
|---|---|---|
| Comparison with Poisson distribution Blue bars denote a histogram of data divided into 1 sec bins. Red curve is a Poisson curve with rate = median count rate of data. |
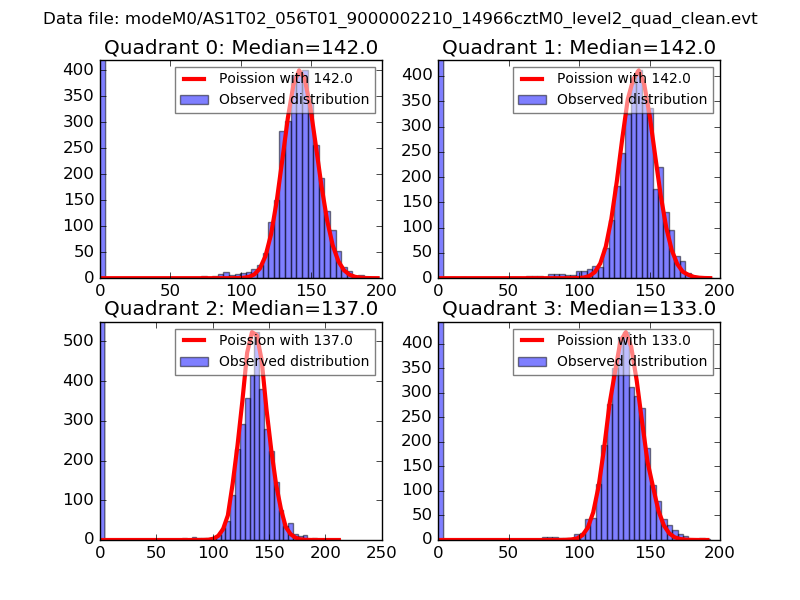 |
 |
| Quadrant-wise count rates Data is divided into 100 sec bins |
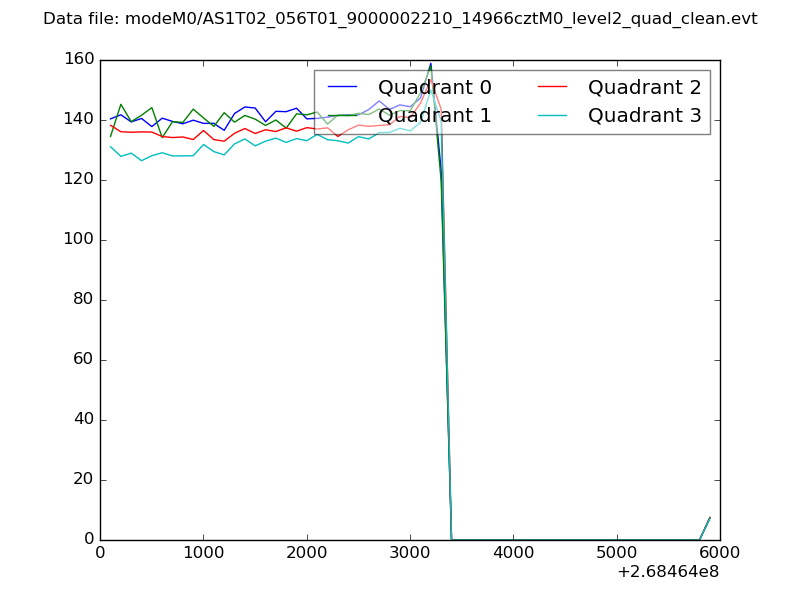 |
|
| Module-wise count rates for Quadrant A Data is divided into 100 sec bins |
 |
 |
| Module-wise count rates for Quadrant B Data is divided into 100 sec bins |
 |
 |
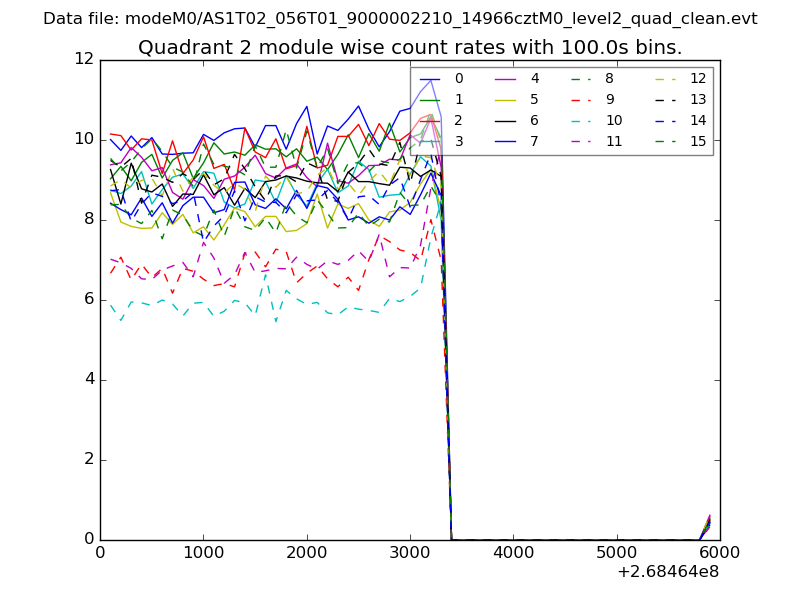
| Module-wise count rates for Quadrant C Data is divided into 100 sec bins |
 |
 |
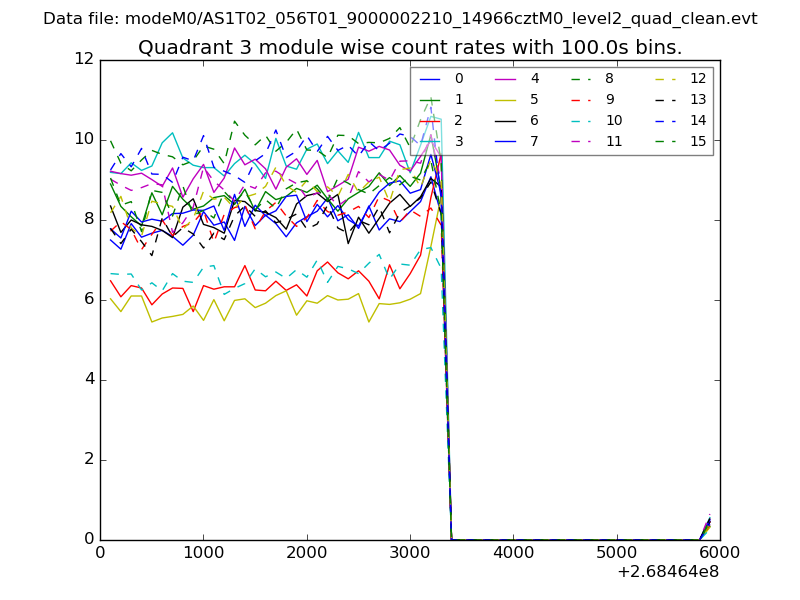
| Module-wise count rates for Quadrant D Data is divided into 100 sec bins |
 |
 |
| Parameter | Plot |
|---|---|
| CZT HV Monitor | 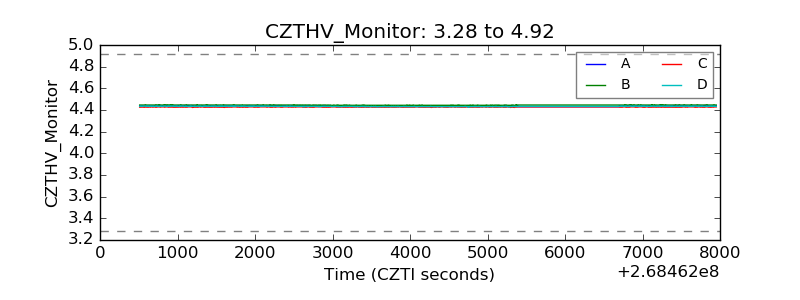 |
| D_VDD | 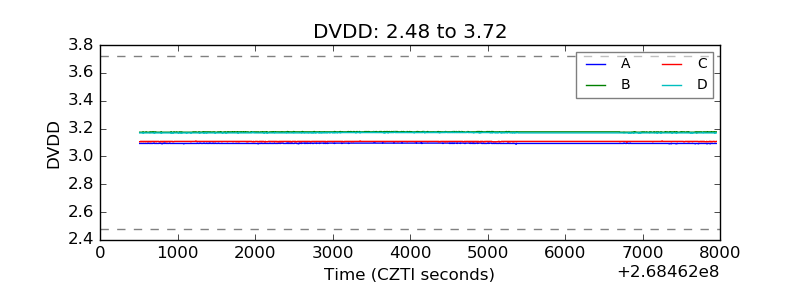 |
| Temperature 1 | 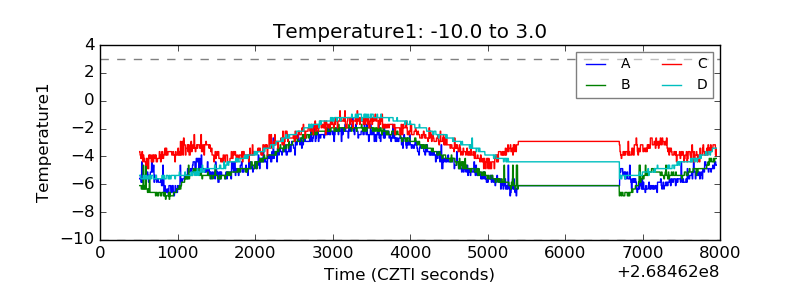 |
| Veto HV Monitor | 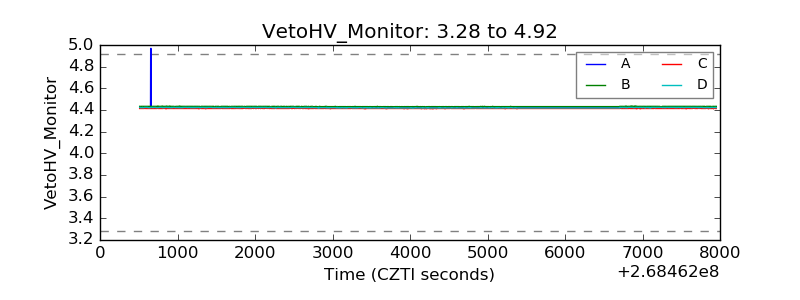 |
| Veto LLD |  |
| Alpha Counter | 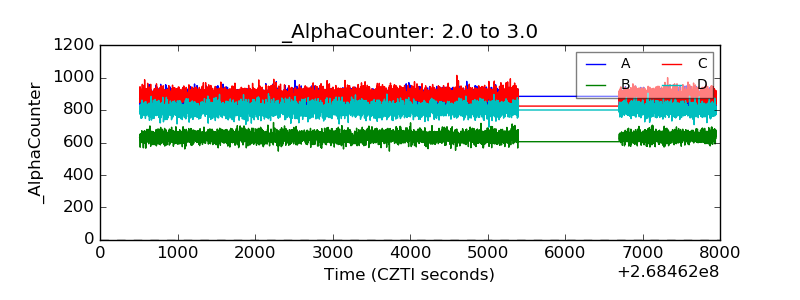 |
| _CPM_Rate | 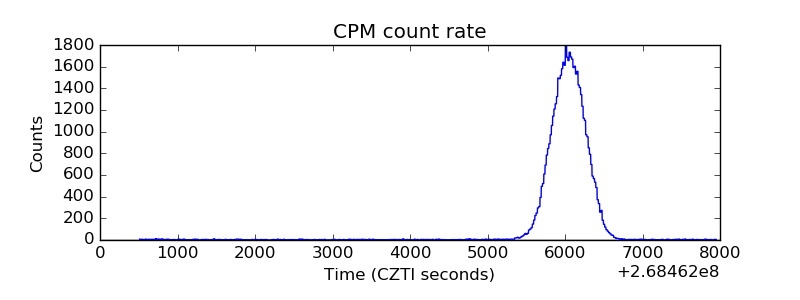 |
| CZT Counter | 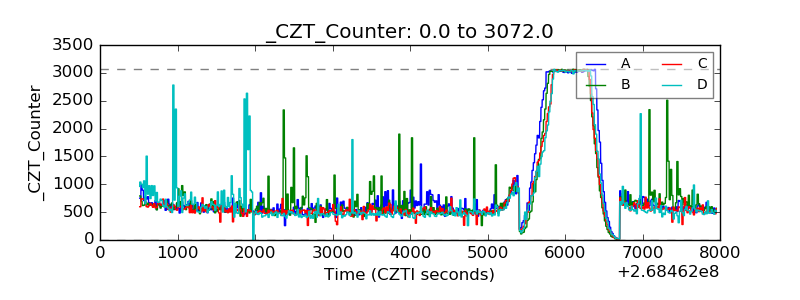 |
| +2.5 Volts monitor |  |
| +5 Volts monitor |  |
| _ROLL_ROT | 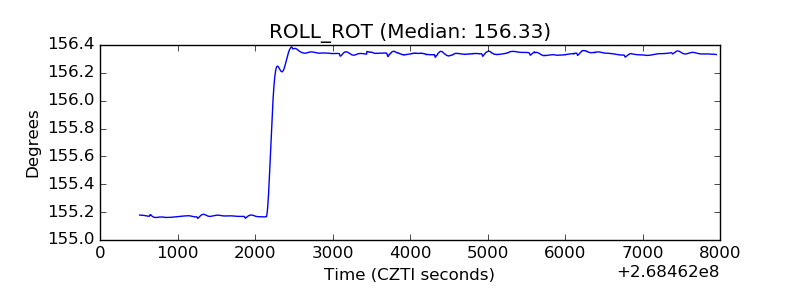 |
| _Roll_DEC | 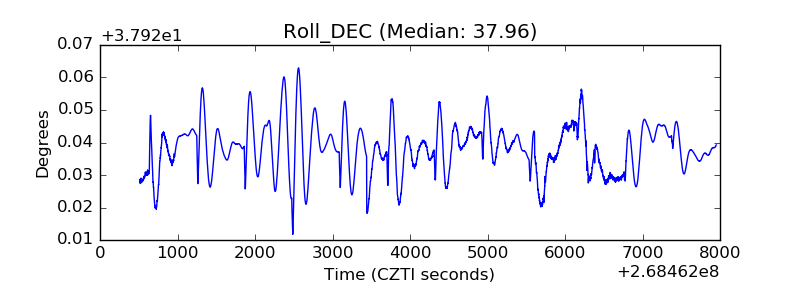 |
| _Roll_RA | 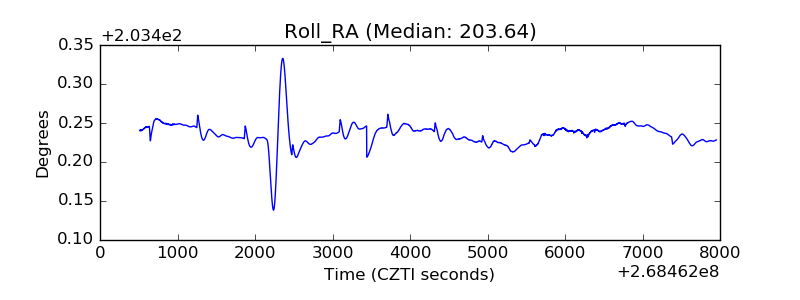 |
| Veto Counter | 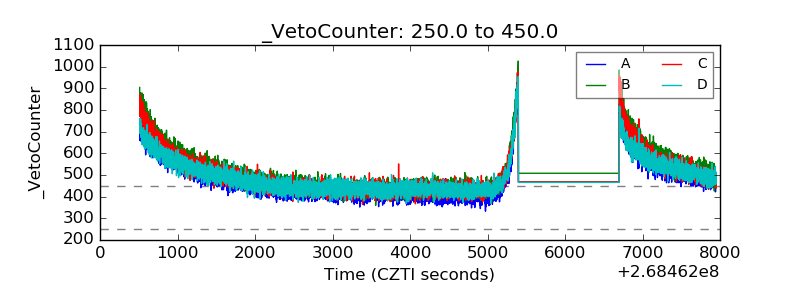 |