| Param | Original file | Final file |
|---|---|---|
| Filename | modeM0/AS1T02_056T01_9000002210_14968cztM0_level2.evt | modeM0/AS1T02_056T01_9000002210_14968cztM0_level2_quad_clean.evt |
| Size (bytes) | 506,318,400 | 95,598,720 |
| Size | 482.9 MB | 91.2 MB |
| Events in quadrant A | 3,861,443 | 623,642 |
| Events in quadrant B | 3,586,236 | 629,569 |
| Events in quadrant C | 3,301,616 | 609,582 |
| Events in quadrant D | 4,146,360 | 582,028 |
| Mode M0 | |||
|---|---|---|---|
| Quadrant | BADHDUFLAG | Total packets | Discarded packets |
| A | 0 | 15458 | 3 |
| B | 0 | 14537 | 2 |
| C | 0 | 13657 | 2 |
| D | 0 | 16571 | 2 |
| Mode M9 | |||
|---|---|---|---|
| Quadrant | BADHDUFLAG | Total packets | Discarded packets |
| A | 0 | 13 | 0 |
| B | 0 | 13 | 0 |
| C | 0 | 13 | 0 |
| D | 0 | 14 | 0 |
| Mode SS | |||
|---|---|---|---|
| Quadrant | BADHDUFLAG | Total packets | Discarded packets |
| A | 0 | 132 | 0 |
| B | 0 | 132 | 0 |
| C | 0 | 132 | 0 |
| D | 0 | 132 | 0 |
| Quadrant | Total seconds | Saturated seconds | Saturation percentage |
|---|---|---|---|
| A | 6452 | 223 | 3.456293% |
| B | 6452 | 170 | 2.634842% |
| C | 6452 | 85 | 1.317421% |
| D | 6452 | 366 | 5.672660% |
Noise dominated data is calculated using 1-second bins in cleaned event files. If a bin has >2000 counts, and if more than 50% of those come from <1% of pixels, then it is considered to be noise-dominated and hence unusable.
| Quadrant | # 1 sec bins | Bins with >0 counts | Bins with >2000 counts | High rate bins dominated by noise | Noise dominated (total time) | Noise dominated (detector-on time) | Marked lightcurve |
|---|---|---|---|---|---|---|---|
| A | 7558 | 6453 | 66 | 66 | 0.87% | 1.02% | 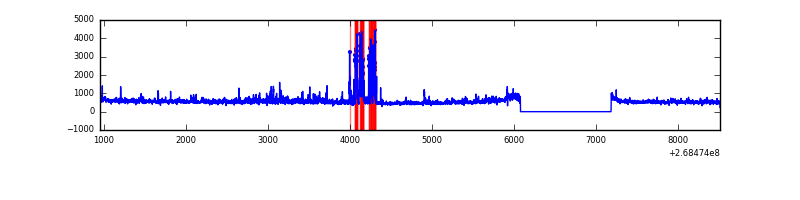 |
| B | 7558 | 6453 | 26 | 26 | 0.34% | 0.40% | 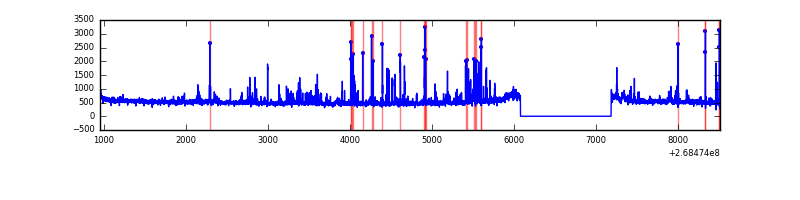 |
| C | 7558 | 6454 | 0 | 0 | 0.00% | 0.00% | 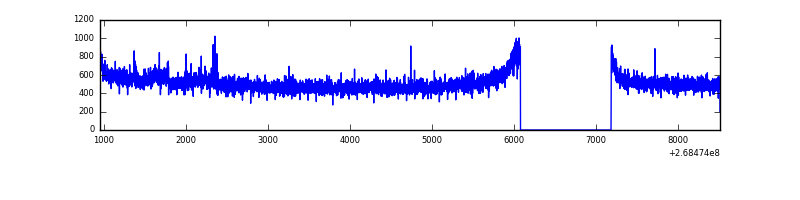 |
| D | 7558 | 6453 | 221 | 221 | 2.92% | 3.42% | 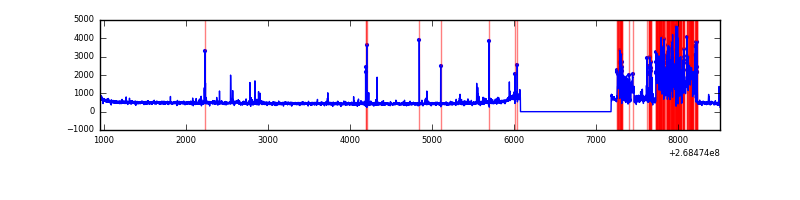 |
Top three noisy pixels from each quadrant. If the there are fewer than three noisy pixels in the level2.evt file, extra rows are filled as -1
| Pixel properties | Quadrant properties | ||||||
|---|---|---|---|---|---|---|---|
| Quadrant | DetID | PixID | Counts | Sigma | Mean | Median | Sigma |
| A | 13 | 248 | 292639 | 1734.69 | 832 | 813 | 168.2 |
| A | 1 | 162 | 123886 | 731.58 | 832 | 813 | 168.2 |
| A | 12 | 189 | 85343 | 502.47 | 832 | 813 | 168.2 |
| B | 3 | 64 | 189377 | 1199.62 | 824 | 803 | 157.2 |
| B | 0 | 229 | 55193 | 346.0 | 824 | 803 | 157.2 |
| B | 10 | 16 | 53059 | 332.43 | 824 | 803 | 157.2 |
| C | 3 | 233 | 140271 | 763.9 | 795 | 799 | 182.6 |
| C | 7 | 247 | 51415 | 277.23 | 795 | 799 | 182.6 |
| C | 10 | 22 | 9416 | 47.2 | 795 | 799 | 182.6 |
| D | 7 | 223 | 997306 | 5200.53 | 797 | 775 | 191.6 |
| D | 13 | 249 | 38375 | 196.22 | 797 | 775 | 191.6 |
| D | 7 | 38 | 26229 | 132.83 | 797 | 775 | 191.6 |
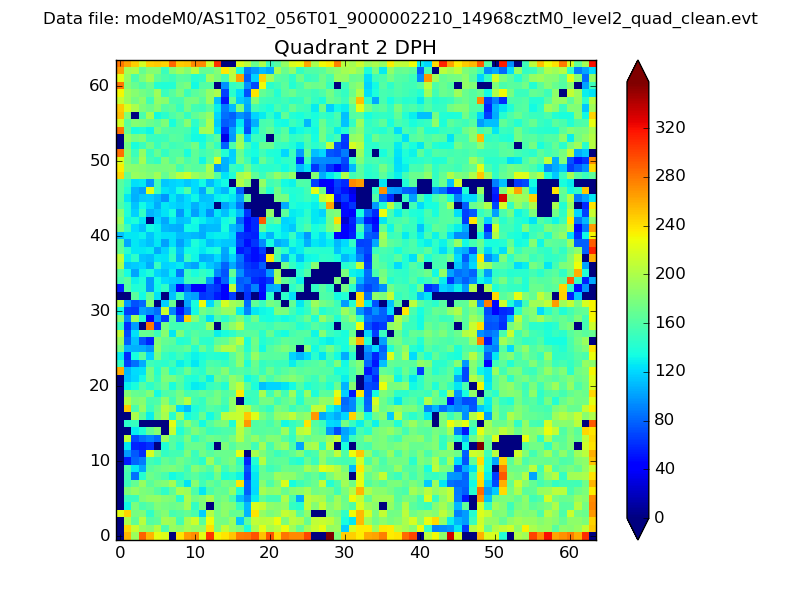
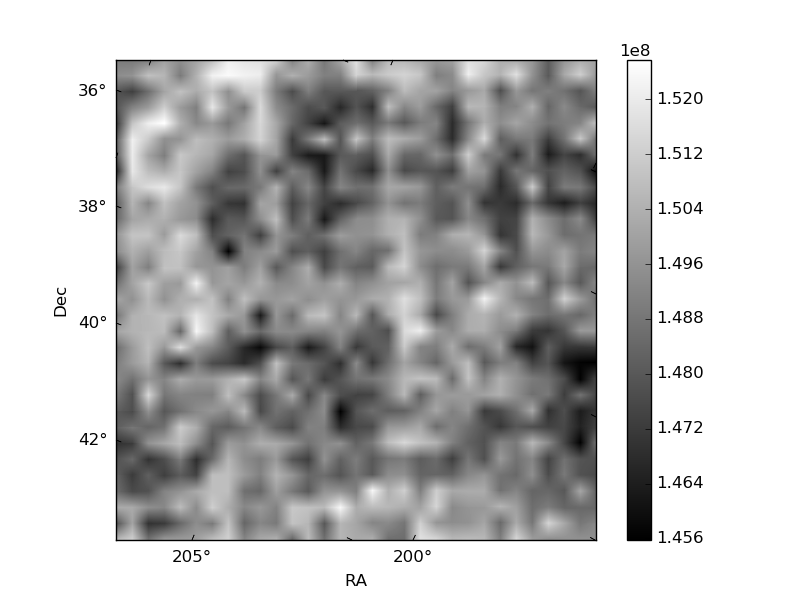
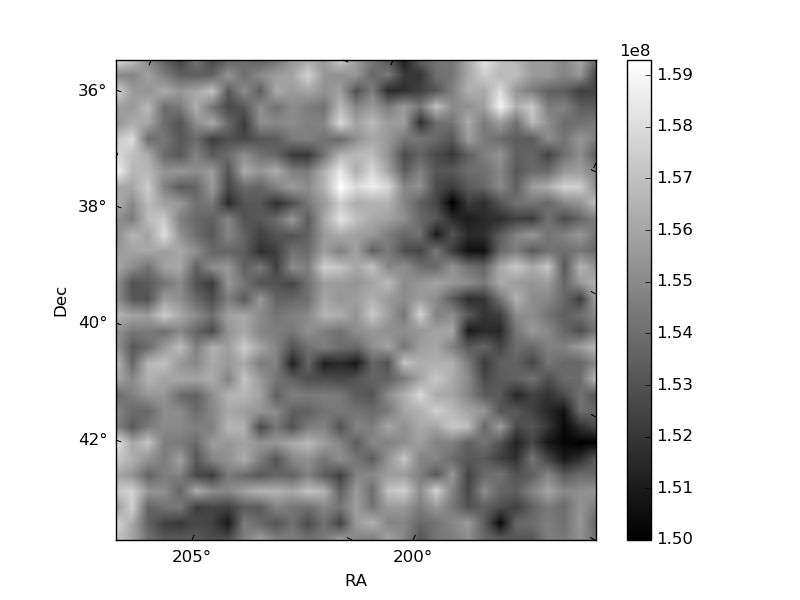
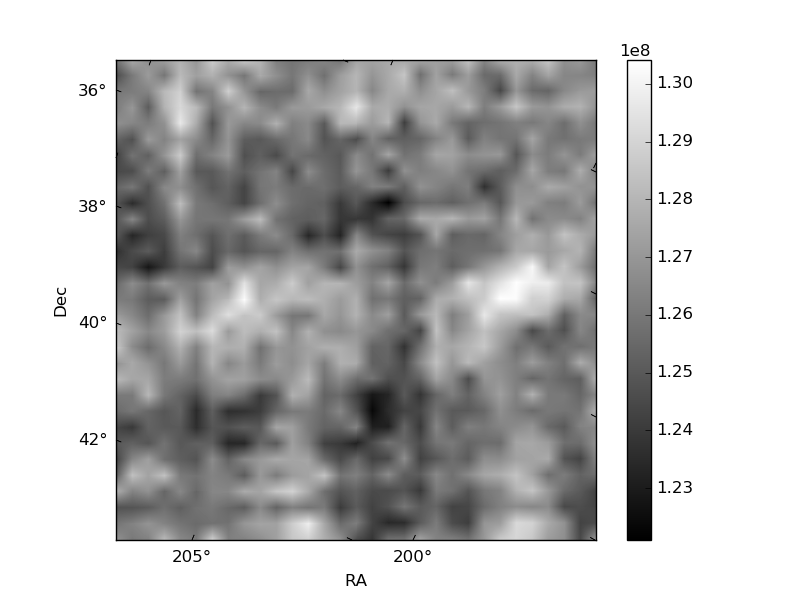
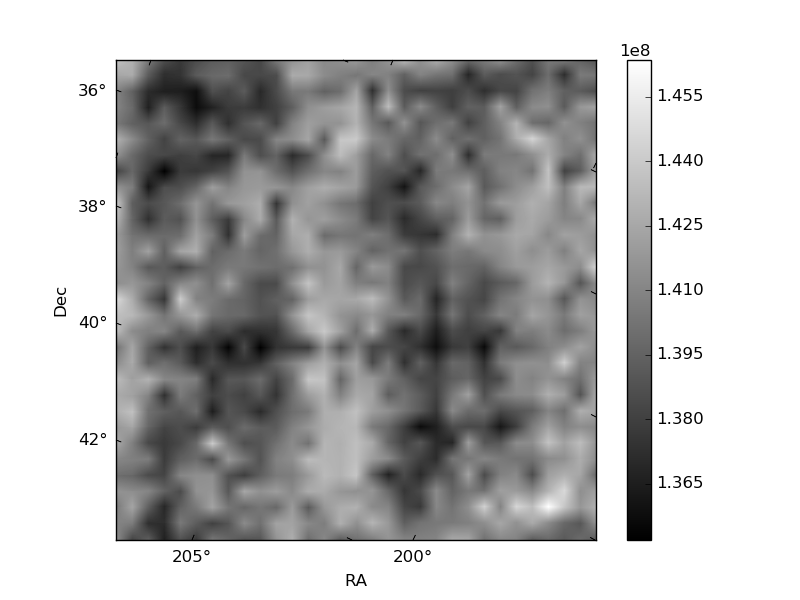
Histogram calculated using DETX and DETY for each event in the final _common_clean file
| Quadrant A | 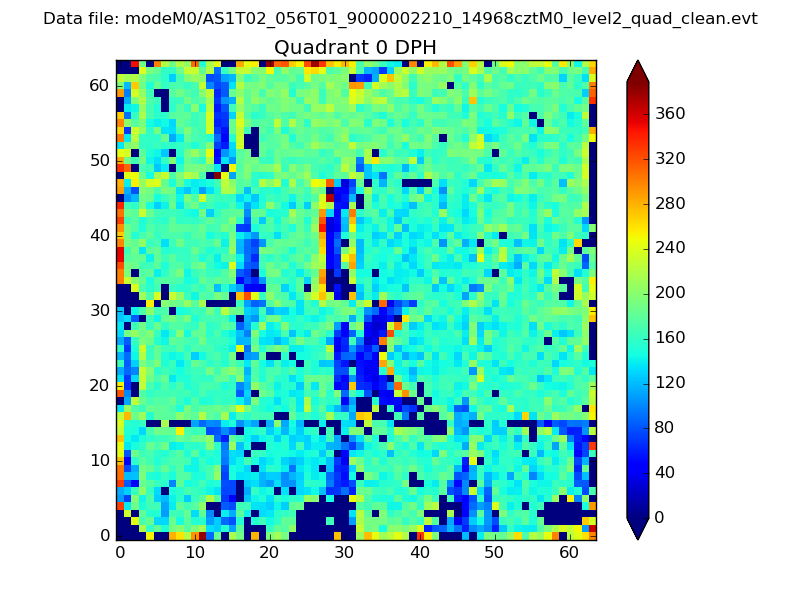 |
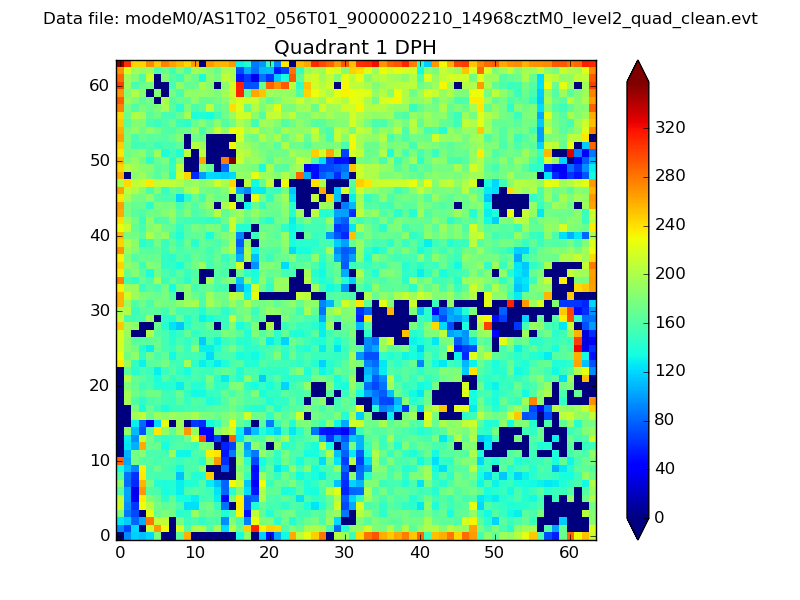 |
Quadrant B |
|---|---|---|---|
| Quadrant D | 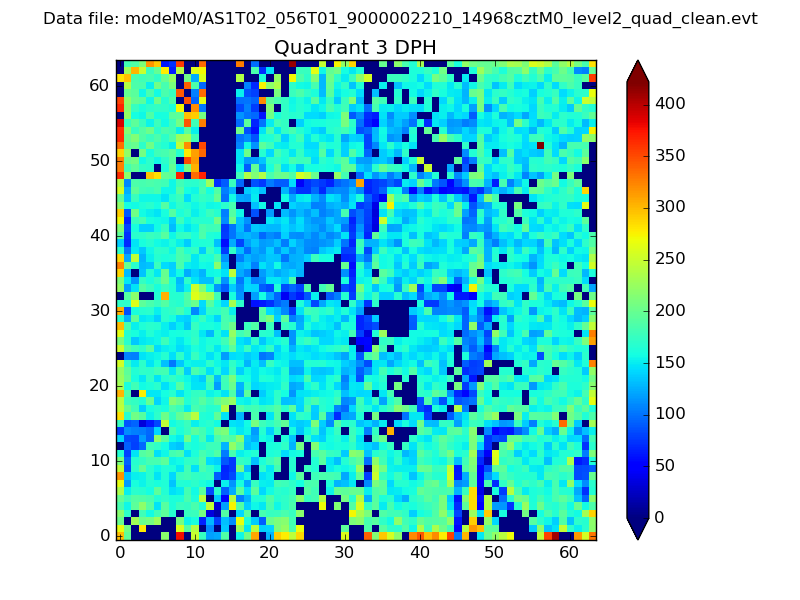 |
 |
Quadrant C |
| Plot type | Count rate plots | Images |
|---|---|---|
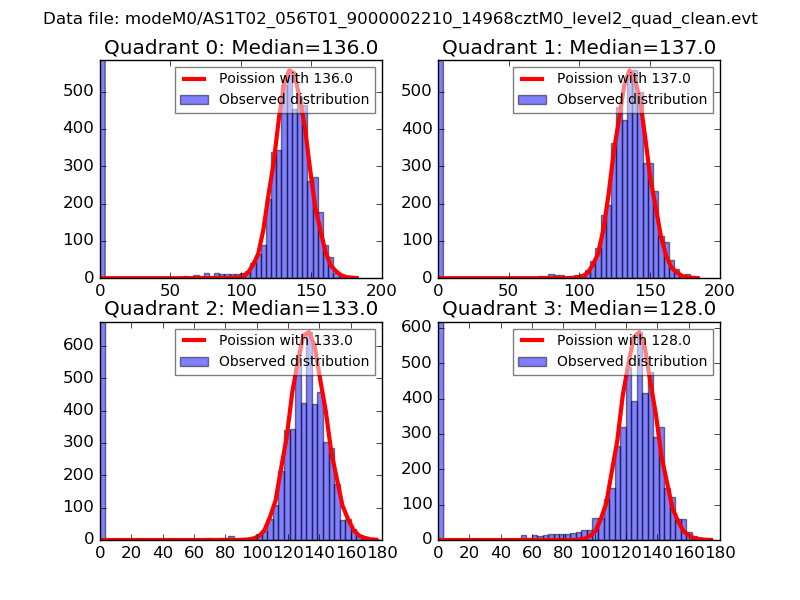
| Comparison with Poisson distribution Blue bars denote a histogram of data divided into 1 sec bins. Red curve is a Poisson curve with rate = median count rate of data. |
 |
 |
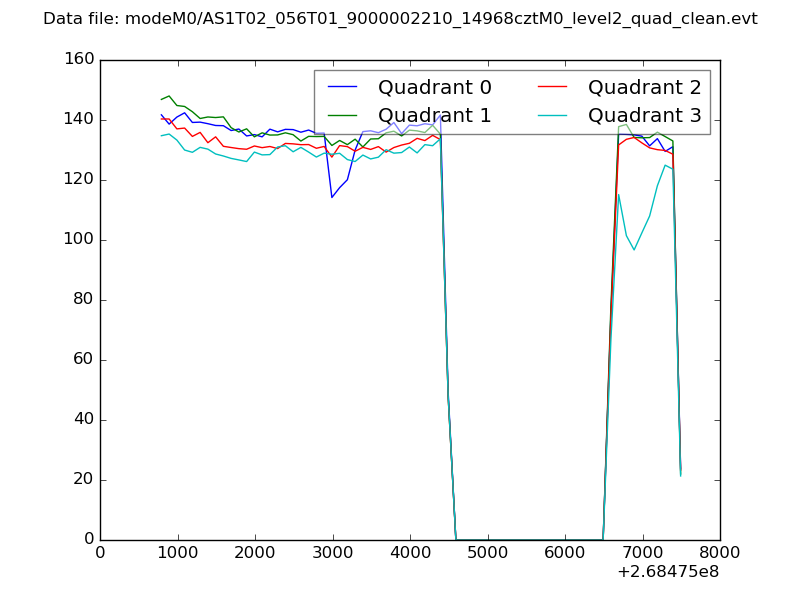
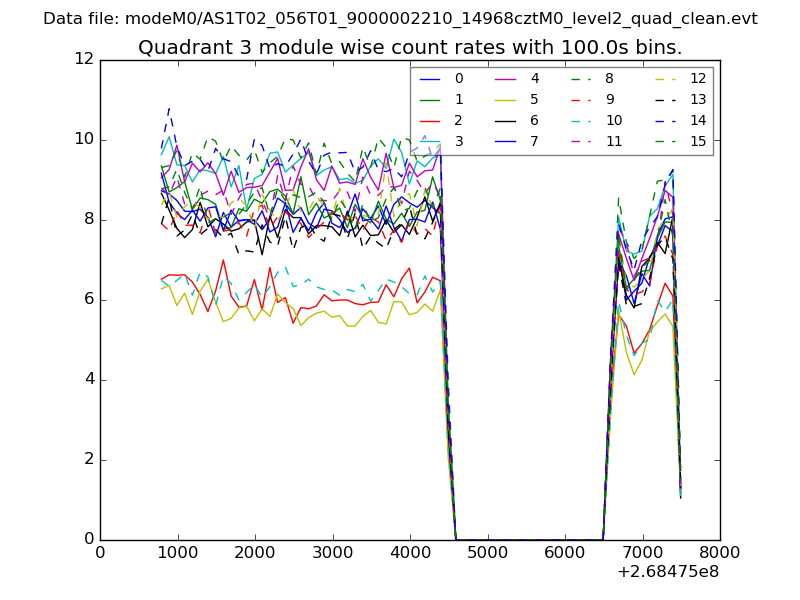
| Quadrant-wise count rates Data is divided into 100 sec bins |
 |
|
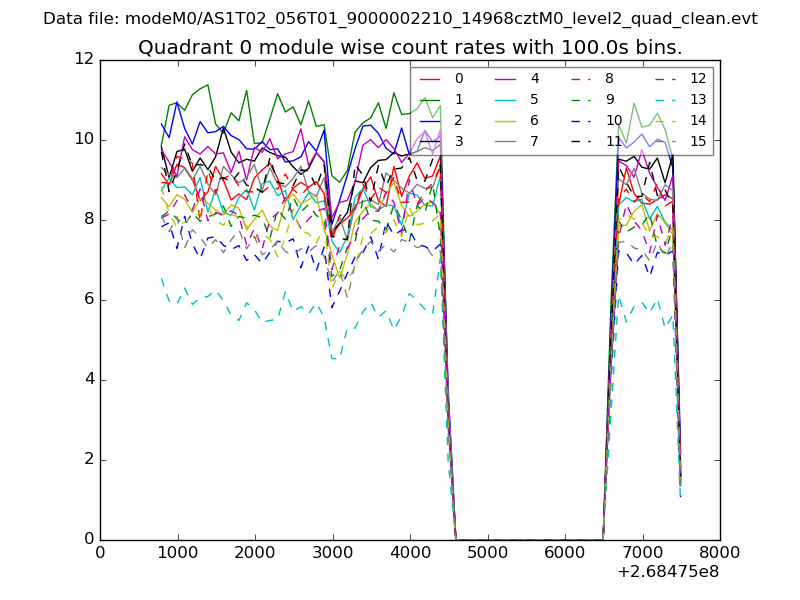
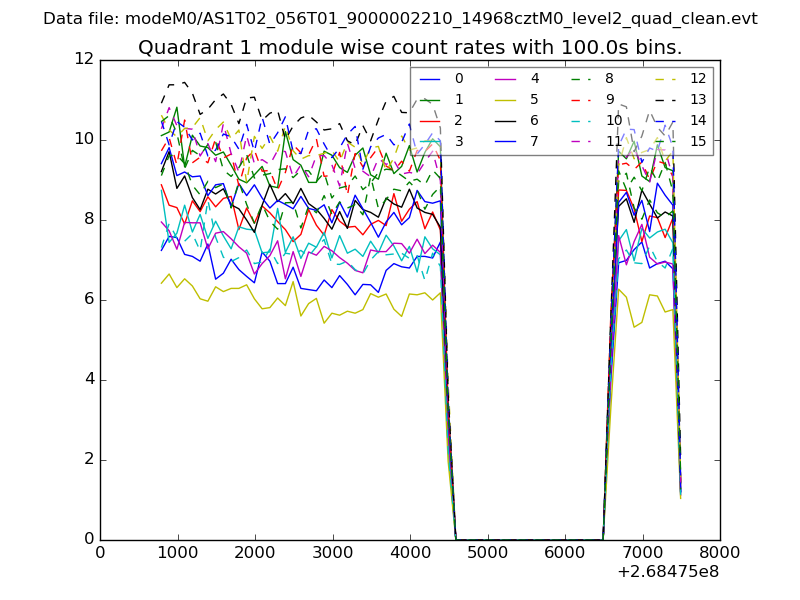
| Module-wise count rates for Quadrant A Data is divided into 100 sec bins |
 |
 |
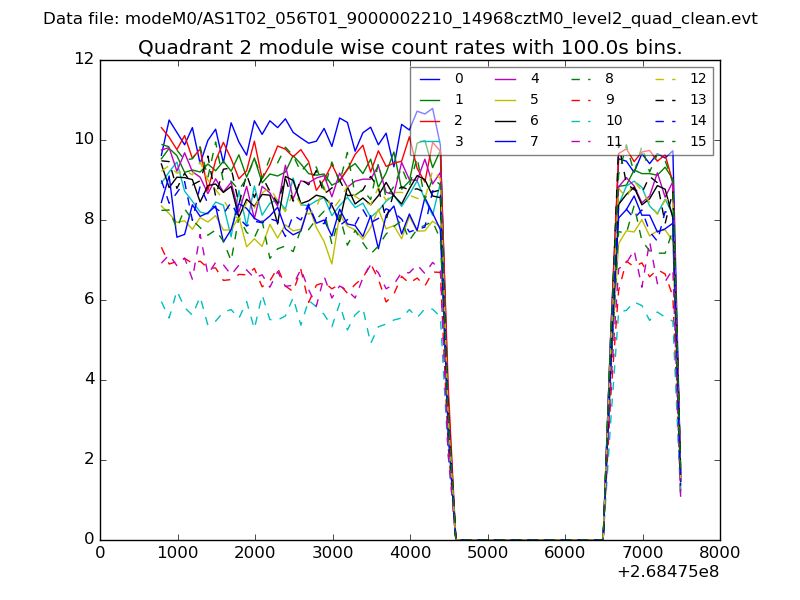
| Module-wise count rates for Quadrant B Data is divided into 100 sec bins |
 |
 |
| Module-wise count rates for Quadrant C Data is divided into 100 sec bins |
 |
 |
| Module-wise count rates for Quadrant D Data is divided into 100 sec bins |
 |
 |
| Parameter | Plot |
|---|---|
| CZT HV Monitor | 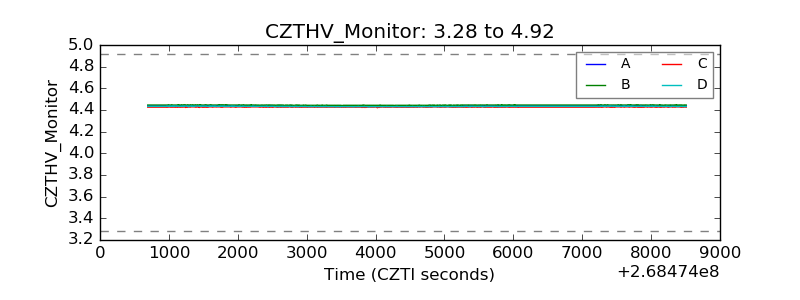 |
| D_VDD |  |
| Temperature 1 | 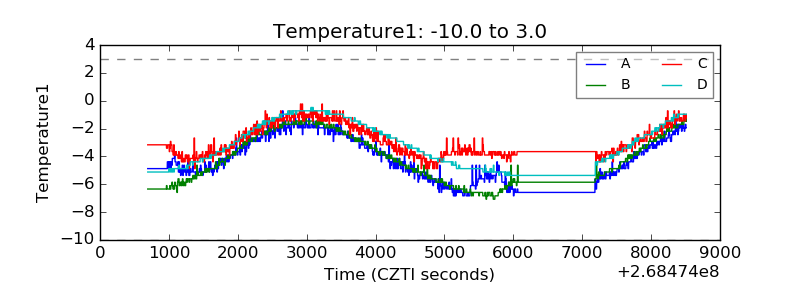 |
| Veto HV Monitor | 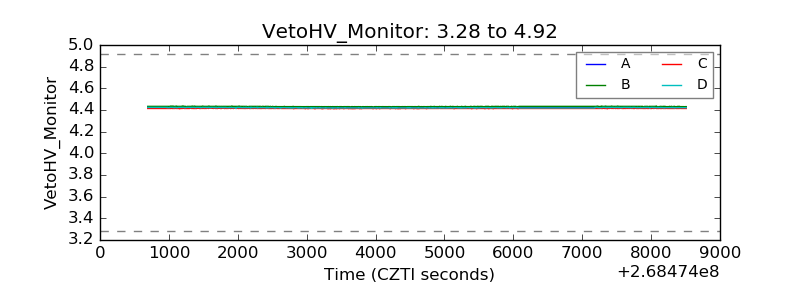 |
| Veto LLD | 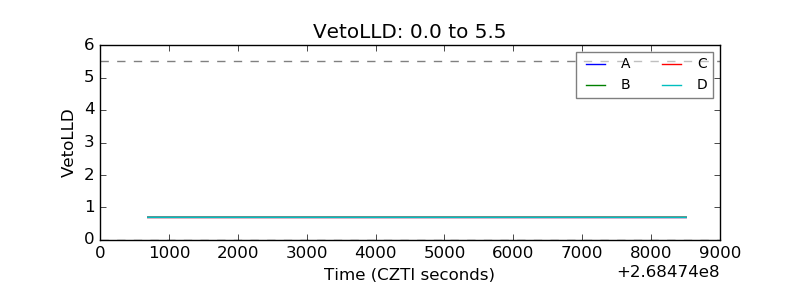 |
| Alpha Counter | 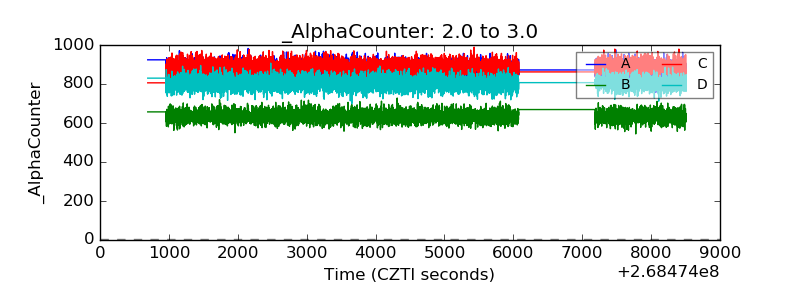 |
| _CPM_Rate | 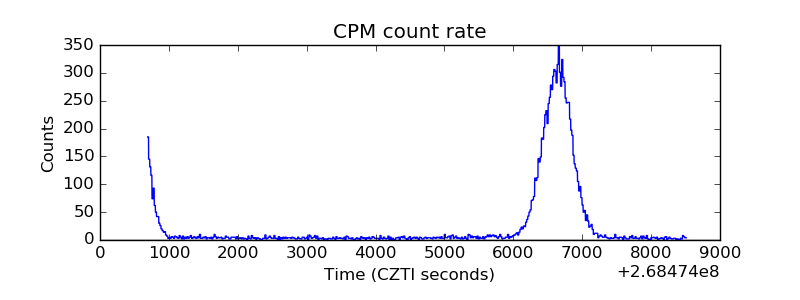 |
| CZT Counter | 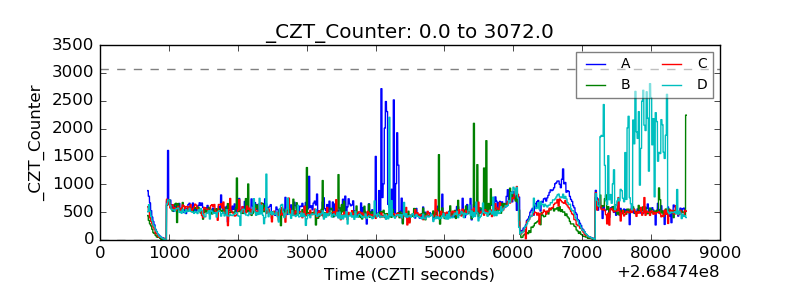 |
| +2.5 Volts monitor |  |
| +5 Volts monitor |  |
| _ROLL_ROT | 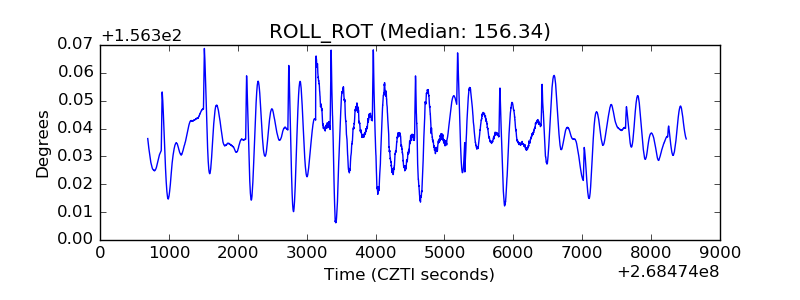 |
| _Roll_DEC | 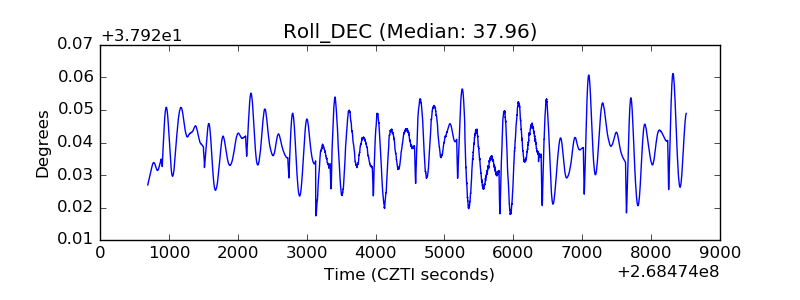 |
| _Roll_RA | 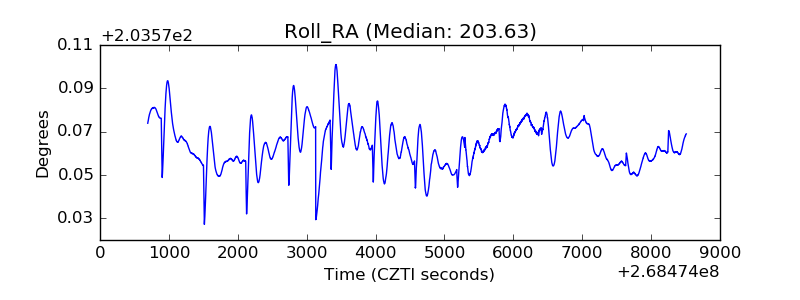 |
| Veto Counter | 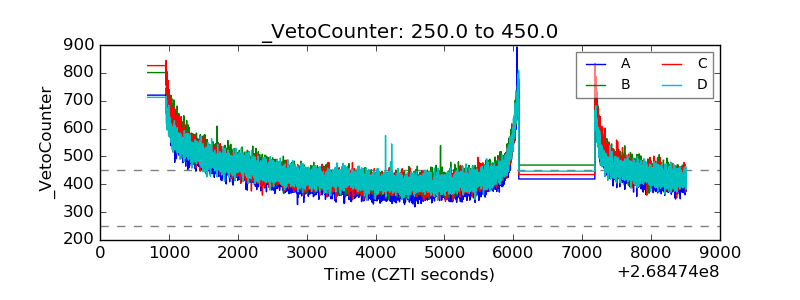 |