| Param | Original file | Final file |
|---|---|---|
| Filename | modeM0/AS1T02_056T01_9000002210_14969cztM0_level2.evt | modeM0/AS1T02_056T01_9000002210_14969cztM0_level2_quad_clean.evt |
| Size (bytes) | 614,419,200 | 104,958,720 |
| Size | 586.0 MB | 100.1 MB |
| Events in quadrant A | 3,717,542 | 691,387 |
| Events in quadrant B | 4,279,520 | 677,411 |
| Events in quadrant C | 3,469,401 | 673,165 |
| Events in quadrant D | 6,660,236 | 641,909 |
| Mode M0 | |||
|---|---|---|---|
| Quadrant | BADHDUFLAG | Total packets | Discarded packets |
| A | 0 | 15309 | 3 |
| B | 0 | 17124 | 2 |
| C | 0 | 14613 | 2 |
| D | 0 | 24715 | 2 |
| Mode M9 | |||
|---|---|---|---|
| Quadrant | BADHDUFLAG | Total packets | Discarded packets |
| A | 0 | 14 | 0 |
| B | 0 | 14 | 0 |
| C | 0 | 14 | 0 |
| D | 0 | 15 | 0 |
| Mode SS | |||
|---|---|---|---|
| Quadrant | BADHDUFLAG | Total packets | Discarded packets |
| A | 0 | 144 | 0 |
| B | 0 | 144 | 0 |
| C | 0 | 144 | 0 |
| D | 0 | 144 | 0 |
| Quadrant | Total seconds | Saturated seconds | Saturation percentage |
|---|---|---|---|
| A | 7101 | 122 | 1.718068% |
| B | 7101 | 288 | 4.055767% |
| C | 7101 | 73 | 1.028024% |
| D | 7101 | 915 | 12.885509% |
Noise dominated data is calculated using 1-second bins in cleaned event files. If a bin has >2000 counts, and if more than 50% of those come from <1% of pixels, then it is considered to be noise-dominated and hence unusable.
| Quadrant | # 1 sec bins | Bins with >0 counts | Bins with >2000 counts | High rate bins dominated by noise | Noise dominated (total time) | Noise dominated (detector-on time) | Marked lightcurve |
|---|---|---|---|---|---|---|---|
| A | 7882 | 7103 | 11 | 11 | 0.14% | 0.15% | 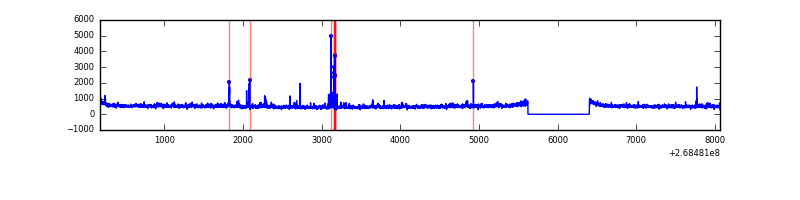 |
| B | 7882 | 7103 | 140 | 140 | 1.78% | 1.97% | 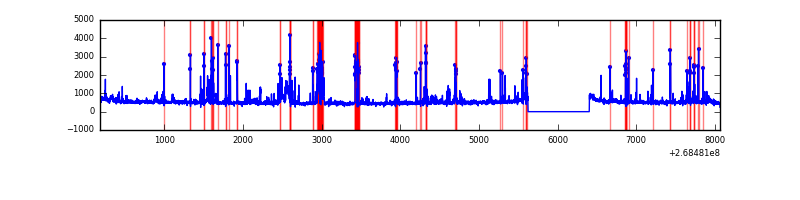 |
| C | 7882 | 7103 | 0 | 0 | 0.00% | 0.00% | 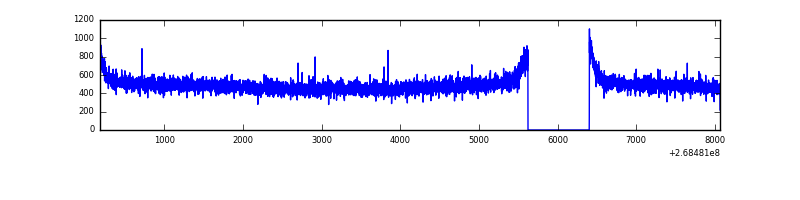 |
| D | 7882 | 7103 | 820 | 820 | 10.40% | 11.54% | 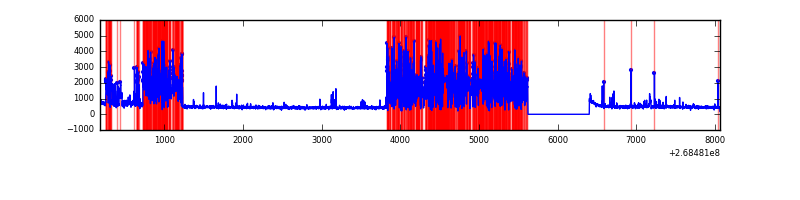 |
Top three noisy pixels from each quadrant. If the there are fewer than three noisy pixels in the level2.evt file, extra rows are filled as -1
| Pixel properties | Quadrant properties | ||||||
|---|---|---|---|---|---|---|---|
| Quadrant | DetID | PixID | Counts | Sigma | Mean | Median | Sigma |
| A | 12 | 189 | 110347 | 612.98 | 877 | 857 | 178.6 |
| A | 13 | 248 | 69345 | 383.43 | 877 | 857 | 178.6 |
| A | 1 | 162 | 65389 | 361.28 | 877 | 857 | 178.6 |
| B | 3 | 64 | 443765 | 2714.88 | 857 | 836 | 163.1 |
| B | 0 | 228 | 154242 | 940.28 | 857 | 836 | 163.1 |
| B | 10 | 16 | 144630 | 881.37 | 857 | 836 | 163.1 |
| C | 3 | 233 | 176321 | 902.05 | 843 | 846 | 194.5 |
| C | 7 | 247 | 8189 | 37.75 | 843 | 846 | 194.5 |
| C | 13 | 61 | 6030 | 26.65 | 843 | 846 | 194.5 |
| D | 7 | 223 | 3405797 | 15975.44 | 812 | 794 | 213.1 |
| D | 13 | 249 | 63879 | 295.98 | 812 | 794 | 213.1 |
| D | 10 | 70 | 41272 | 189.91 | 812 | 794 | 213.1 |
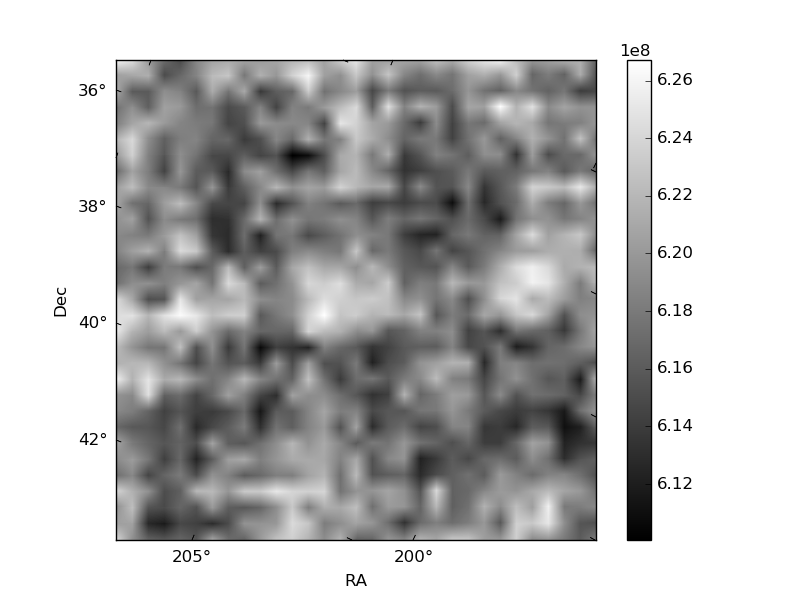
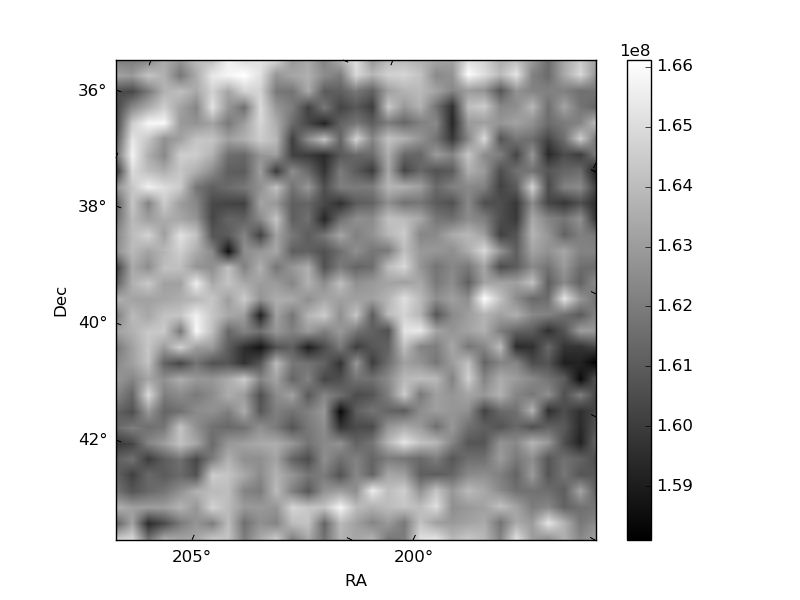
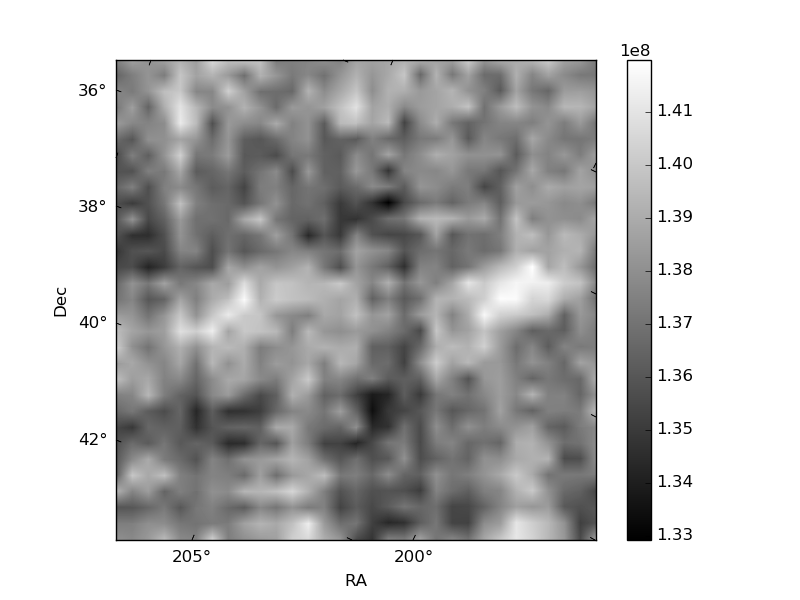
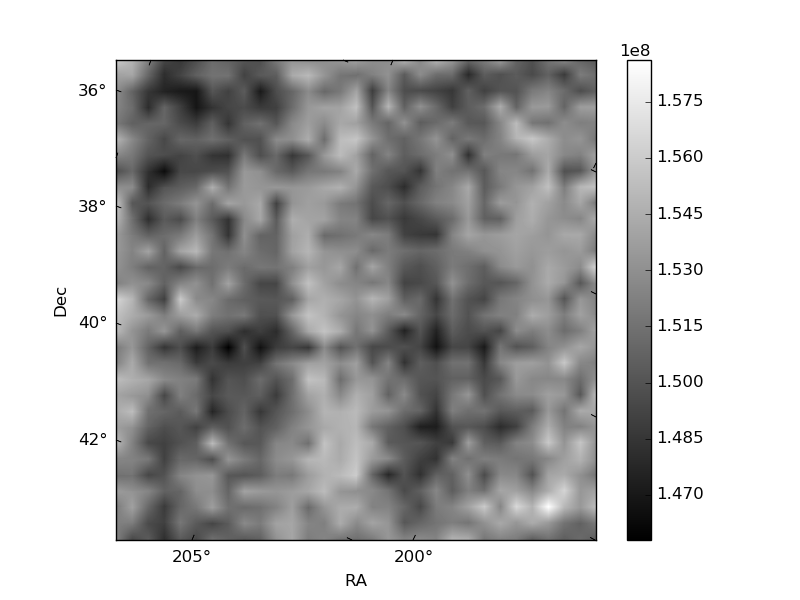
Histogram calculated using DETX and DETY for each event in the final _common_clean file
| Quadrant A | 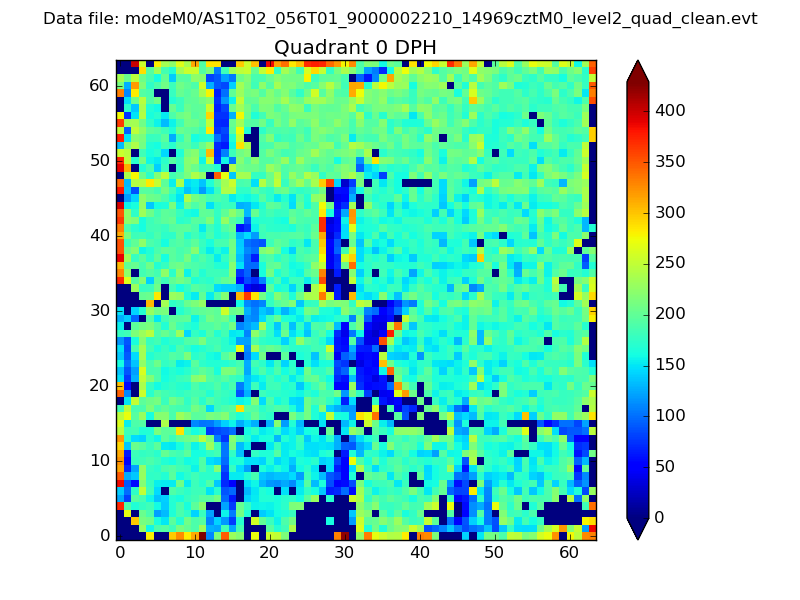 |
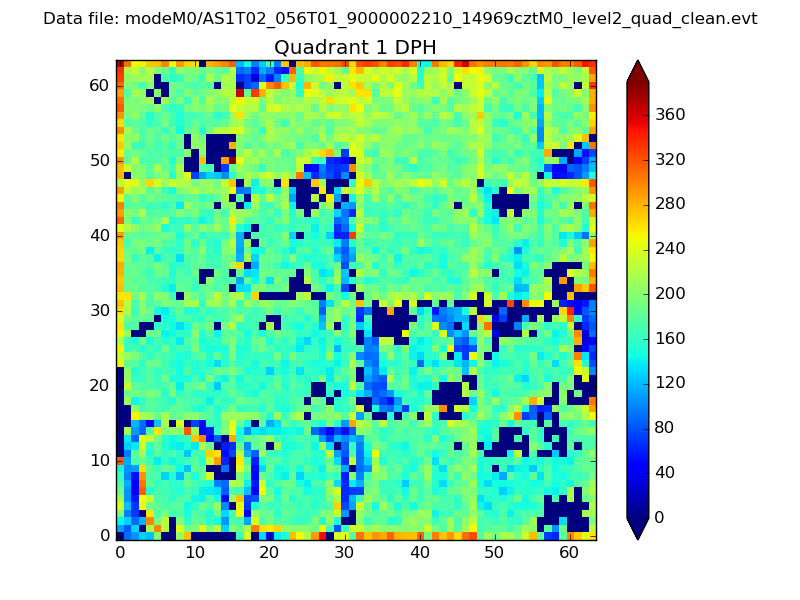 |
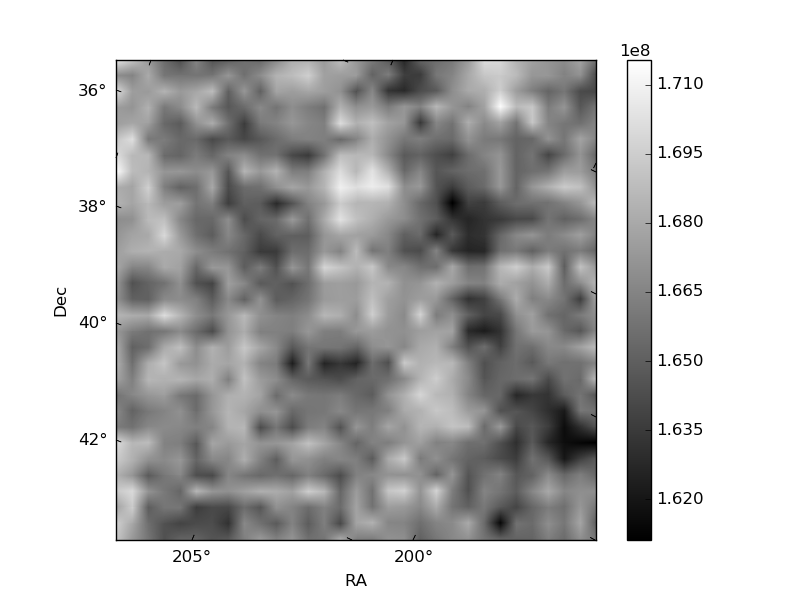
Quadrant B |
|---|---|---|---|
| Quadrant D | 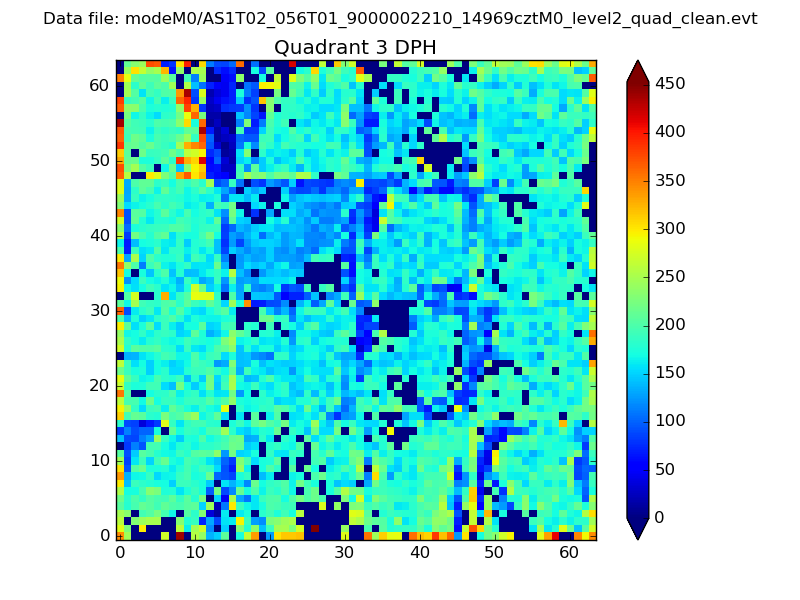 |
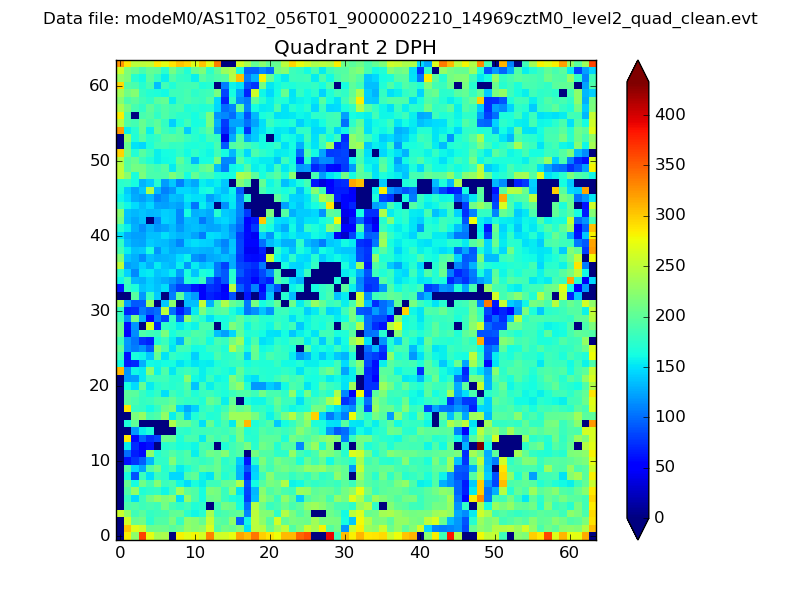 |
Quadrant C |
| Plot type | Count rate plots | Images |
|---|---|---|
| Comparison with Poisson distribution Blue bars denote a histogram of data divided into 1 sec bins. Red curve is a Poisson curve with rate = median count rate of data. |
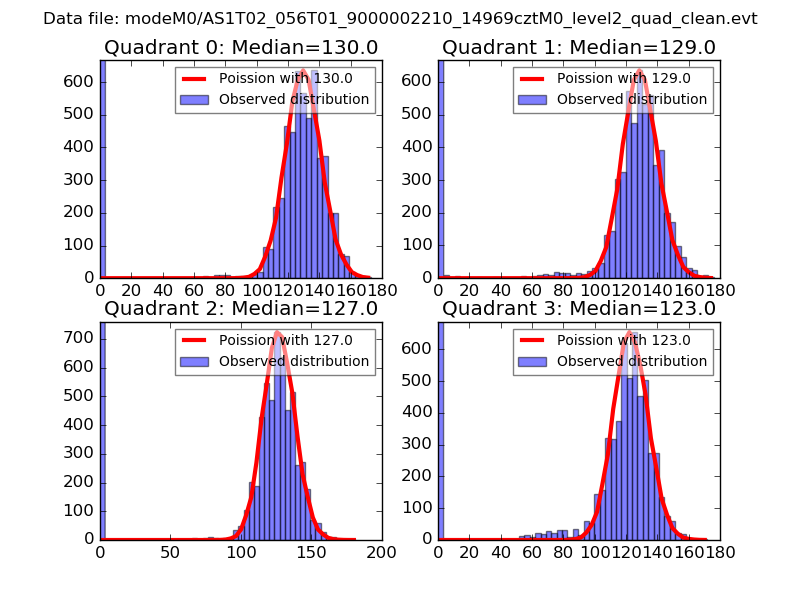 |
 |
| Quadrant-wise count rates Data is divided into 100 sec bins |
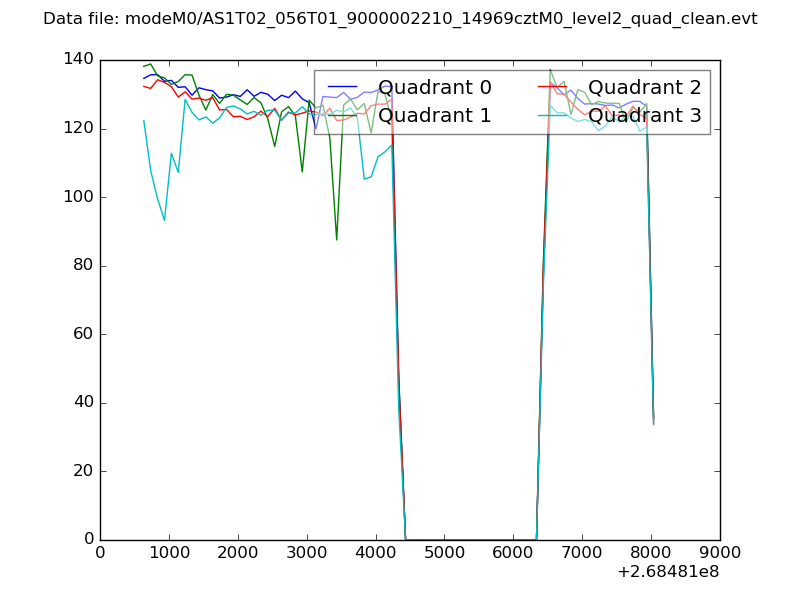 |
|
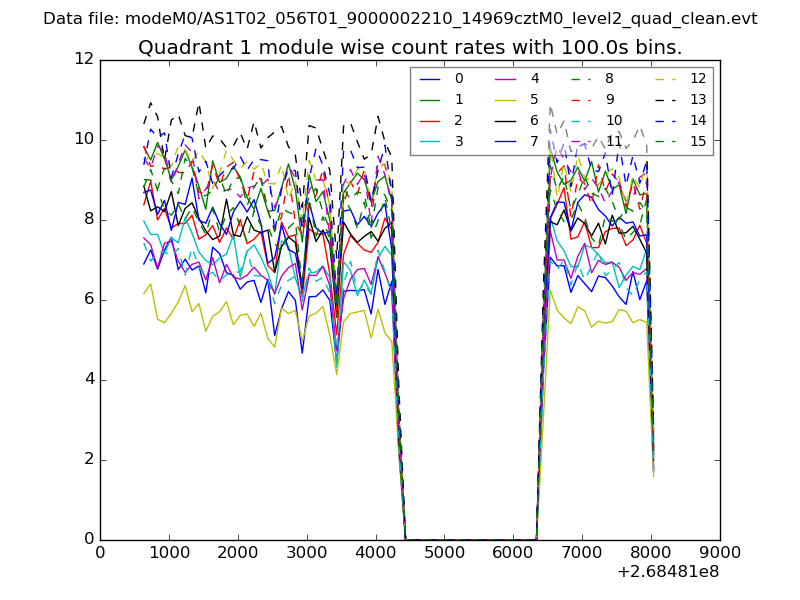
| Module-wise count rates for Quadrant A Data is divided into 100 sec bins |
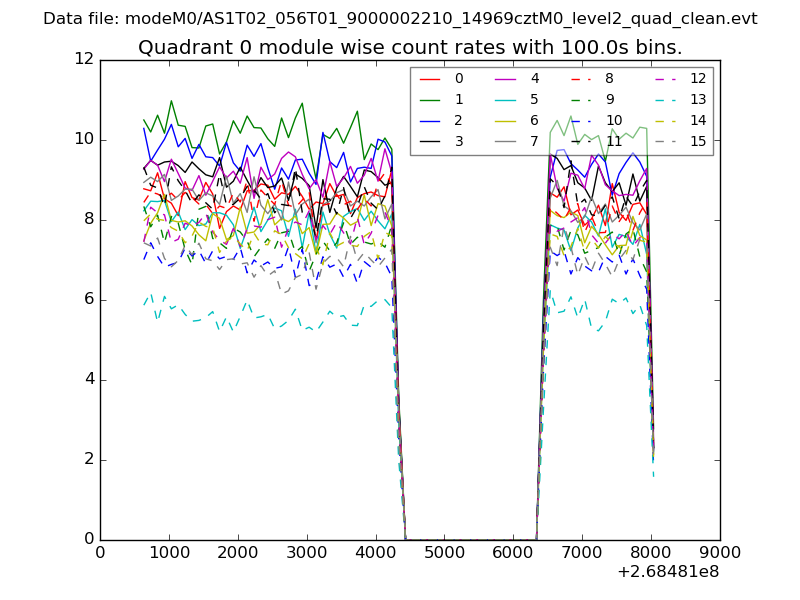 |
 |
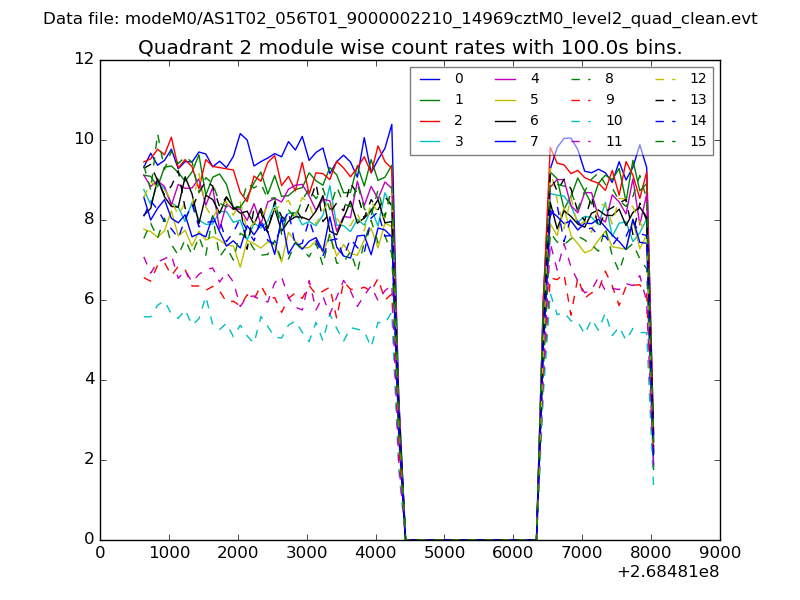
| Module-wise count rates for Quadrant B Data is divided into 100 sec bins |
 |
 |
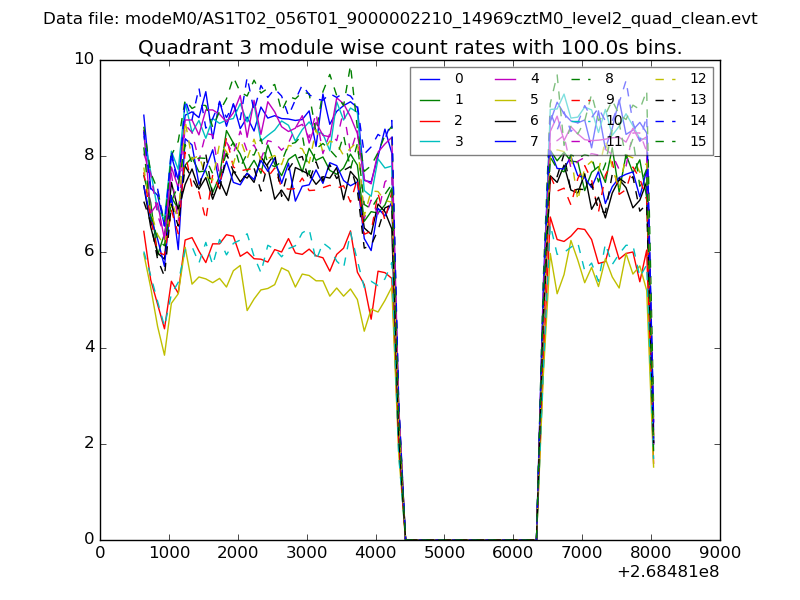
| Module-wise count rates for Quadrant C Data is divided into 100 sec bins |
 |
 |
| Module-wise count rates for Quadrant D Data is divided into 100 sec bins |
 |
 |
| Parameter | Plot |
|---|---|
| CZT HV Monitor | 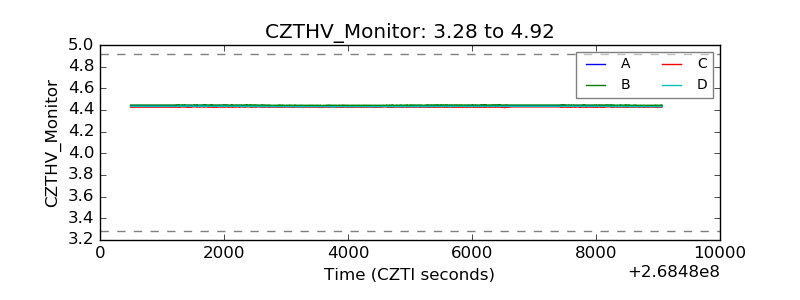 |
| D_VDD | 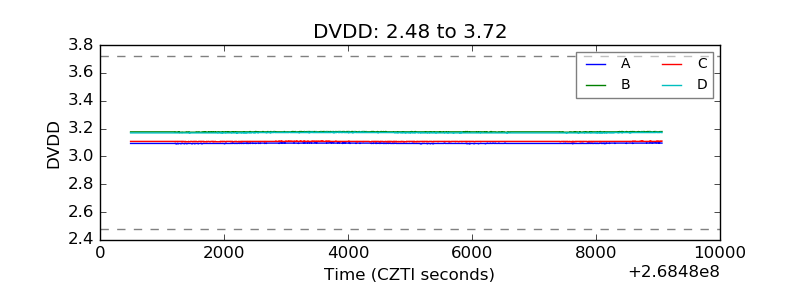 |
| Temperature 1 | 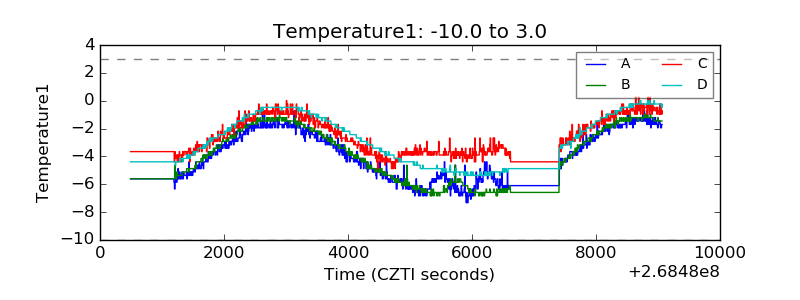 |
| Veto HV Monitor | 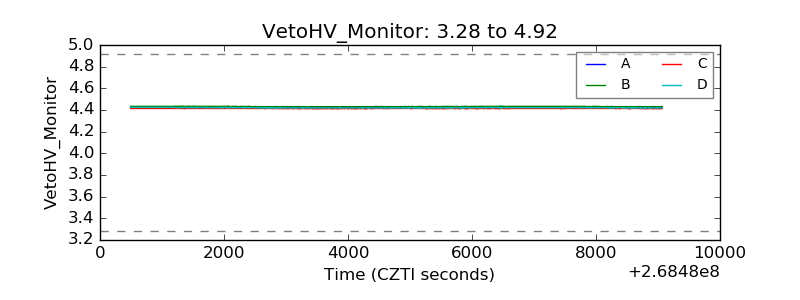 |
| Veto LLD | 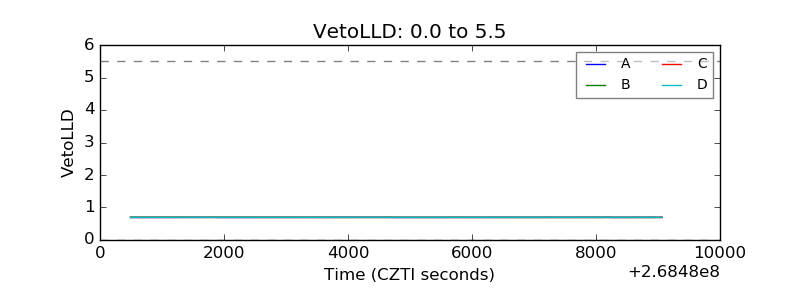 |
| Alpha Counter | 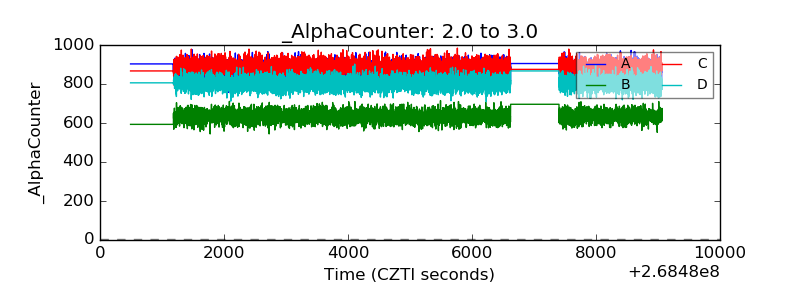 |
| _CPM_Rate | 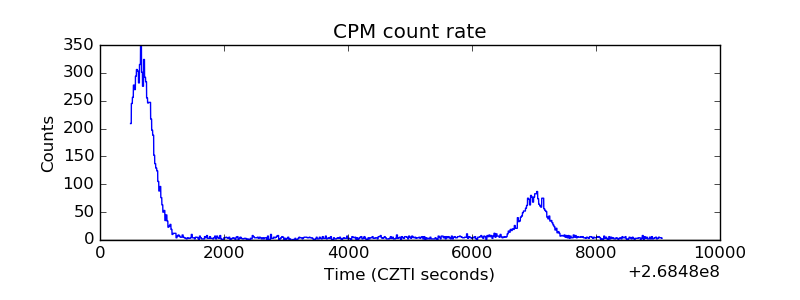 |
| CZT Counter | 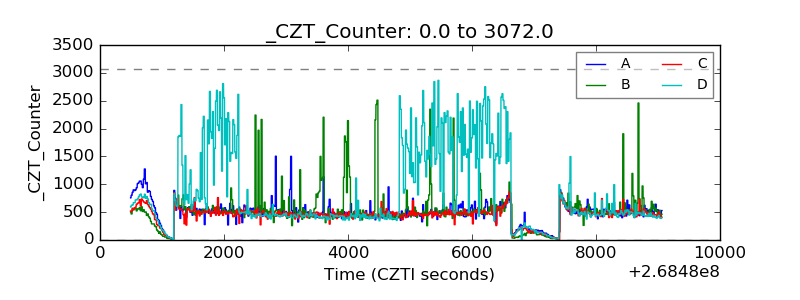 |
| +2.5 Volts monitor |  |
| +5 Volts monitor |  |
| _ROLL_ROT | 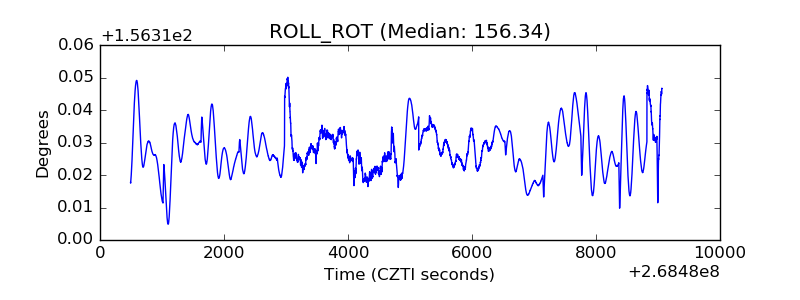 |
| _Roll_DEC | 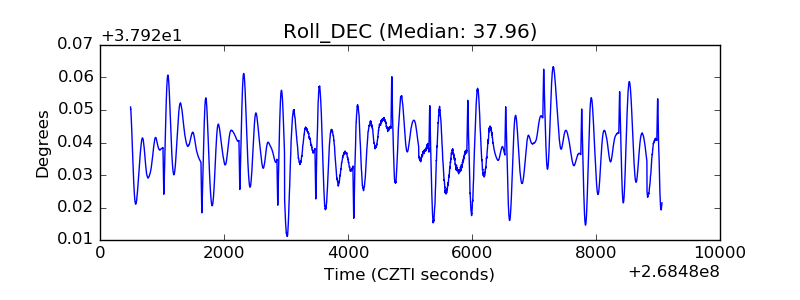 |
| _Roll_RA | 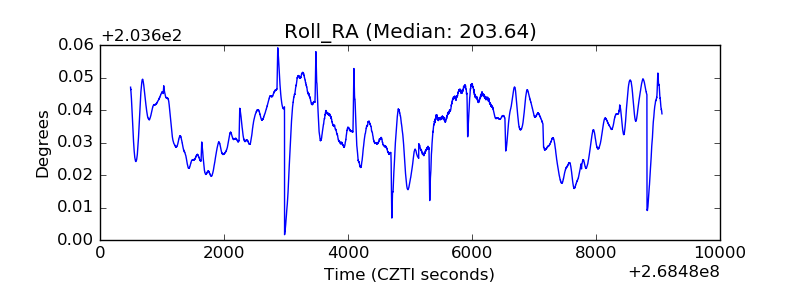 |
| Veto Counter | 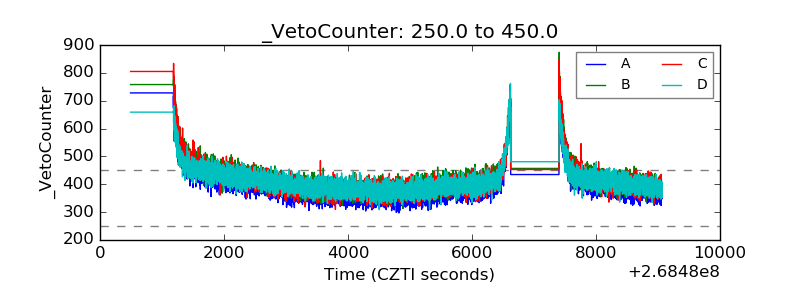 |