| Param | Original file | Final file |
|---|---|---|
| Filename | modeM0/AS1T02_056T01_9000002210_14970cztM0_level2.evt | modeM0/AS1T02_056T01_9000002210_14970cztM0_level2_quad_clean.evt |
| Size (bytes) | 508,904,640 | 103,507,200 |
| Size | 485.3 MB | 98.7 MB |
| Events in quadrant A | 3,717,991 | 670,721 |
| Events in quadrant B | 4,074,911 | 662,948 |
| Events in quadrant C | 3,515,042 | 652,999 |
| Events in quadrant D | 3,609,594 | 640,799 |
| Mode M0 | |||
|---|---|---|---|
| Quadrant | BADHDUFLAG | Total packets | Discarded packets |
| A | 0 | 15508 | 2 |
| B | 0 | 16583 | 1 |
| C | 0 | 15003 | 1 |
| D | 0 | 15790 | 1 |
| Mode M9 | |||
|---|---|---|---|
| Quadrant | BADHDUFLAG | Total packets | Discarded packets |
| A | 0 | 4 | 0 |
| B | 0 | 4 | 0 |
| C | 0 | 4 | 0 |
| D | 0 | 4 | 0 |
| Mode SS | |||
|---|---|---|---|
| Quadrant | BADHDUFLAG | Total packets | Discarded packets |
| A | 0 | 150 | 0 |
| B | 0 | 150 | 0 |
| C | 0 | 150 | 0 |
| D | 0 | 150 | 0 |
| Quadrant | Total seconds | Saturated seconds | Saturation percentage |
|---|---|---|---|
| A | 7277 | 95 | 1.305483% |
| B | 7277 | 197 | 2.707160% |
| C | 7277 | 48 | 0.659612% |
| D | 7277 | 155 | 2.129999% |
Noise dominated data is calculated using 1-second bins in cleaned event files. If a bin has >2000 counts, and if more than 50% of those come from <1% of pixels, then it is considered to be noise-dominated and hence unusable.
| Quadrant | # 1 sec bins | Bins with >0 counts | Bins with >2000 counts | High rate bins dominated by noise | Noise dominated (total time) | Noise dominated (detector-on time) | Marked lightcurve |
|---|---|---|---|---|---|---|---|
| A | 7703 | 7280 | 5 | 5 | 0.06% | 0.07% | 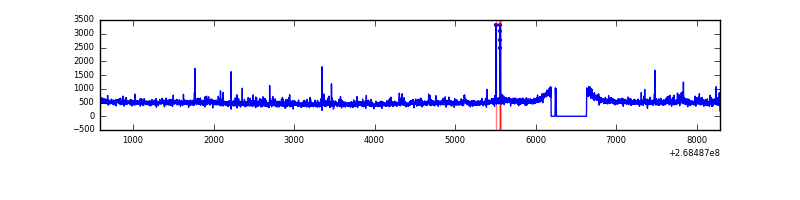 |
| B | 7703 | 7280 | 74 | 74 | 0.96% | 1.02% | 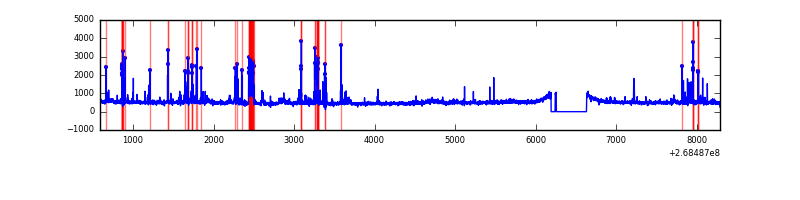 |
| C | 7703 | 7280 | 3 | 3 | 0.04% | 0.04% | 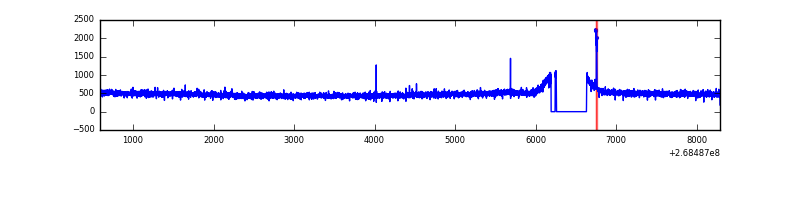 |
| D | 7703 | 7280 | 50 | 50 | 0.65% | 0.69% | 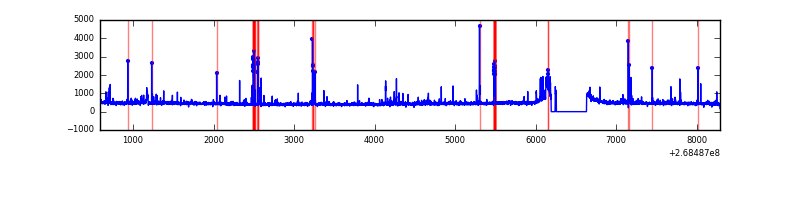 |
Top three noisy pixels from each quadrant. If the there are fewer than three noisy pixels in the level2.evt file, extra rows are filled as -1
| Pixel properties | Quadrant properties | ||||||
|---|---|---|---|---|---|---|---|
| Quadrant | DetID | PixID | Counts | Sigma | Mean | Median | Sigma |
| A | 12 | 189 | 114882 | 631.11 | 886 | 867 | 180.7 |
| A | 1 | 162 | 74211 | 405.98 | 886 | 867 | 180.7 |
| A | 1 | 178 | 34093 | 183.92 | 886 | 867 | 180.7 |
| B | 3 | 64 | 321324 | 1906.17 | 875 | 853 | 168.1 |
| B | 10 | 16 | 143302 | 847.29 | 875 | 853 | 168.1 |
| B | 0 | 219 | 62136 | 364.51 | 875 | 853 | 168.1 |
| C | 3 | 233 | 159334 | 790.27 | 855 | 859 | 200.5 |
| C | 10 | 22 | 14026 | 65.66 | 855 | 859 | 200.5 |
| C | 13 | 61 | 6247 | 26.87 | 855 | 859 | 200.5 |
| D | 15 | 0 | 177653 | 814.48 | 855 | 835 | 217.1 |
| D | 7 | 38 | 50377 | 228.21 | 855 | 835 | 217.1 |
| D | 13 | 249 | 42152 | 190.32 | 855 | 835 | 217.1 |
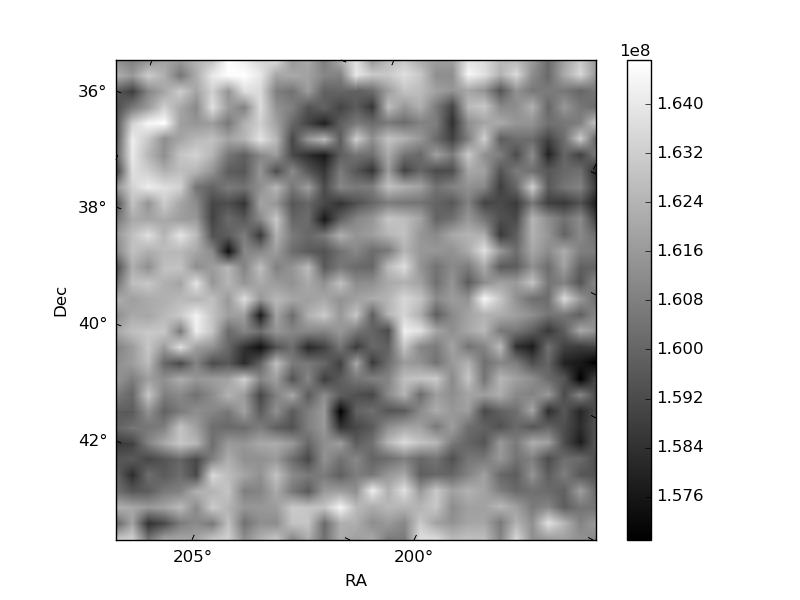
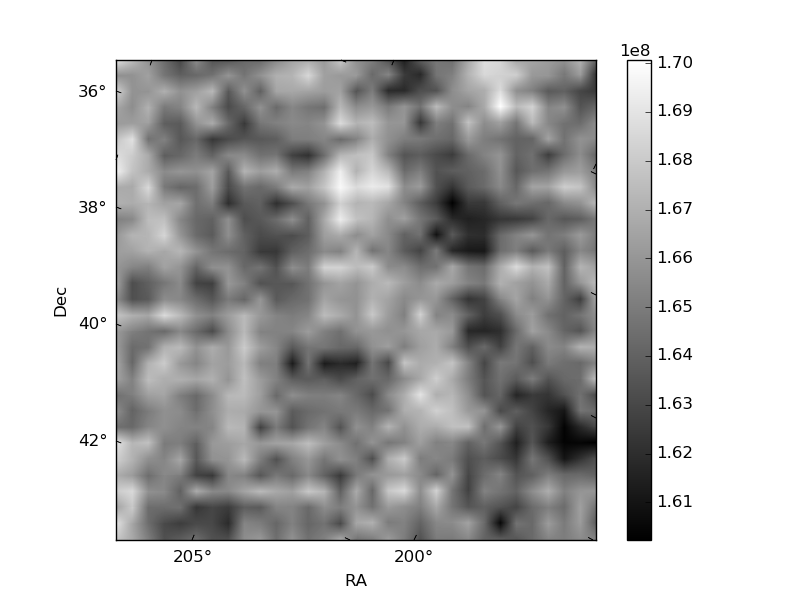
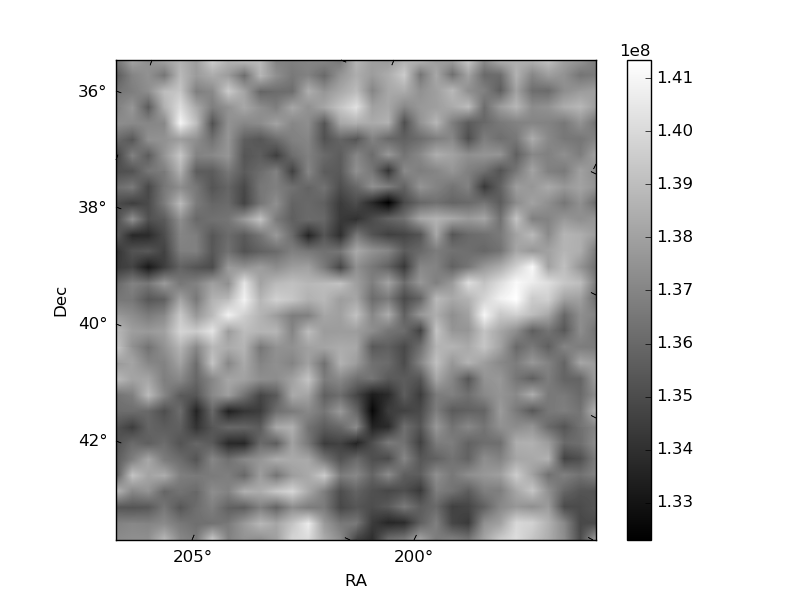
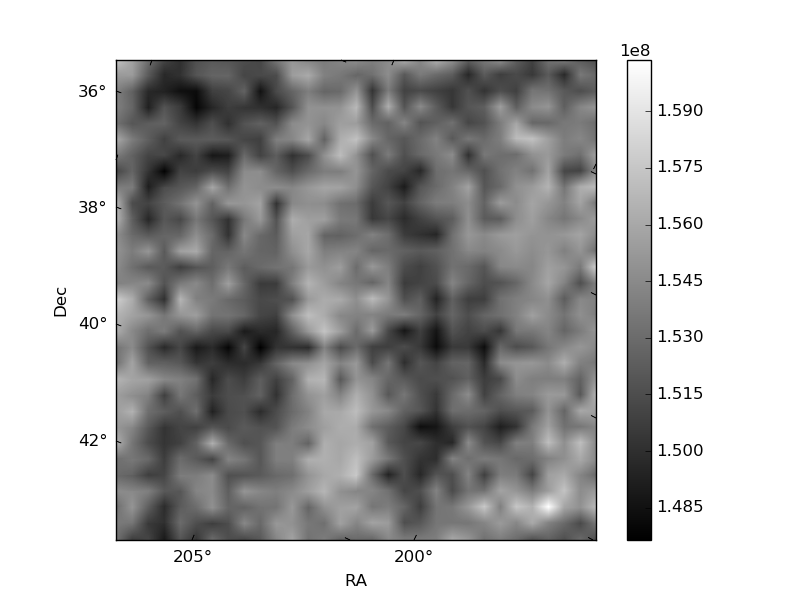
Histogram calculated using DETX and DETY for each event in the final _common_clean file
| Quadrant A |  |
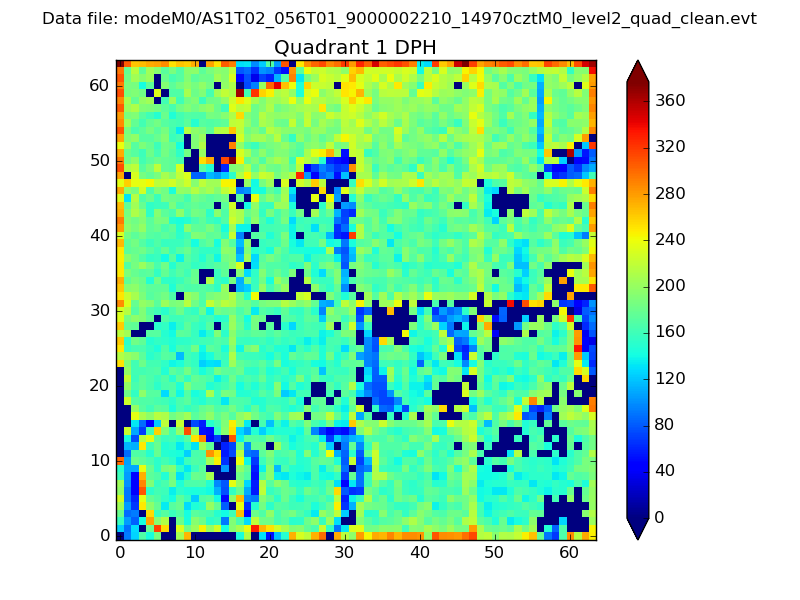 |
Quadrant B |
|---|---|---|---|
| Quadrant D |  |
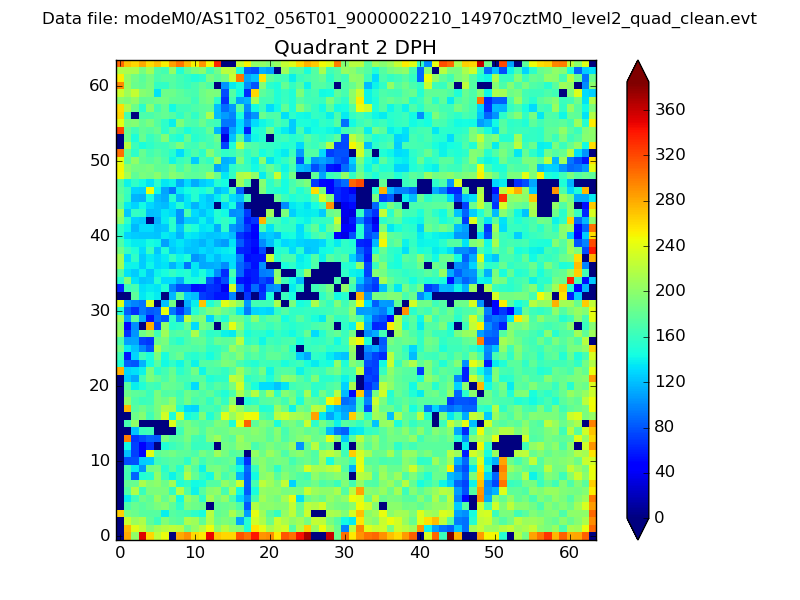 |
Quadrant C |
| Plot type | Count rate plots | Images |
|---|---|---|
| Comparison with Poisson distribution Blue bars denote a histogram of data divided into 1 sec bins. Red curve is a Poisson curve with rate = median count rate of data. |
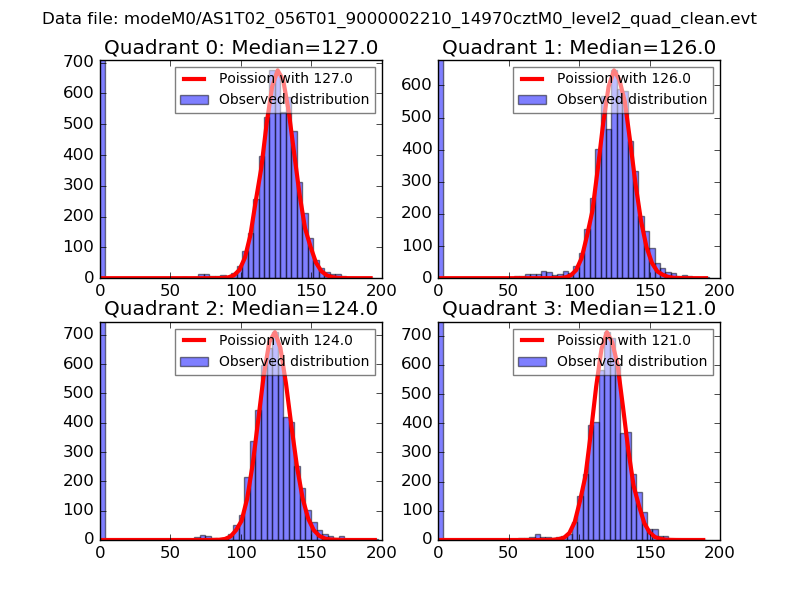 |
 |
| Quadrant-wise count rates Data is divided into 100 sec bins |
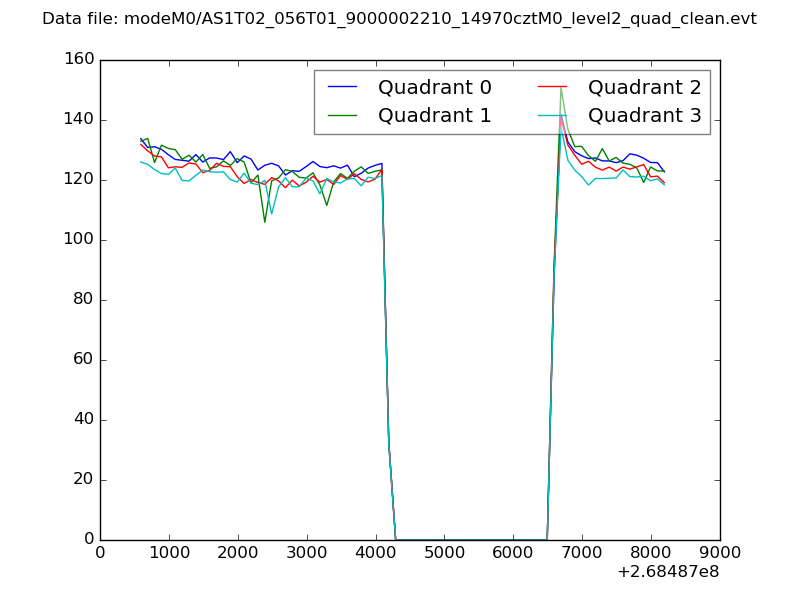 |
|
| Module-wise count rates for Quadrant A Data is divided into 100 sec bins |
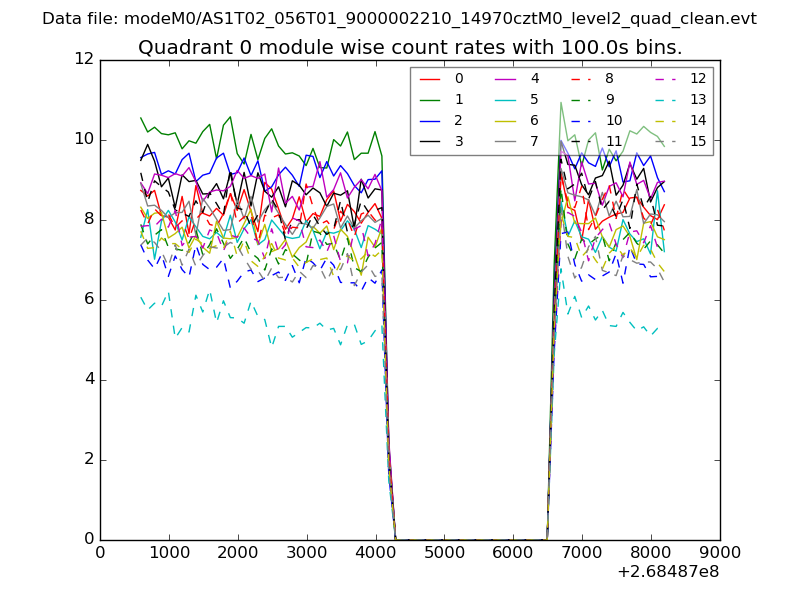 |
 |
| Module-wise count rates for Quadrant B Data is divided into 100 sec bins |
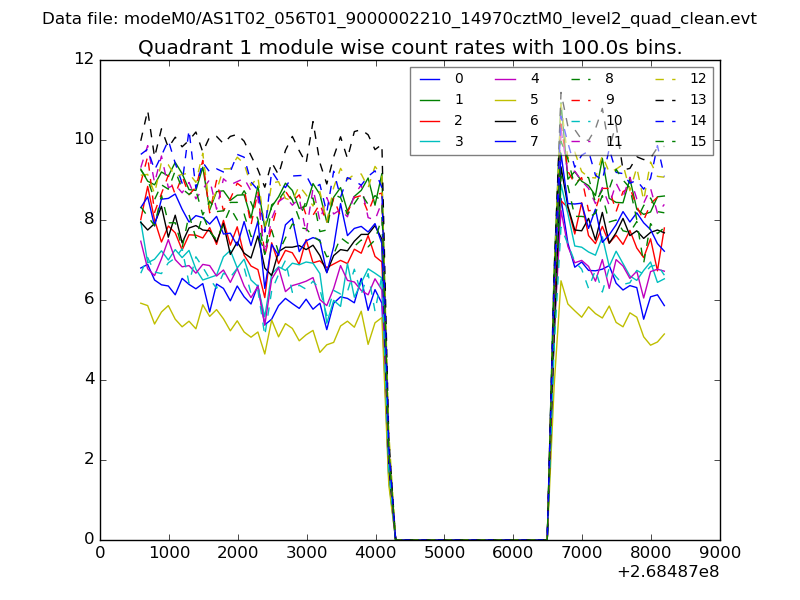 |
 |
| Module-wise count rates for Quadrant C Data is divided into 100 sec bins |
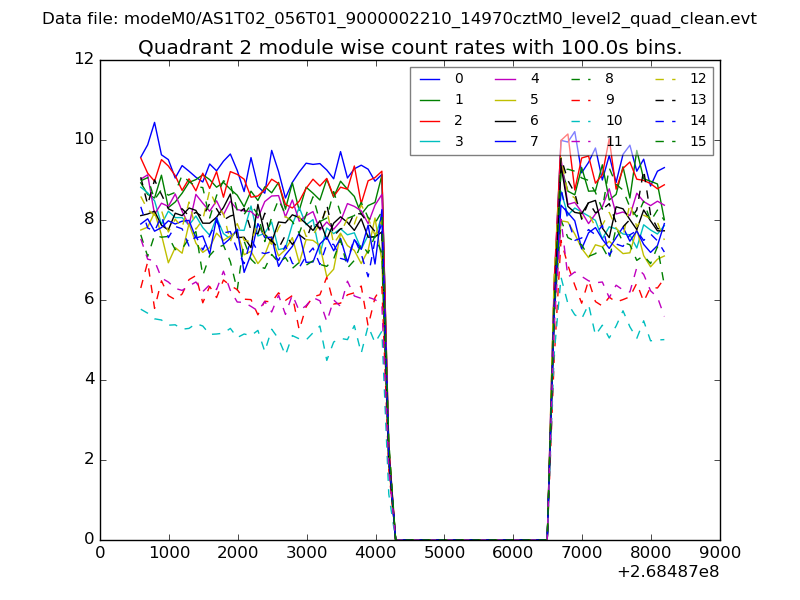 |
 |
| Module-wise count rates for Quadrant D Data is divided into 100 sec bins |
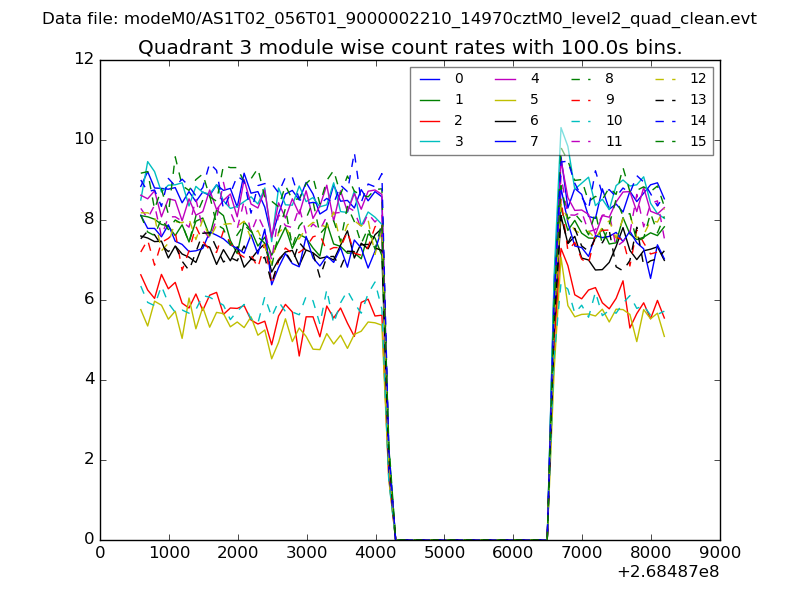 |
 |
| Parameter | Plot |
|---|---|
| CZT HV Monitor | 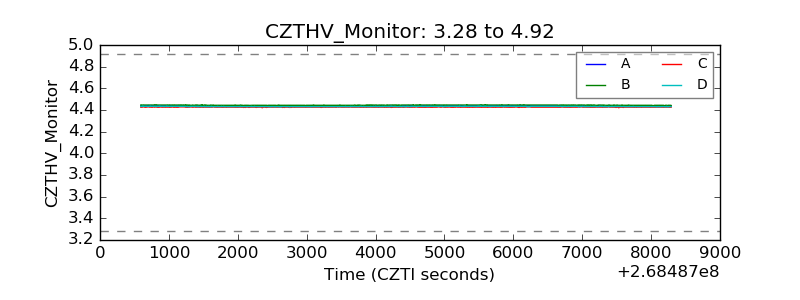 |
| D_VDD | 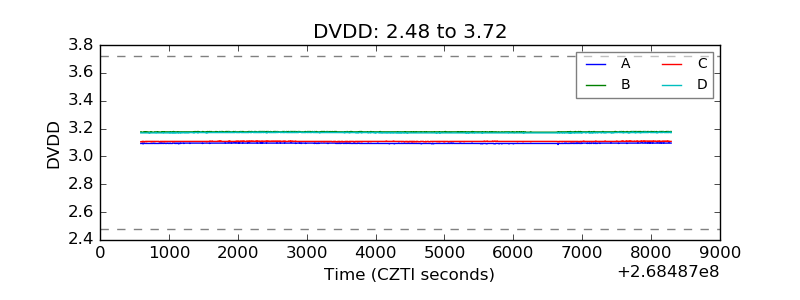 |
| Temperature 1 | 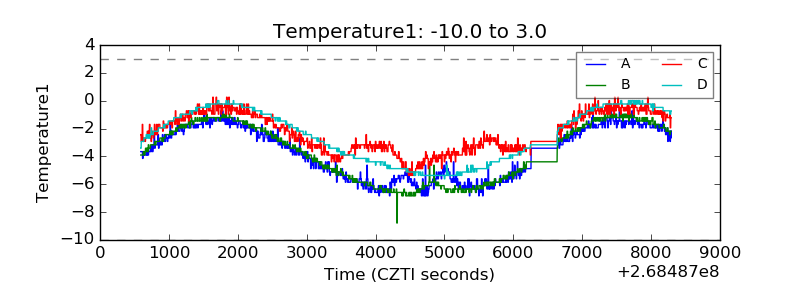 |
| Veto HV Monitor | 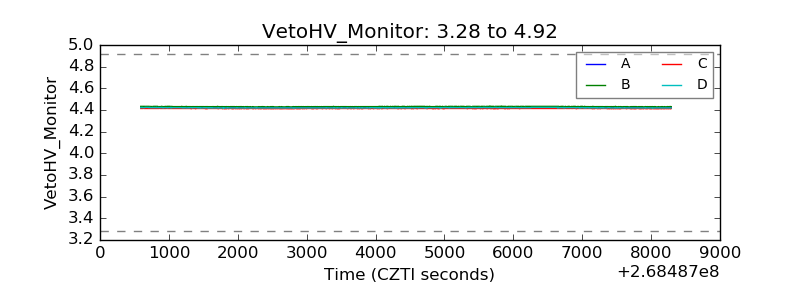 |
| Veto LLD | 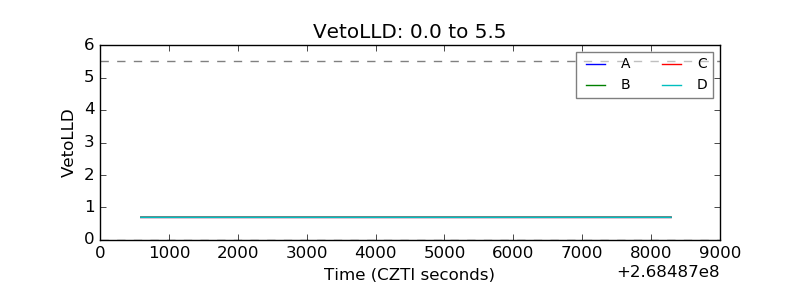 |
| Alpha Counter | 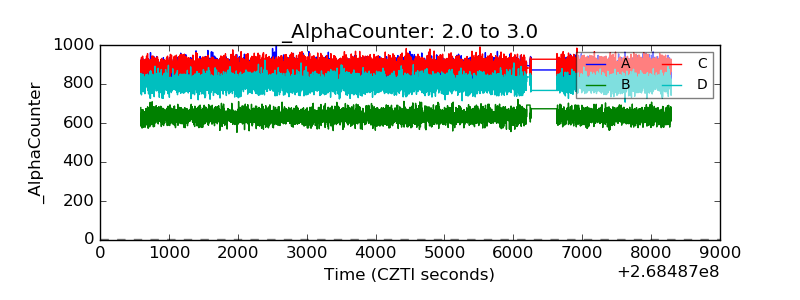 |
| _CPM_Rate | 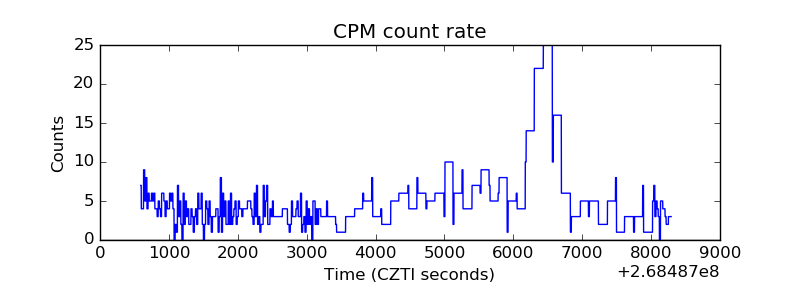 |
| CZT Counter | 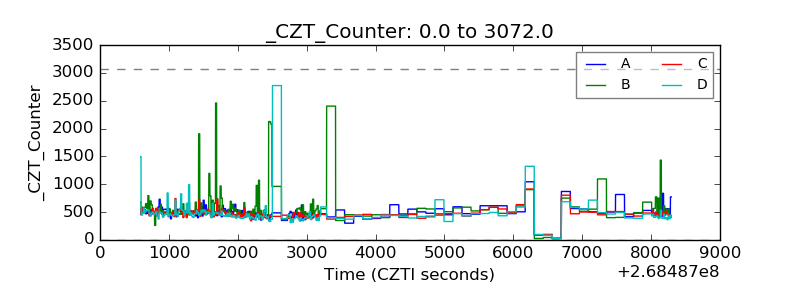 |
| +2.5 Volts monitor |  |
| +5 Volts monitor |  |
| _ROLL_ROT | 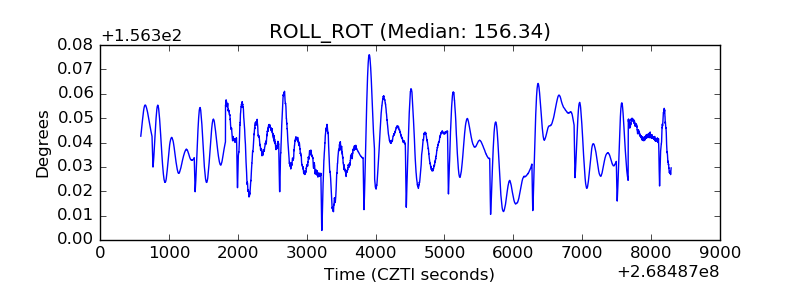 |
| _Roll_DEC | 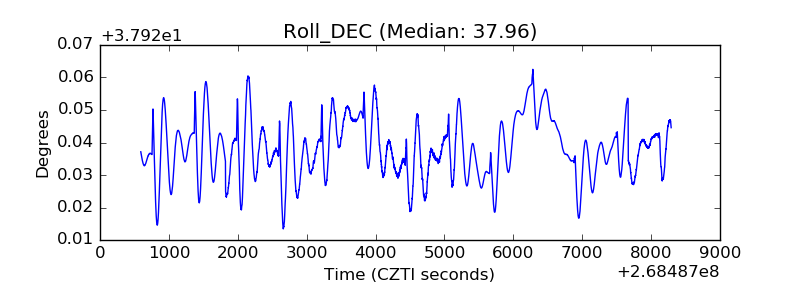 |
| _Roll_RA | 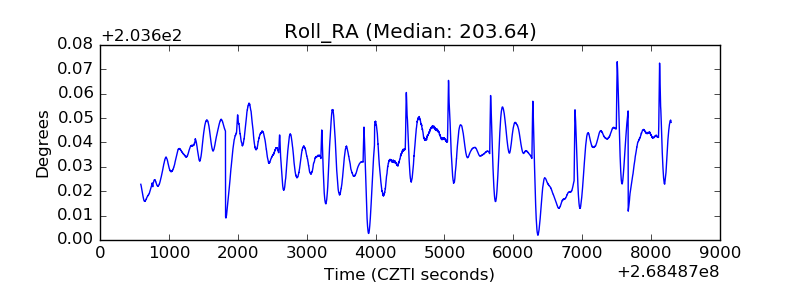 |
| Veto Counter | 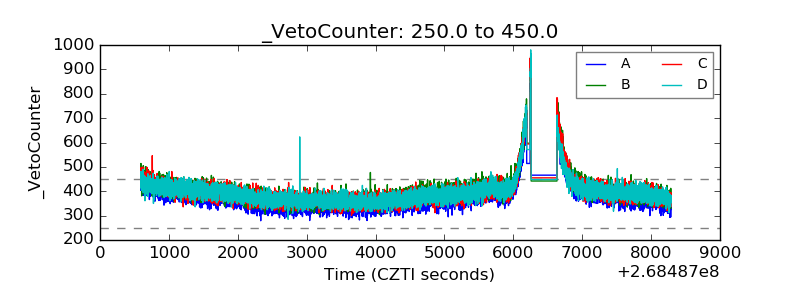 |