| Param | Original file | Final file |
|---|---|---|
| Filename | modeM0/AS1T02_056T01_9000002210_14971cztM0_level2.evt | modeM0/AS1T02_056T01_9000002210_14971cztM0_level2_quad_clean.evt |
| Size (bytes) | 497,531,520 | 96,739,200 |
| Size | 474.5 MB | 92.3 MB |
| Events in quadrant A | 3,667,302 | 619,084 |
| Events in quadrant B | 3,795,162 | 615,980 |
| Events in quadrant C | 3,469,781 | 608,768 |
| Events in quadrant D | 3,658,049 | 596,157 |
| Mode M0 | |||
|---|---|---|---|
| Quadrant | BADHDUFLAG | Total packets | Discarded packets |
| A | 0 | 15314 | 2 |
| B | 0 | 15777 | 1 |
| C | 0 | 14699 | 1 |
| D | 0 | 15787 | 1 |
| Mode M9 | |||
|---|---|---|---|
| Quadrant | BADHDUFLAG | Total packets | Discarded packets |
| A | 0 | 2 | 0 |
| B | 0 | 2 | 0 |
| C | 0 | 2 | 0 |
| D | 0 | 2 | 0 |
| Mode SS | |||
|---|---|---|---|
| Quadrant | BADHDUFLAG | Total packets | Discarded packets |
| A | 0 | 142 | 0 |
| B | 0 | 142 | 0 |
| C | 0 | 142 | 0 |
| D | 0 | 142 | 0 |
| Quadrant | Total seconds | Saturated seconds | Saturation percentage |
|---|---|---|---|
| A | 7030 | 159 | 2.261735% |
| B | 7030 | 248 | 3.527738% |
| C | 7030 | 97 | 1.379801% |
| D | 7030 | 148 | 2.105263% |
Noise dominated data is calculated using 1-second bins in cleaned event files. If a bin has >2000 counts, and if more than 50% of those come from <1% of pixels, then it is considered to be noise-dominated and hence unusable.
| Quadrant | # 1 sec bins | Bins with >0 counts | Bins with >2000 counts | High rate bins dominated by noise | Noise dominated (total time) | Noise dominated (detector-on time) | Marked lightcurve |
|---|---|---|---|---|---|---|---|
| A | 7222 | 7033 | 2 | 2 | 0.03% | 0.03% | 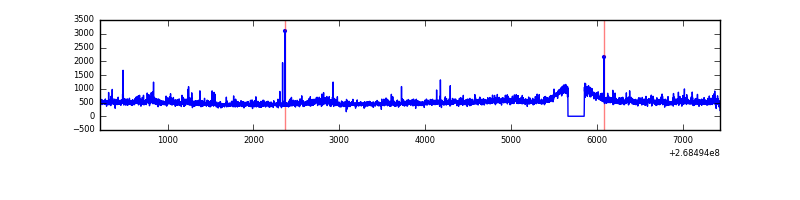 |
| B | 7222 | 7033 | 54 | 54 | 0.75% | 0.77% | 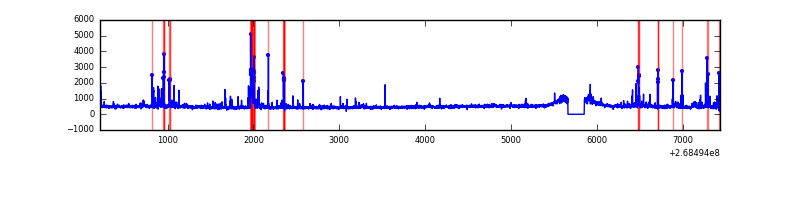 |
| C | 7222 | 7033 | 0 | 0 | 0.00% | 0.00% | 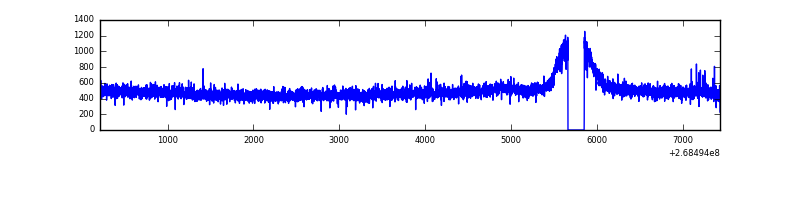 |
| D | 7222 | 7033 | 44 | 44 | 0.61% | 0.63% | 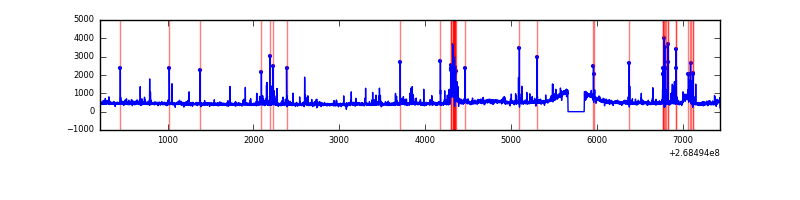 |
Top three noisy pixels from each quadrant. If the there are fewer than three noisy pixels in the level2.evt file, extra rows are filled as -1
| Pixel properties | Quadrant properties | ||||||
|---|---|---|---|---|---|---|---|
| Quadrant | DetID | PixID | Counts | Sigma | Mean | Median | Sigma |
| A | 12 | 189 | 121418 | 684.29 | 857 | 835 | 176.2 |
| A | 1 | 162 | 103750 | 584.03 | 857 | 835 | 176.2 |
| A | 1 | 178 | 47633 | 265.57 | 857 | 835 | 176.2 |
| B | 3 | 64 | 231264 | 1410.33 | 850 | 826 | 163.4 |
| B | 0 | 228 | 46211 | 277.77 | 850 | 826 | 163.4 |
| B | 7 | 220 | 38990 | 233.57 | 850 | 826 | 163.4 |
| C | 3 | 233 | 170567 | 867.65 | 833 | 838 | 195.6 |
| C | 7 | 247 | 38147 | 190.72 | 833 | 838 | 195.6 |
| C | 14 | 234 | 8224 | 37.76 | 833 | 838 | 195.6 |
| D | 9 | 1 | 141866 | 685.0 | 835 | 812 | 205.9 |
| D | 7 | 38 | 110808 | 534.17 | 835 | 812 | 205.9 |
| D | 15 | 0 | 69474 | 333.44 | 835 | 812 | 205.9 |
Histogram calculated using DETX and DETY for each event in the final _common_clean file
| Quadrant A |  |
 |
Quadrant B |
|---|---|---|---|
| Quadrant D |  |
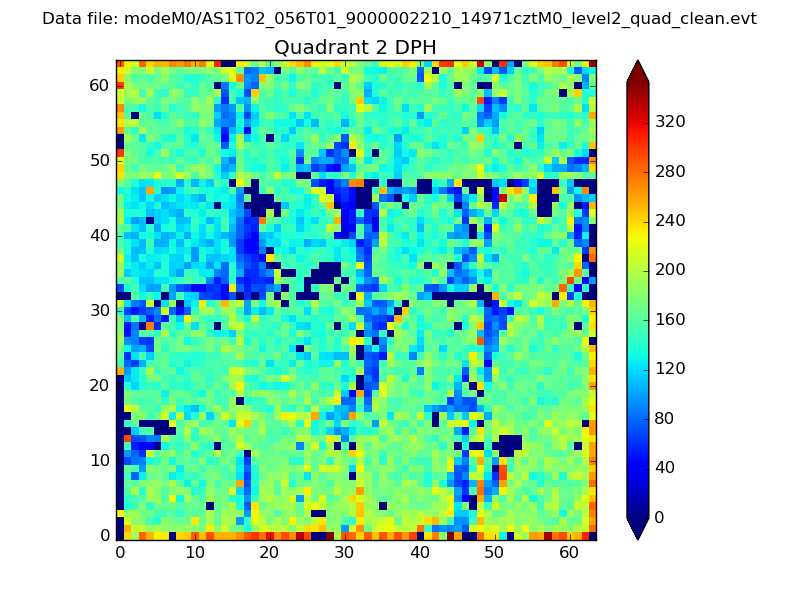 |
Quadrant C |
| Plot type | Count rate plots | Images |
|---|---|---|
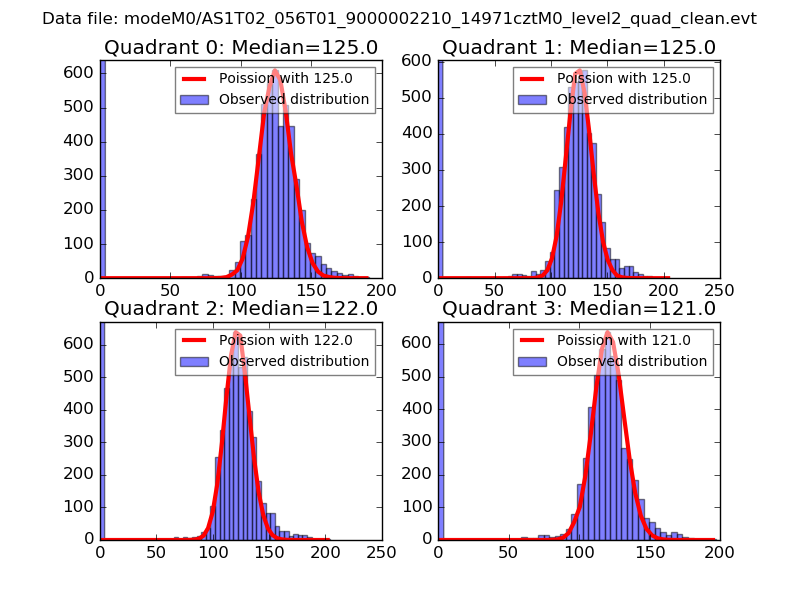
| Comparison with Poisson distribution Blue bars denote a histogram of data divided into 1 sec bins. Red curve is a Poisson curve with rate = median count rate of data. |
 |
 |
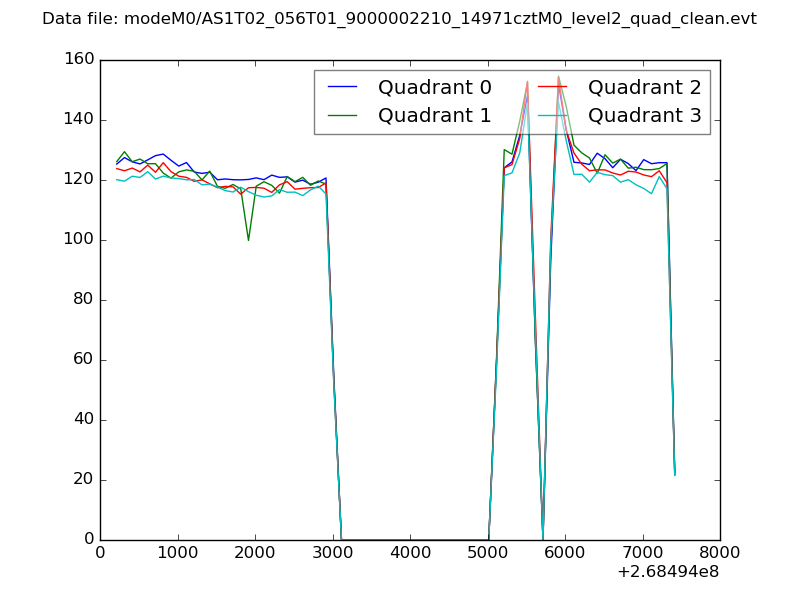
| Quadrant-wise count rates Data is divided into 100 sec bins |
 |
|
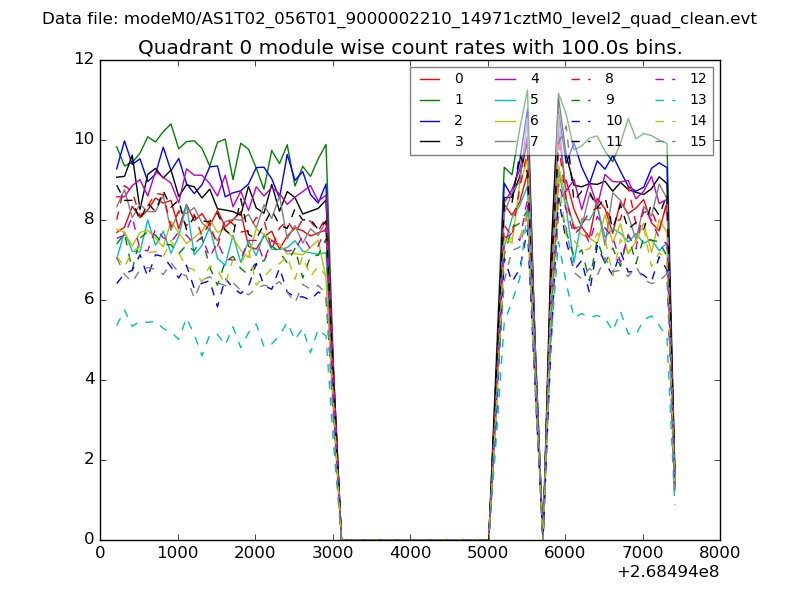
| Module-wise count rates for Quadrant A Data is divided into 100 sec bins |
 |
 |
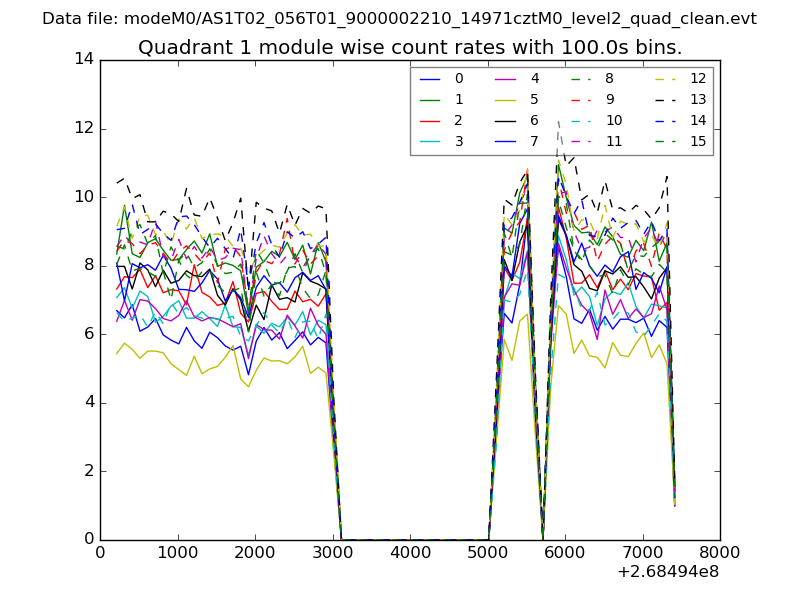
| Module-wise count rates for Quadrant B Data is divided into 100 sec bins |
 |
 |
| Module-wise count rates for Quadrant C Data is divided into 100 sec bins |
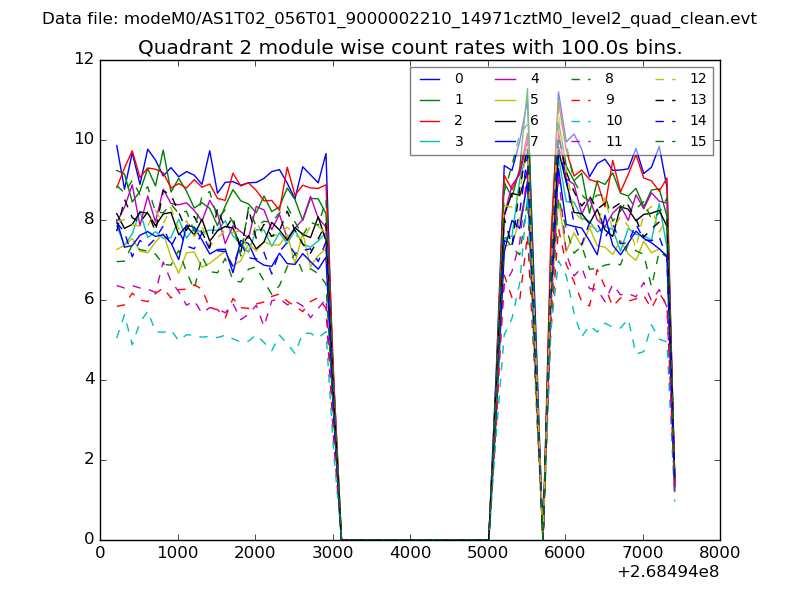 |
 |
| Module-wise count rates for Quadrant D Data is divided into 100 sec bins |
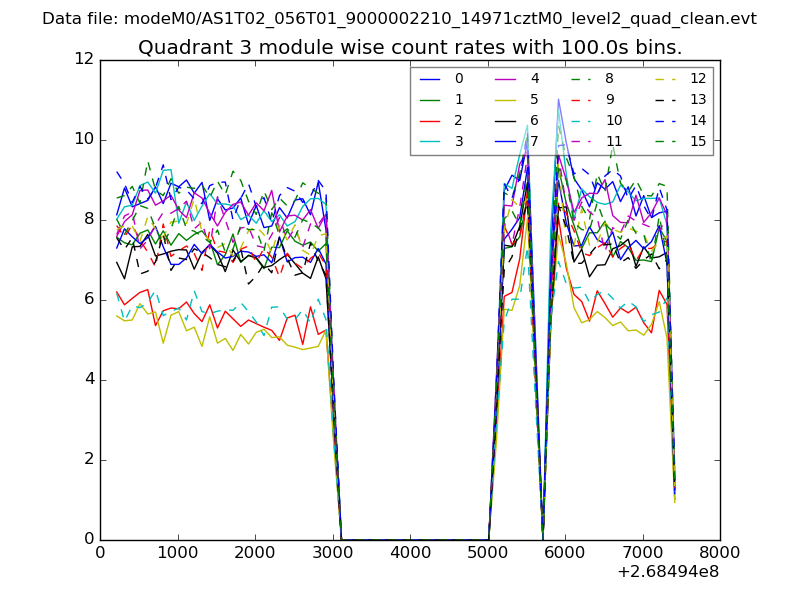 |
 |
| Parameter | Plot |
|---|---|
| CZT HV Monitor | 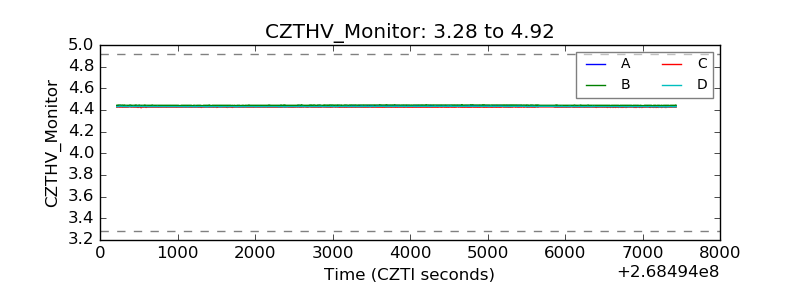 |
| D_VDD | 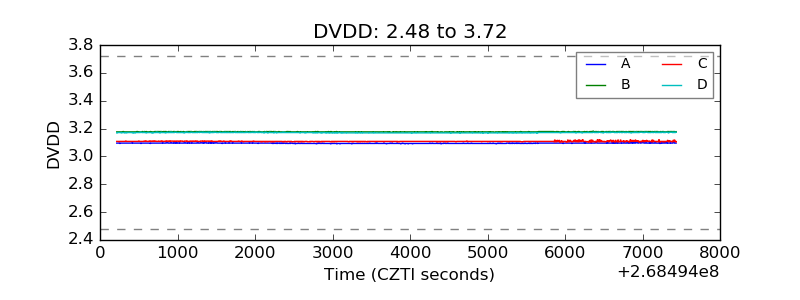 |
| Temperature 1 | 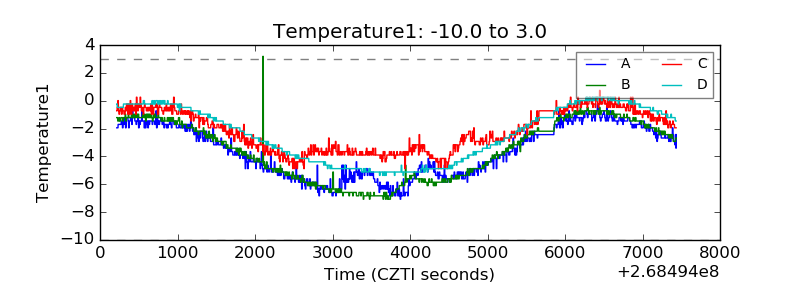 |
| Veto HV Monitor | 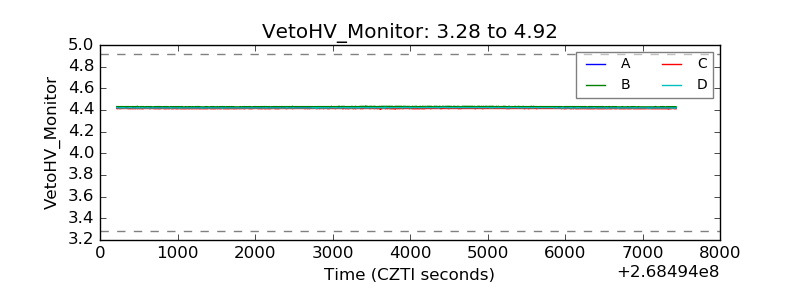 |
| Veto LLD | 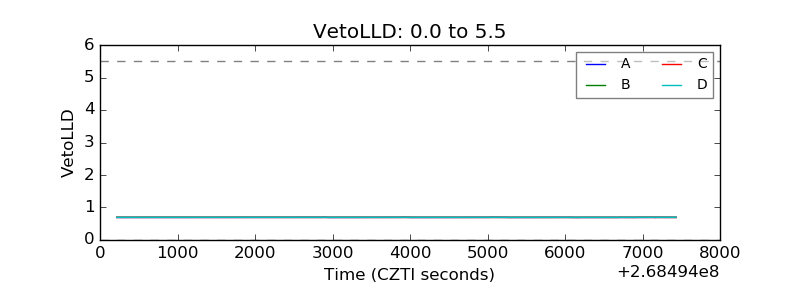 |
| Alpha Counter | 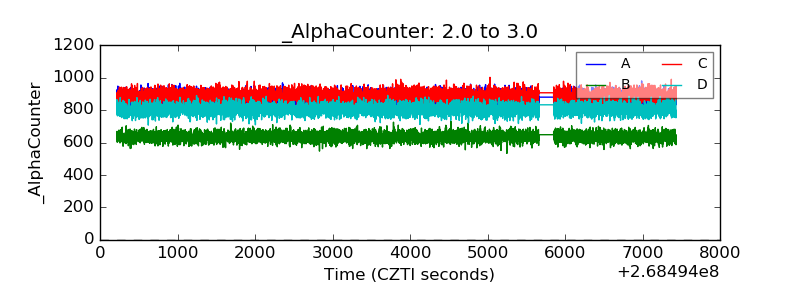 |
| _CPM_Rate | 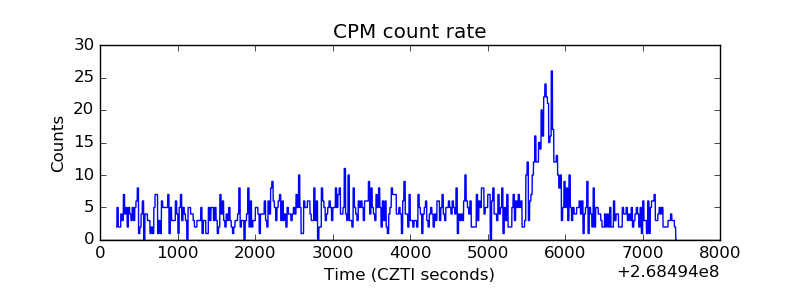 |
| CZT Counter | 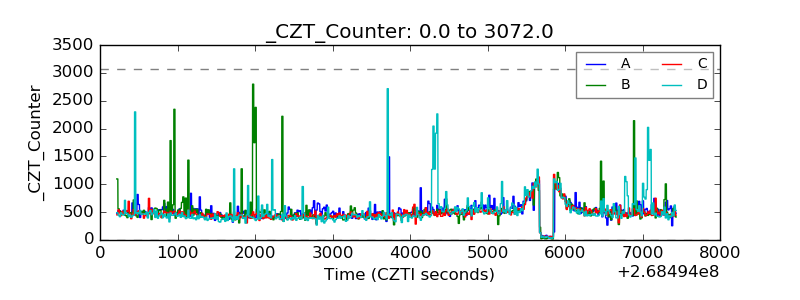 |
| +2.5 Volts monitor |  |
| +5 Volts monitor | 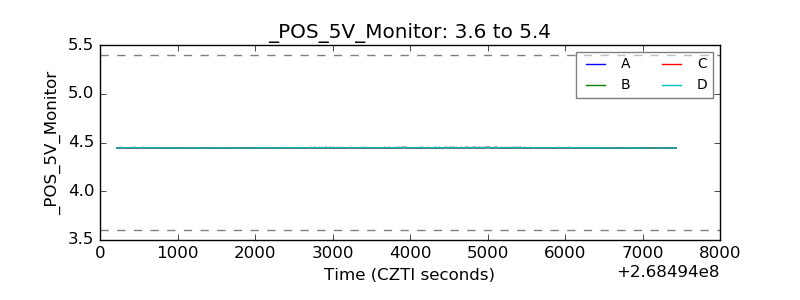 |
| _ROLL_ROT | 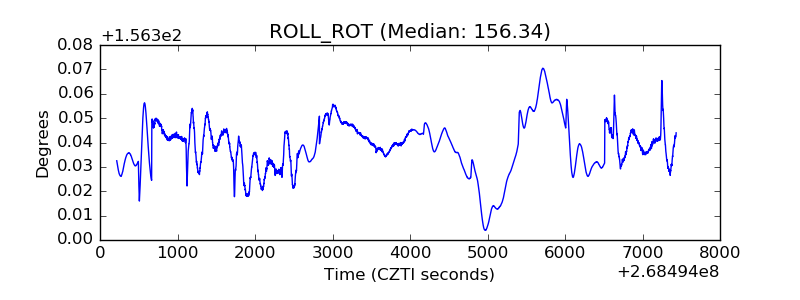 |
| _Roll_DEC | 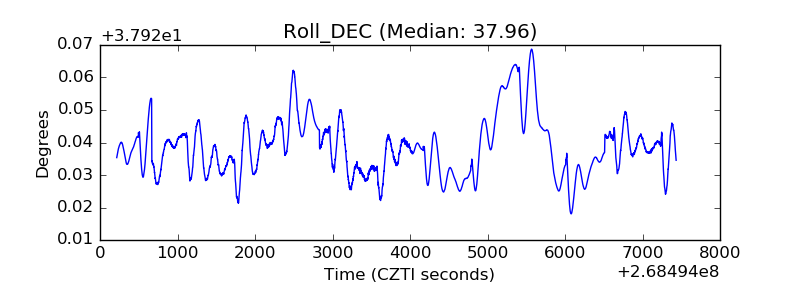 |
| _Roll_RA | 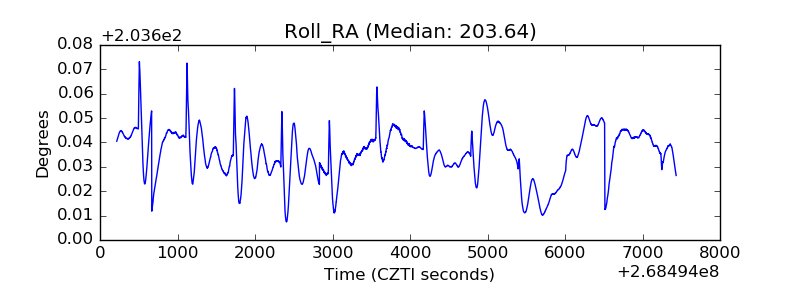 |
| Veto Counter | 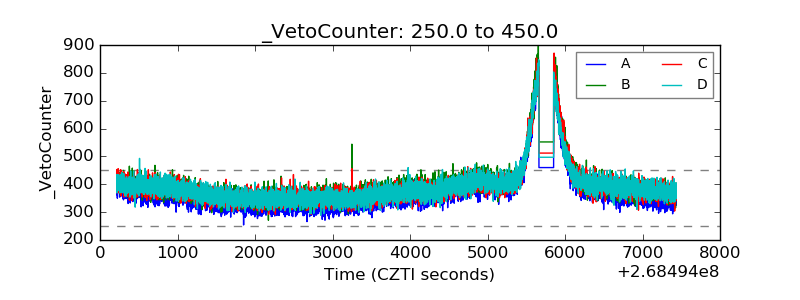 |