| Param | Original file | Final file |
|---|---|---|
| Filename | modeM0/AS1T02_056T01_9000002210_14972cztM0_level2.evt | modeM0/AS1T02_056T01_9000002210_14972cztM0_level2_quad_clean.evt |
| Size (bytes) | 535,697,280 | 105,197,760 |
| Size | 510.9 MB | 100.3 MB |
| Events in quadrant A | 4,007,171 | 676,133 |
| Events in quadrant B | 3,994,615 | 677,249 |
| Events in quadrant C | 3,666,201 | 665,691 |
| Events in quadrant D | 4,045,738 | 643,928 |
| Mode M0 | |||
|---|---|---|---|
| Quadrant | BADHDUFLAG | Total packets | Discarded packets |
| A | 0 | 16668 | 2 |
| B | 0 | 16815 | 1 |
| C | 0 | 15620 | 1 |
| D | 0 | 17233 | 1 |
| Mode M9 | |||
|---|---|---|---|
| Quadrant | BADHDUFLAG | Total packets | Discarded packets |
| A | 0 | 4 | 0 |
| B | 0 | 4 | 0 |
| C | 0 | 4 | 0 |
| D | 0 | 4 | 0 |
| Mode SS | |||
|---|---|---|---|
| Quadrant | BADHDUFLAG | Total packets | Discarded packets |
| A | 0 | 152 | 0 |
| B | 0 | 152 | 0 |
| C | 0 | 152 | 0 |
| D | 0 | 152 | 0 |
| Quadrant | Total seconds | Saturated seconds | Saturation percentage |
|---|---|---|---|
| A | 7514 | 73 | 0.971520% |
| B | 7514 | 138 | 1.836572% |
| C | 7514 | 27 | 0.359329% |
| D | 7514 | 165 | 2.195901% |
Noise dominated data is calculated using 1-second bins in cleaned event files. If a bin has >2000 counts, and if more than 50% of those come from <1% of pixels, then it is considered to be noise-dominated and hence unusable.
| Quadrant | # 1 sec bins | Bins with >0 counts | Bins with >2000 counts | High rate bins dominated by noise | Noise dominated (total time) | Noise dominated (detector-on time) | Marked lightcurve |
|---|---|---|---|---|---|---|---|
| A | 7935 | 7516 | 3 | 3 | 0.04% | 0.04% | 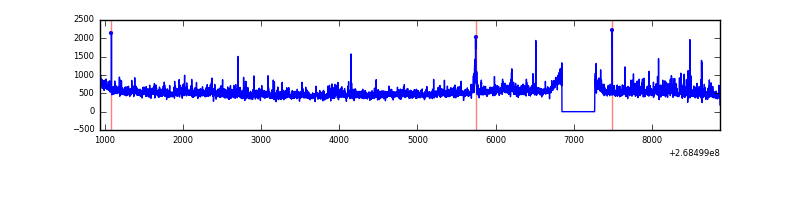 |
| B | 7935 | 7516 | 42 | 42 | 0.53% | 0.56% | 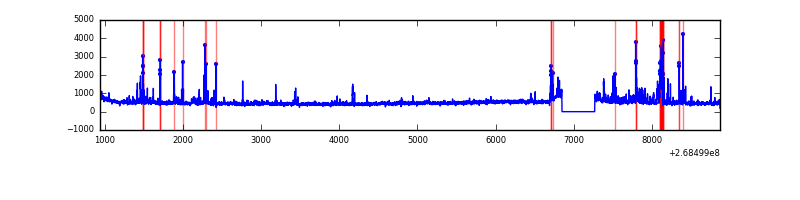 |
| C | 7935 | 7516 | 0 | 0 | 0.00% | 0.00% | 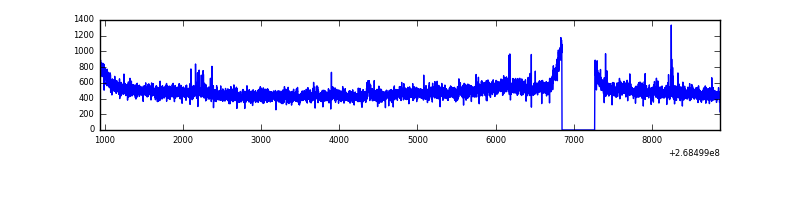 |
| D | 7935 | 7516 | 128 | 128 | 1.61% | 1.70% | 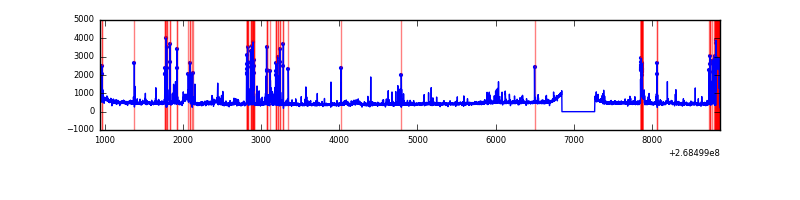 |
Top three noisy pixels from each quadrant. If the there are fewer than three noisy pixels in the level2.evt file, extra rows are filled as -1
| Pixel properties | Quadrant properties | ||||||
|---|---|---|---|---|---|---|---|
| Quadrant | DetID | PixID | Counts | Sigma | Mean | Median | Sigma |
| A | 1 | 162 | 160634 | 862.59 | 900 | 879 | 185.2 |
| A | 12 | 189 | 111776 | 598.78 | 900 | 879 | 185.2 |
| A | 1 | 178 | 78192 | 417.45 | 900 | 879 | 185.2 |
| B | 3 | 64 | 193447 | 1130.41 | 894 | 869 | 170.4 |
| B | 7 | 220 | 94944 | 552.21 | 894 | 869 | 170.4 |
| B | 0 | 229 | 34790 | 199.11 | 894 | 869 | 170.4 |
| C | 3 | 233 | 206395 | 1013.23 | 871 | 874 | 202.8 |
| C | 7 | 247 | 30887 | 147.97 | 871 | 874 | 202.8 |
| C | 14 | 234 | 14527 | 67.31 | 871 | 874 | 202.8 |
| D | 15 | 0 | 296841 | 1296.59 | 864 | 844 | 228.3 |
| D | 7 | 38 | 265809 | 1160.66 | 864 | 844 | 228.3 |
| D | 1 | 3 | 47112 | 202.67 | 864 | 844 | 228.3 |
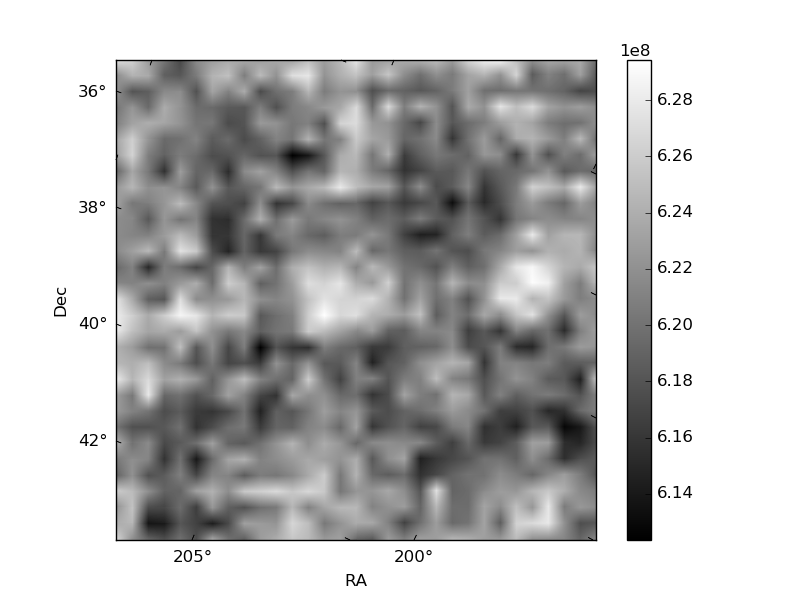
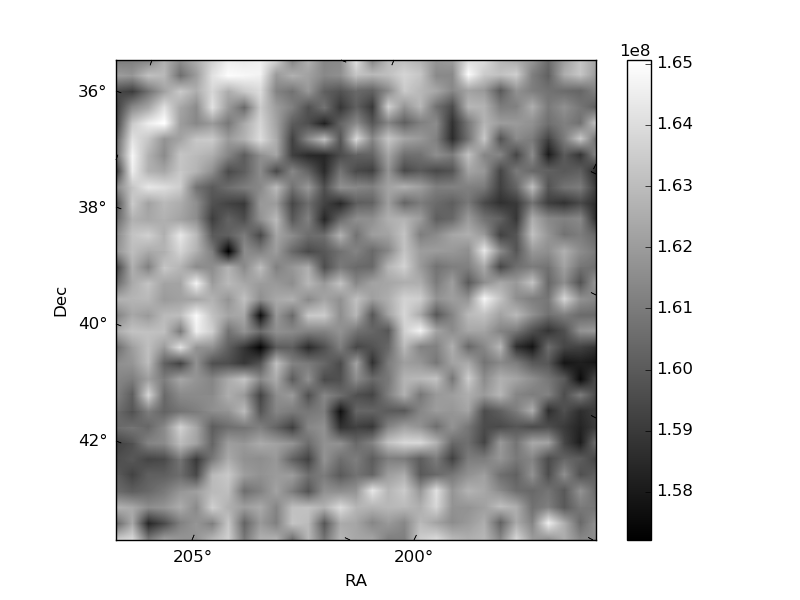
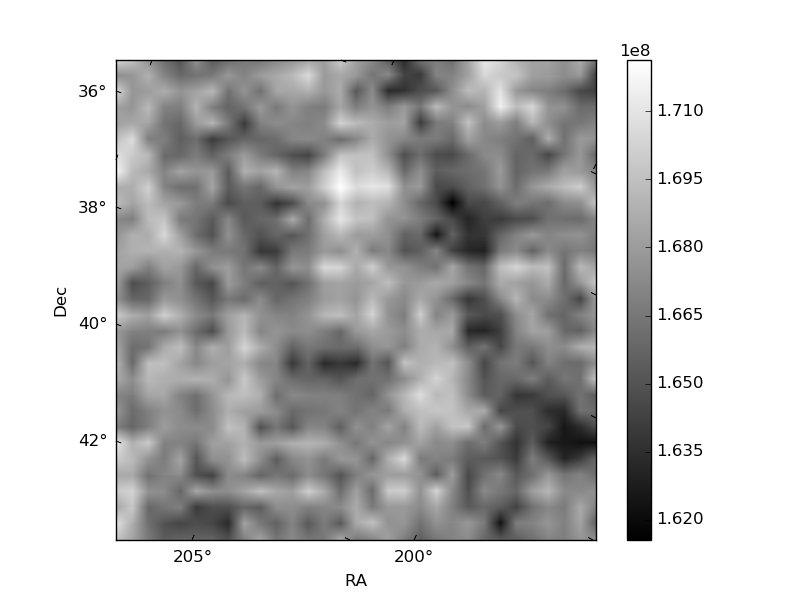
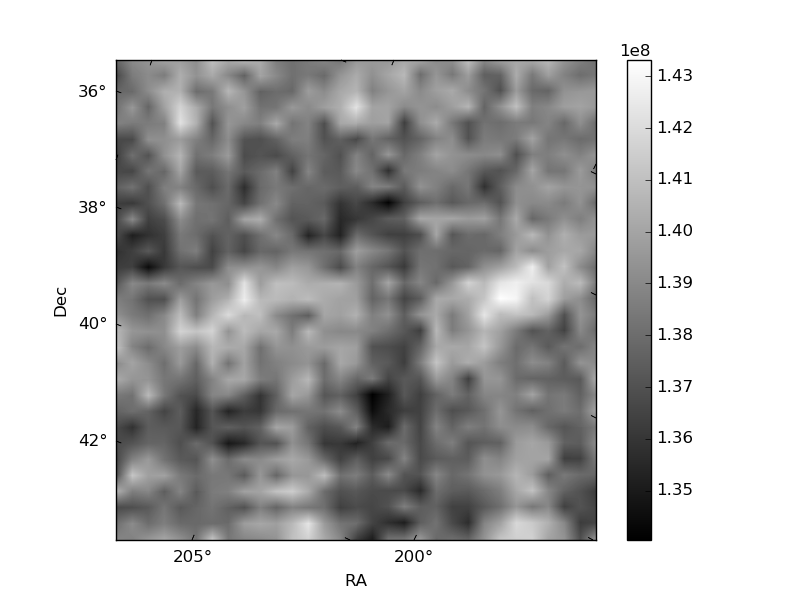
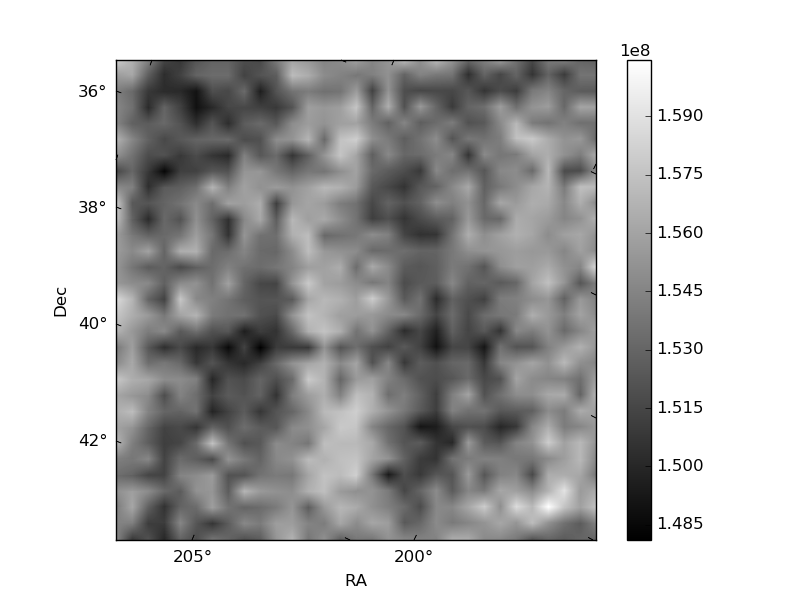
Histogram calculated using DETX and DETY for each event in the final _common_clean file
| Quadrant A | 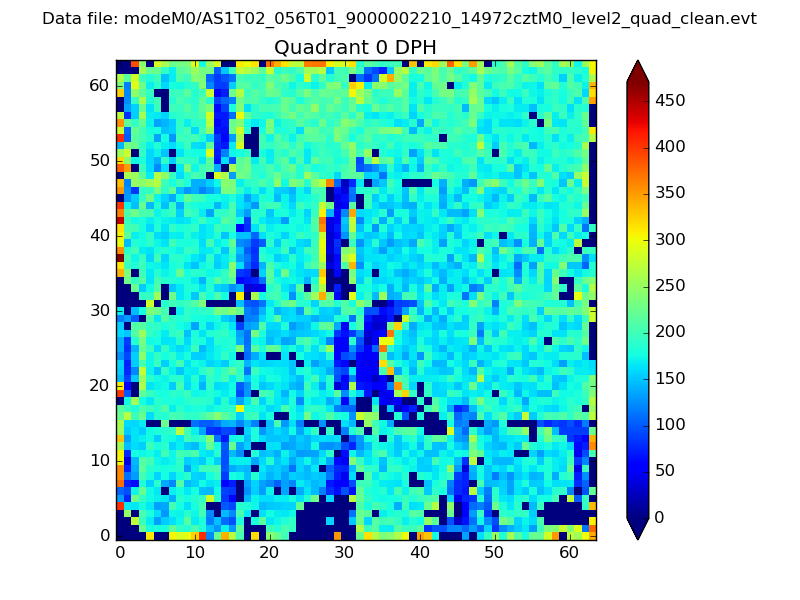 |
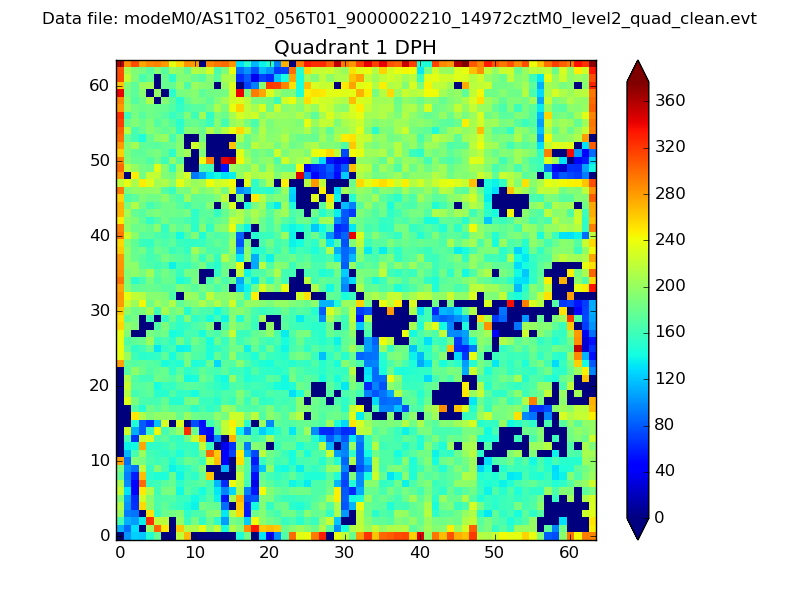 |
Quadrant B |
|---|---|---|---|
| Quadrant D | 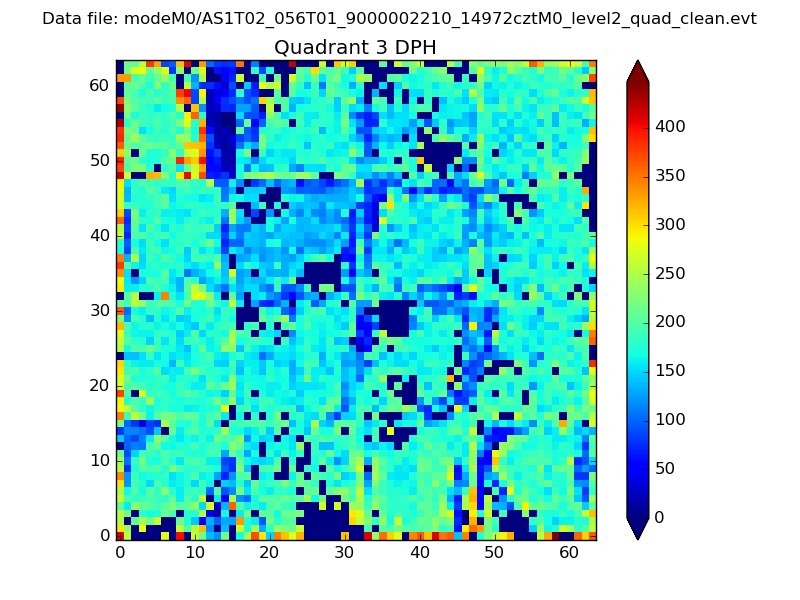 |
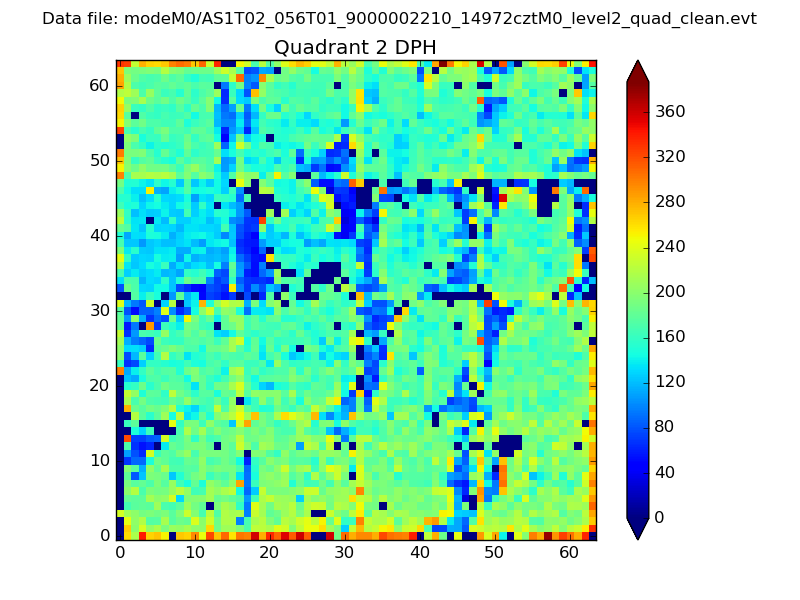 |
Quadrant C |
| Plot type | Count rate plots | Images |
|---|---|---|
| Comparison with Poisson distribution Blue bars denote a histogram of data divided into 1 sec bins. Red curve is a Poisson curve with rate = median count rate of data. |
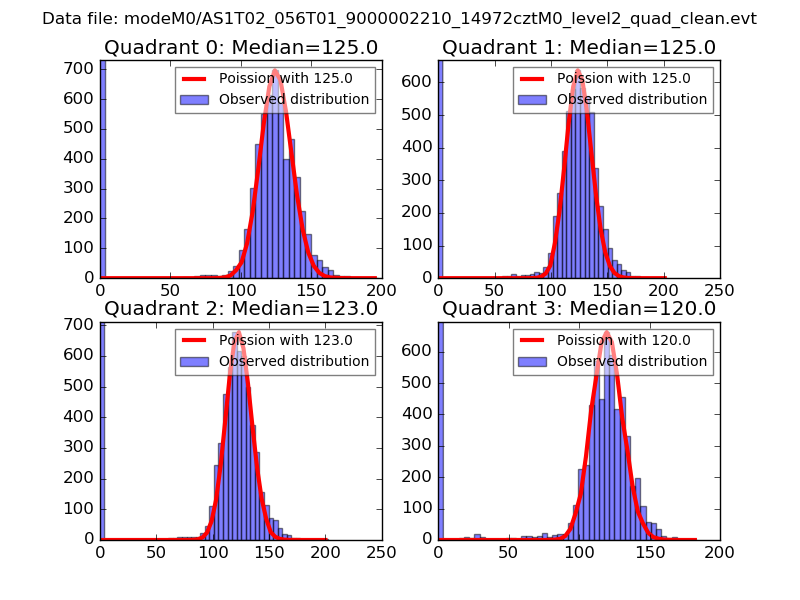 |
 |
| Quadrant-wise count rates Data is divided into 100 sec bins |
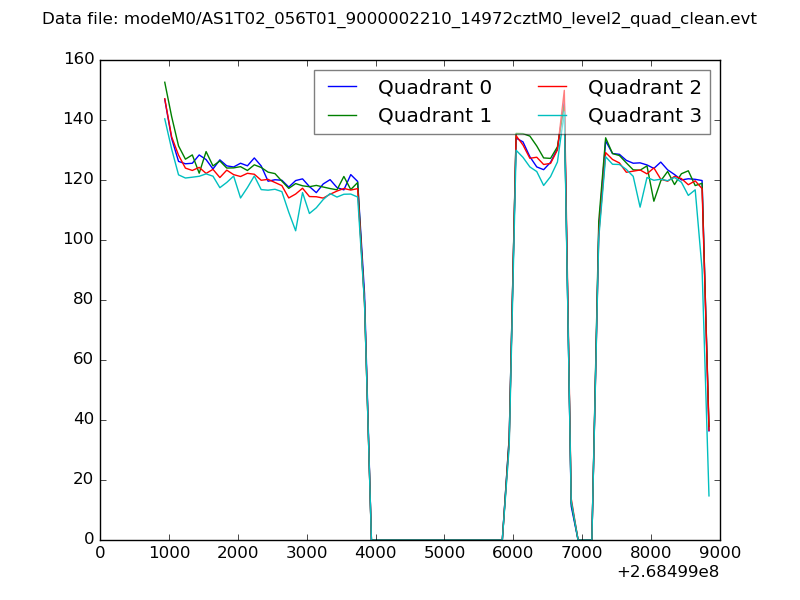 |
|
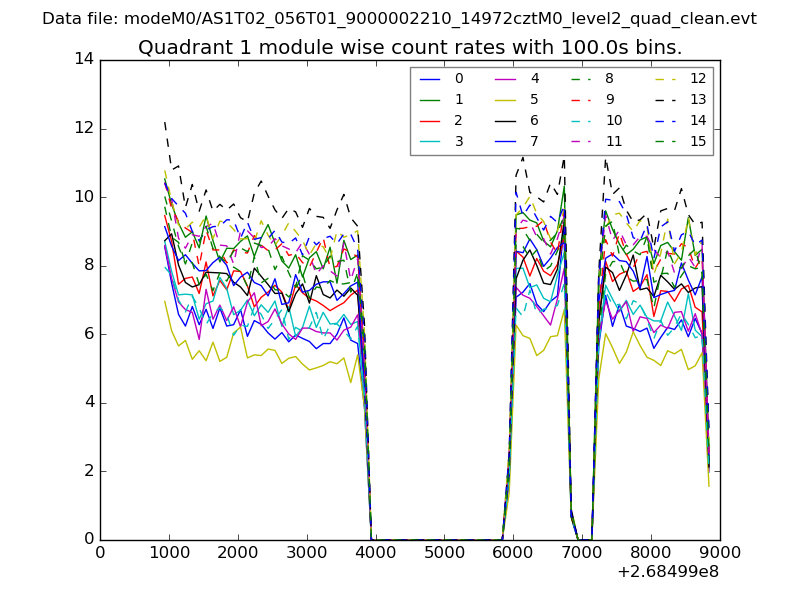
| Module-wise count rates for Quadrant A Data is divided into 100 sec bins |
 |
 |
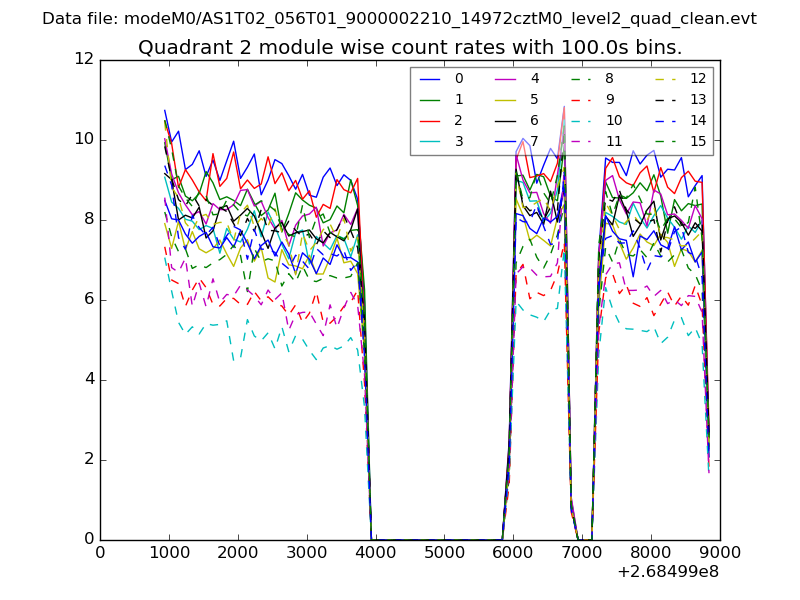
| Module-wise count rates for Quadrant B Data is divided into 100 sec bins |
 |
 |
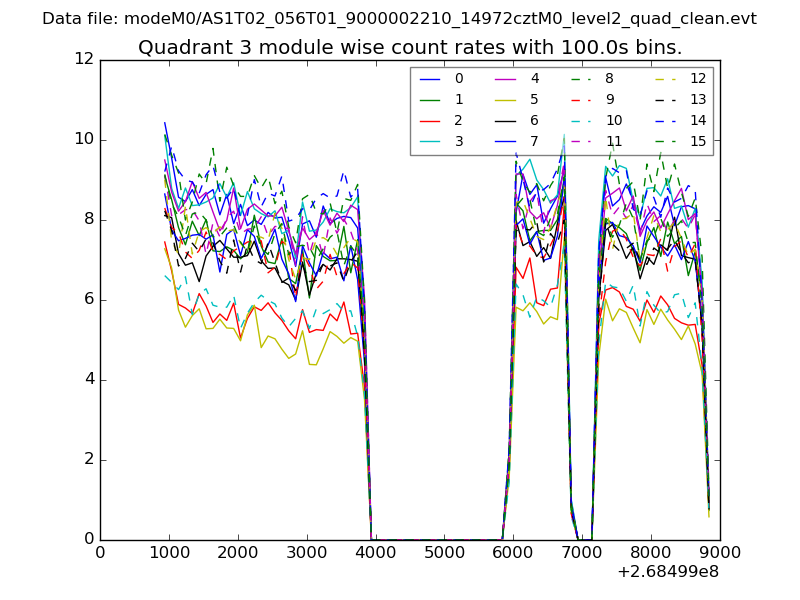
| Module-wise count rates for Quadrant C Data is divided into 100 sec bins |
 |
 |
| Module-wise count rates for Quadrant D Data is divided into 100 sec bins |
 |
 |
| Parameter | Plot |
|---|---|
| CZT HV Monitor | 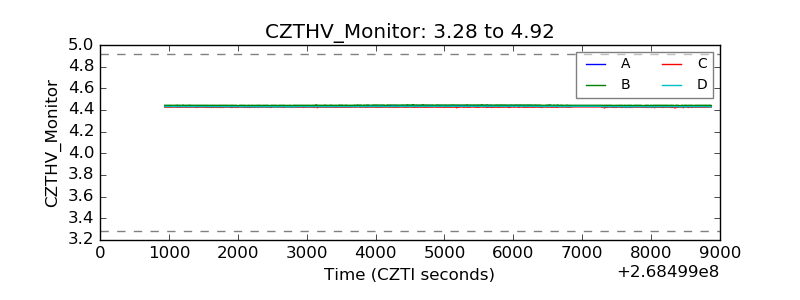 |
| D_VDD |  |
| Temperature 1 | 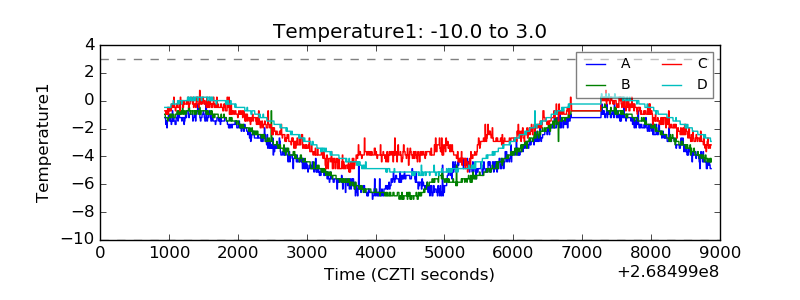 |
| Veto HV Monitor | 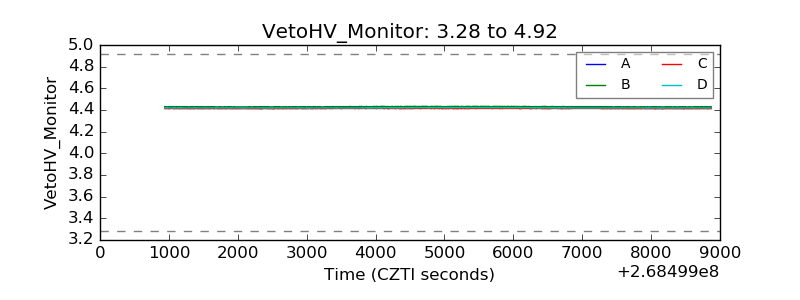 |
| Veto LLD |  |
| Alpha Counter | 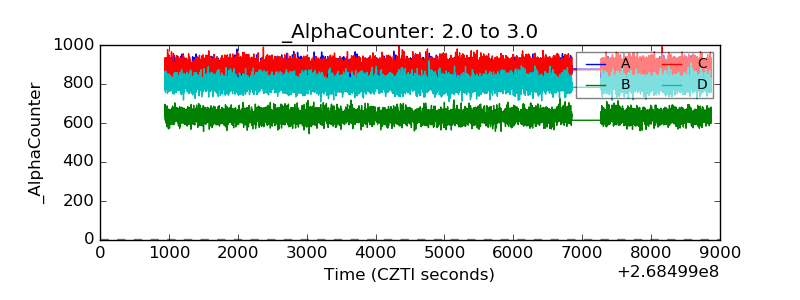 |
| _CPM_Rate | 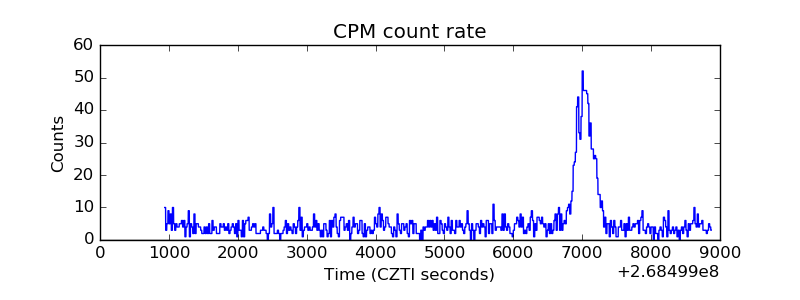 |
| CZT Counter | 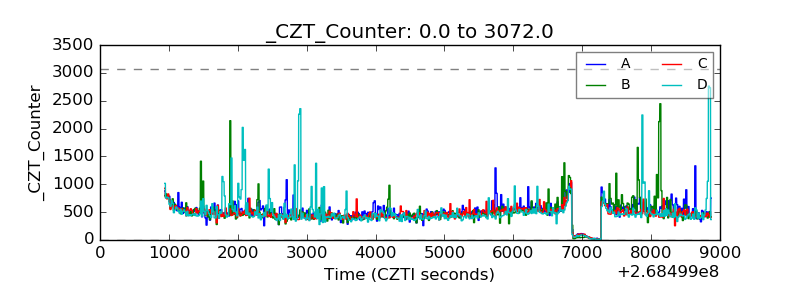 |
| +2.5 Volts monitor |  |
| +5 Volts monitor |  |
| _ROLL_ROT |  |
| _Roll_DEC | 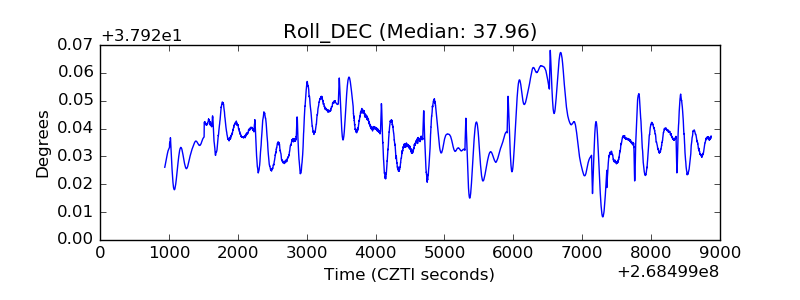 |
| _Roll_RA | 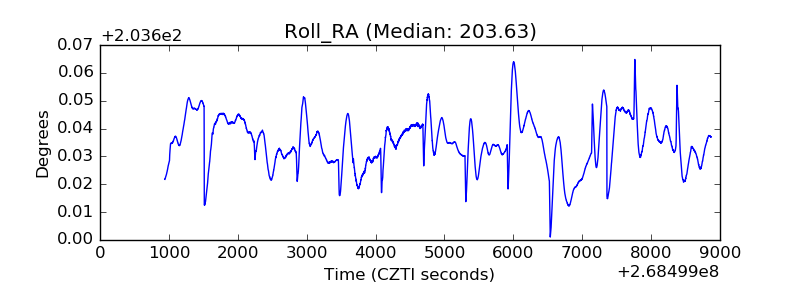 |
| Veto Counter | 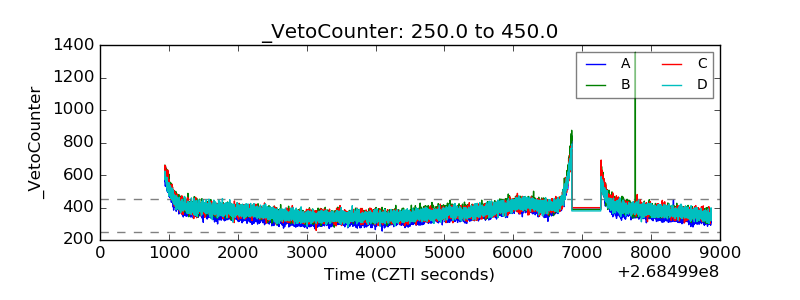 |