| Param | Original file | Final file |
|---|---|---|
| Filename | modeM0/AS1T02_056T01_9000002210_14974cztM0_level2.evt | modeM0/AS1T02_056T01_9000002210_14974cztM0_level2_quad_clean.evt |
| Size (bytes) | 776,033,280 | 135,452,160 |
| Size | 740.1 MB | 129.2 MB |
| Events in quadrant A | 5,649,874 | 851,624 |
| Events in quadrant B | 6,388,869 | 841,712 |
| Events in quadrant C | 5,155,450 | 838,134 |
| Events in quadrant D | 5,563,499 | 809,616 |
| Mode M0 | |||
|---|---|---|---|
| Quadrant | BADHDUFLAG | Total packets | Discarded packets |
| A | 0 | 24064 | 1 |
| B | 0 | 26263 | 1 |
| C | 0 | 22510 | 1 |
| D | 0 | 24397 | 1 |
| Mode M9 | |||
|---|---|---|---|
| Quadrant | BADHDUFLAG | Total packets | Discarded packets |
| A | 0 | 10 | 0 |
| B | 0 | 9 | 0 |
| C | 0 | 9 | 0 |
| D | 0 | 9 | 0 |
| Mode SS | |||
|---|---|---|---|
| Quadrant | BADHDUFLAG | Total packets | Discarded packets |
| A | 0 | 224 | 0 |
| B | 0 | 224 | 0 |
| C | 0 | 224 | 0 |
| D | 0 | 224 | 0 |
| Quadrant | Total seconds | Saturated seconds | Saturation percentage |
|---|---|---|---|
| A | 10994 | 65 | 0.591232% |
| B | 10994 | 290 | 2.637802% |
| C | 10994 | 23 | 0.209205% |
| D | 10994 | 188 | 1.710024% |
Noise dominated data is calculated using 1-second bins in cleaned event files. If a bin has >2000 counts, and if more than 50% of those come from <1% of pixels, then it is considered to be noise-dominated and hence unusable.
| Quadrant | # 1 sec bins | Bins with >0 counts | Bins with >2000 counts | High rate bins dominated by noise | Noise dominated (total time) | Noise dominated (detector-on time) | Marked lightcurve |
|---|---|---|---|---|---|---|---|
| A | 11565 | 10996 | 1 | 1 | 0.01% | 0.01% | 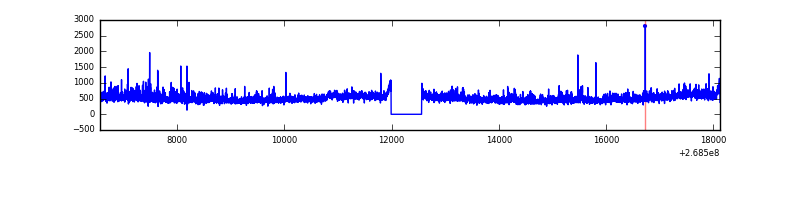 |
| B | 11565 | 10996 | 150 | 150 | 1.30% | 1.36% | 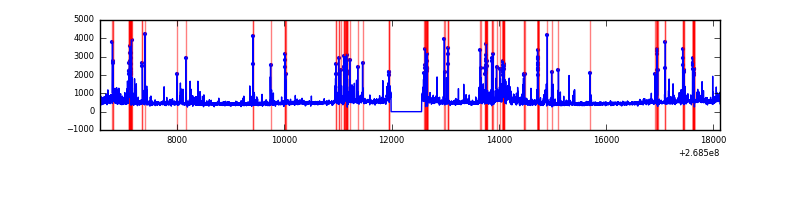 |
| C | 11565 | 10996 | 2 | 2 | 0.02% | 0.02% | 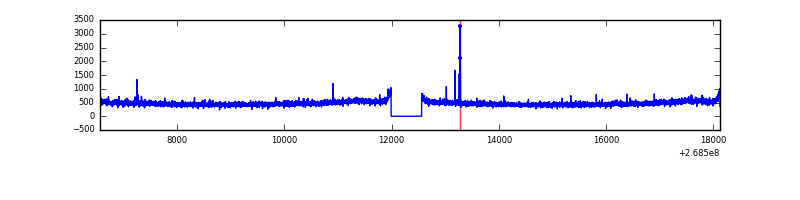 |
| D | 11565 | 10996 | 173 | 173 | 1.50% | 1.57% | 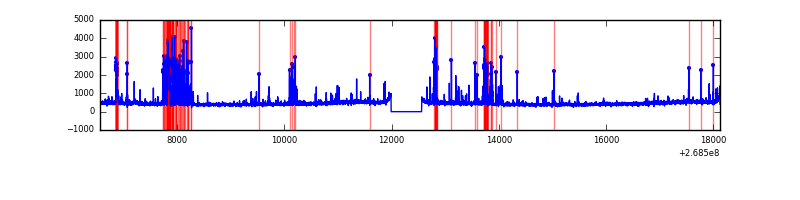 |
Top three noisy pixels from each quadrant. If the there are fewer than three noisy pixels in the level2.evt file, extra rows are filled as -1
| Pixel properties | Quadrant properties | ||||||
|---|---|---|---|---|---|---|---|
| Quadrant | DetID | PixID | Counts | Sigma | Mean | Median | Sigma |
| A | 1 | 162 | 213549 | 807.97 | 1288 | 1258 | 262.7 |
| A | 12 | 189 | 166276 | 628.05 | 1288 | 1258 | 262.7 |
| A | 1 | 178 | 104660 | 393.54 | 1288 | 1258 | 262.7 |
| B | 3 | 64 | 542017 | 2234.15 | 1273 | 1241 | 242.1 |
| B | 0 | 219 | 259538 | 1067.12 | 1273 | 1241 | 242.1 |
| B | 4 | 173 | 161164 | 660.7 | 1273 | 1241 | 242.1 |
| C | 3 | 233 | 260200 | 897.52 | 1246 | 1250 | 288.5 |
| C | 14 | 234 | 25625 | 84.48 | 1246 | 1250 | 288.5 |
| C | 13 | 61 | 8871 | 26.41 | 1246 | 1250 | 288.5 |
| D | 15 | 0 | 372306 | 1120.74 | 1234 | 1207 | 331.1 |
| D | 7 | 38 | 266686 | 801.76 | 1234 | 1207 | 331.1 |
| D | 13 | 249 | 103636 | 309.34 | 1234 | 1207 | 331.1 |
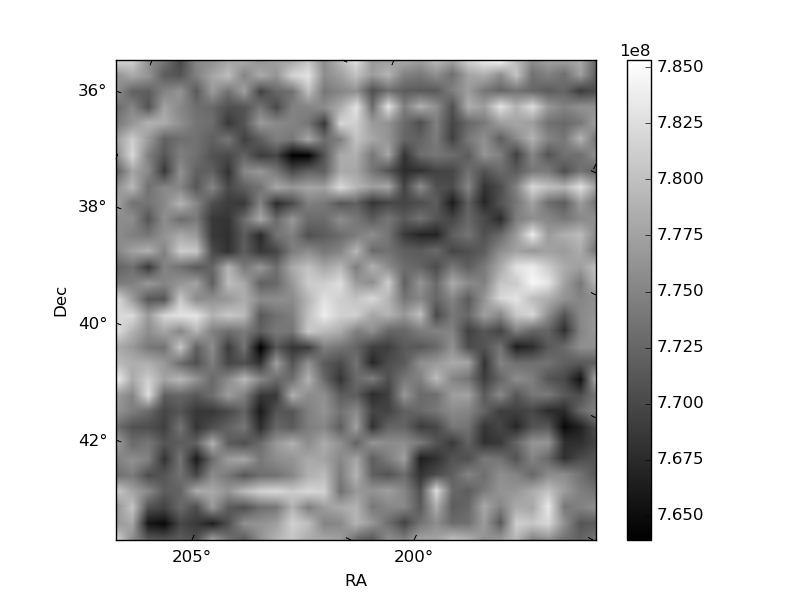
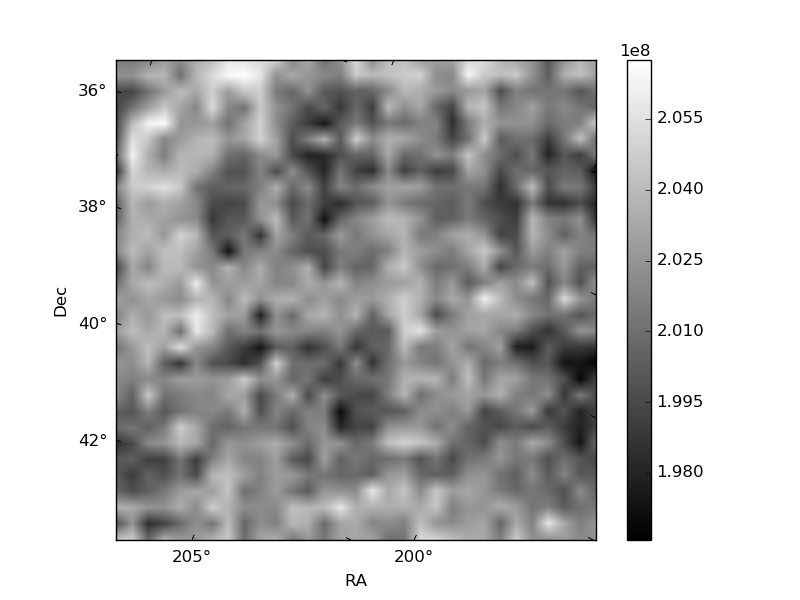
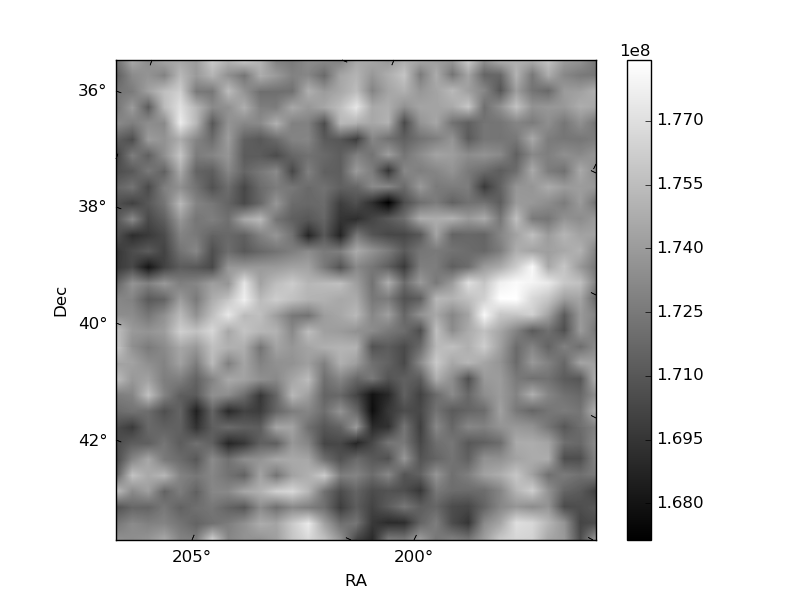
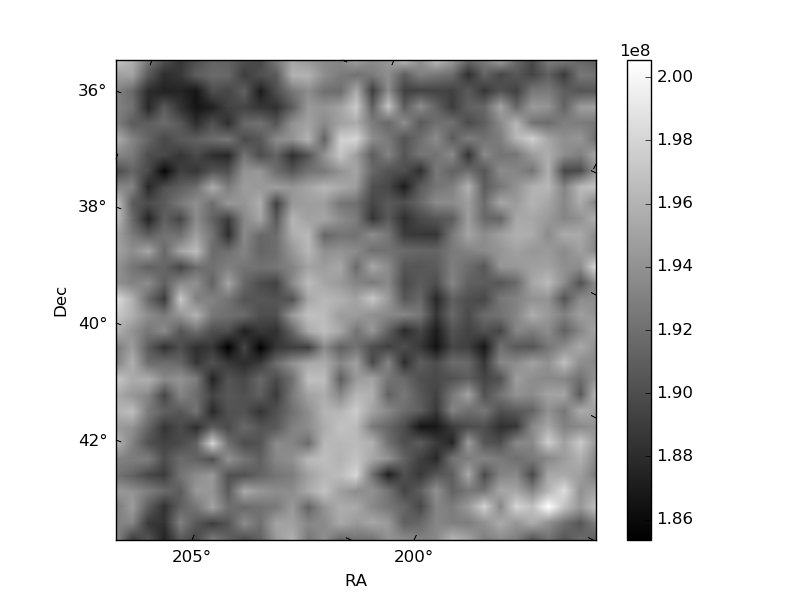
Histogram calculated using DETX and DETY for each event in the final _common_clean file
| Quadrant A | 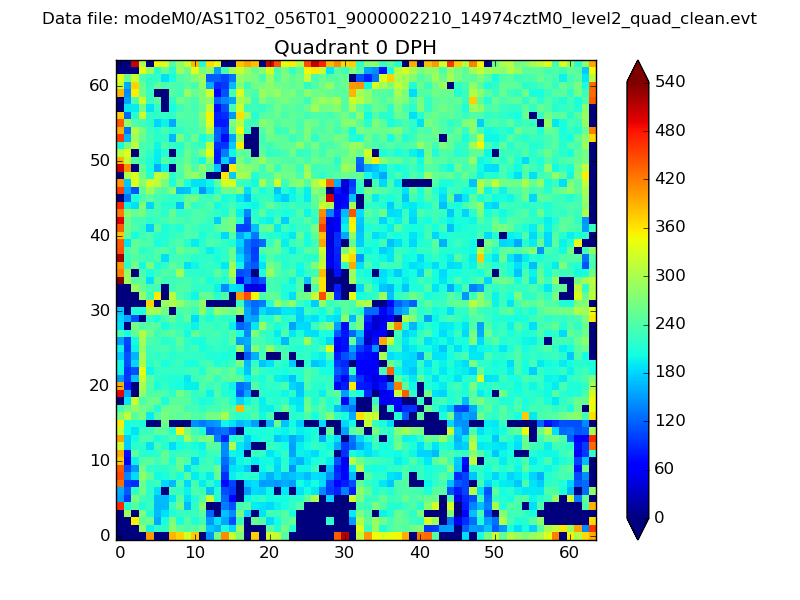 |
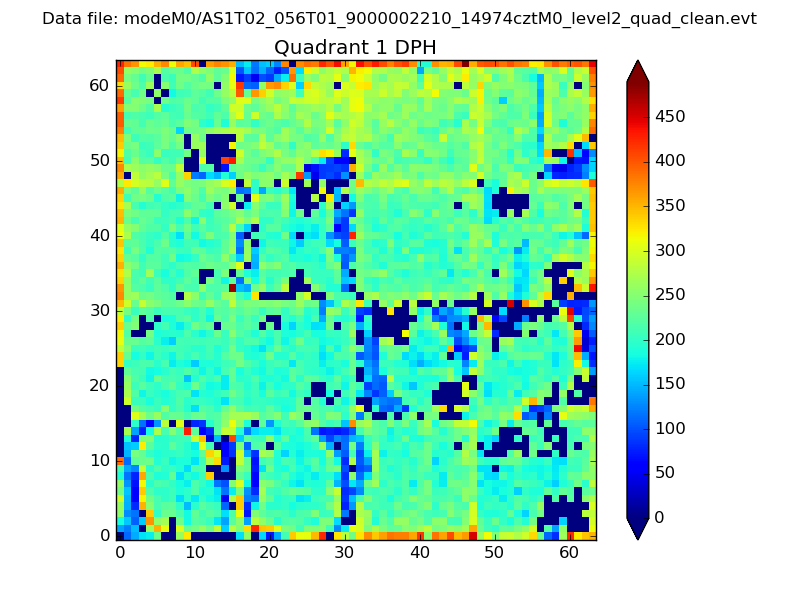 |
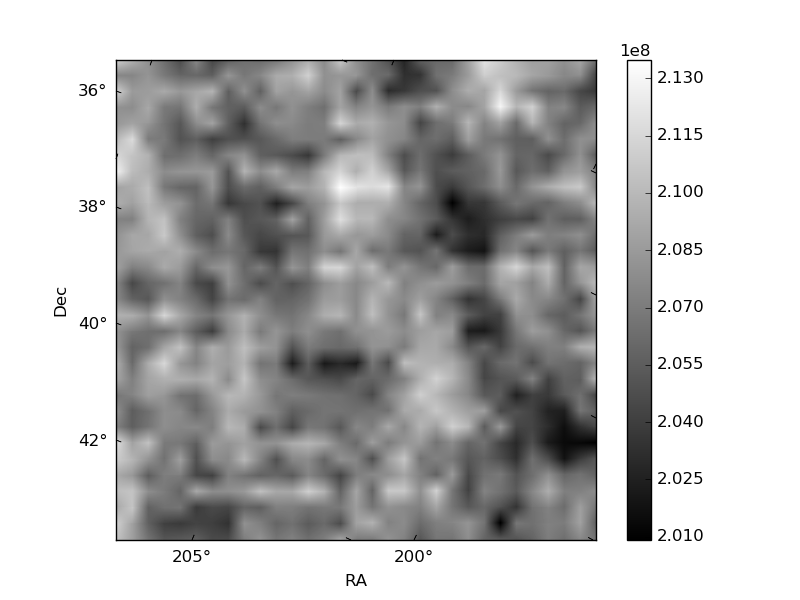
Quadrant B |
|---|---|---|---|
| Quadrant D | 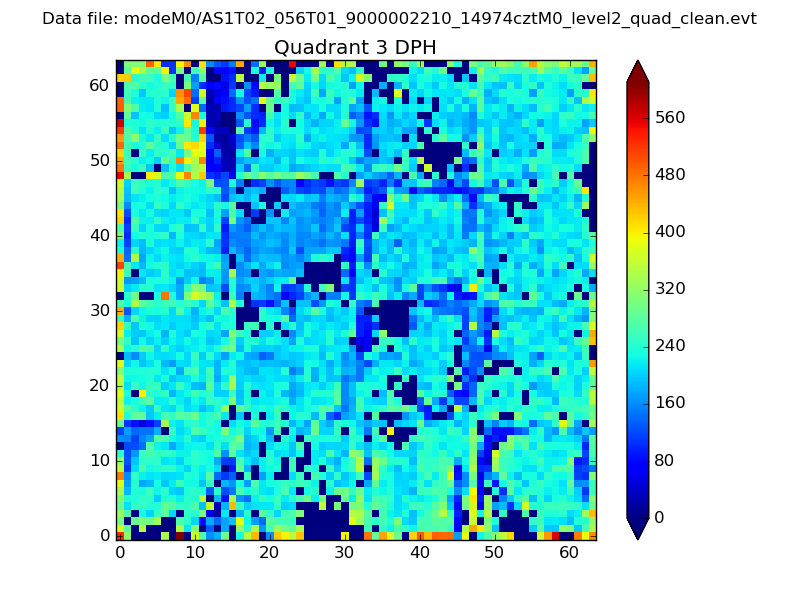 |
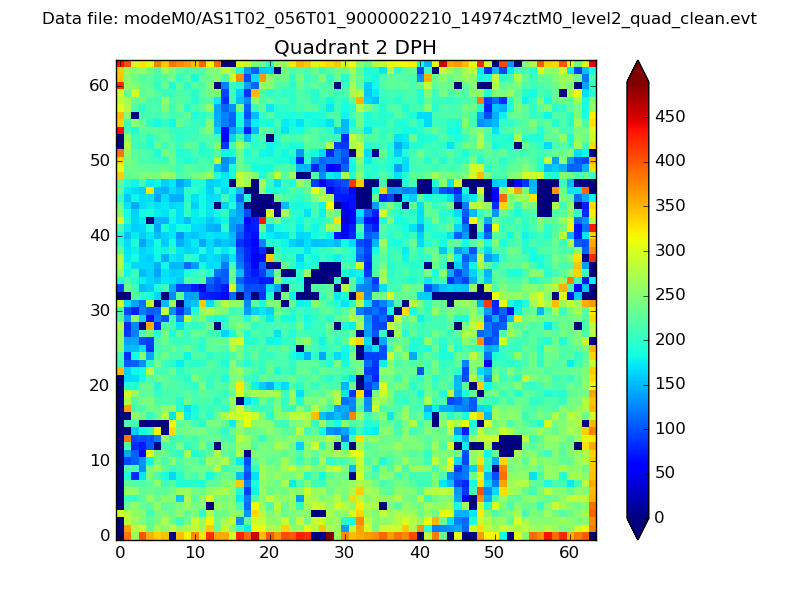 |
Quadrant C |
| Plot type | Count rate plots | Images |
|---|---|---|
| Comparison with Poisson distribution Blue bars denote a histogram of data divided into 1 sec bins. Red curve is a Poisson curve with rate = median count rate of data. |
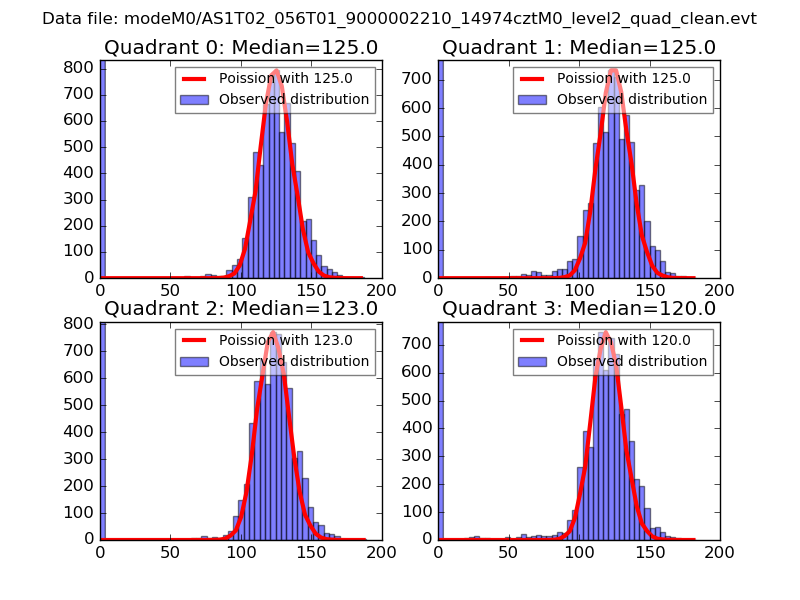 |
 |
| Quadrant-wise count rates Data is divided into 100 sec bins |
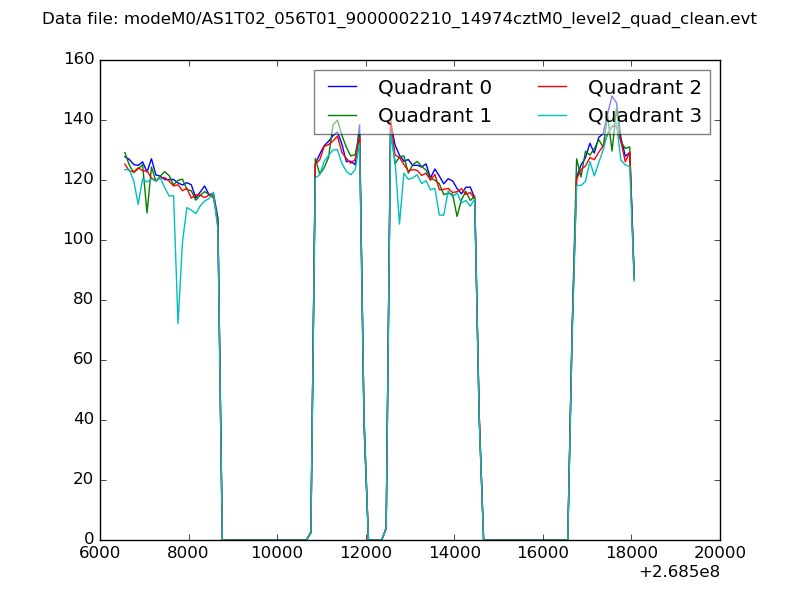 |
|
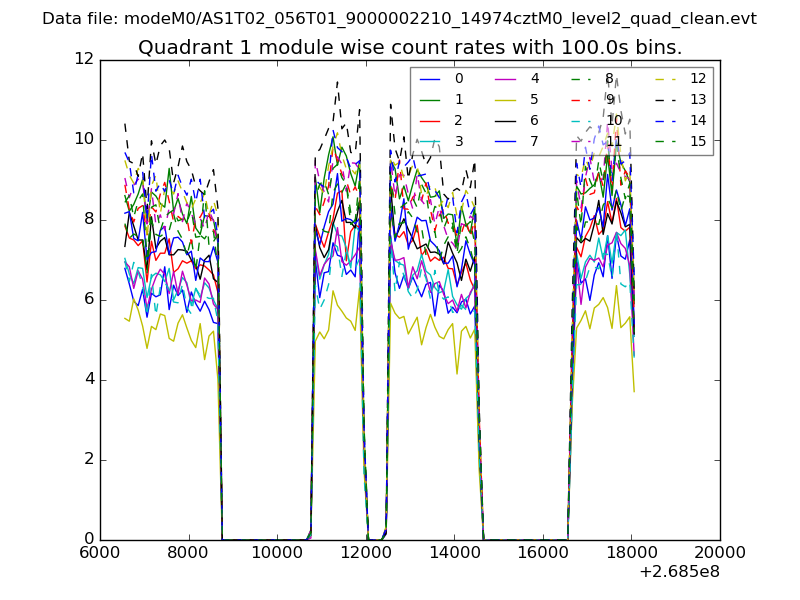
| Module-wise count rates for Quadrant A Data is divided into 100 sec bins |
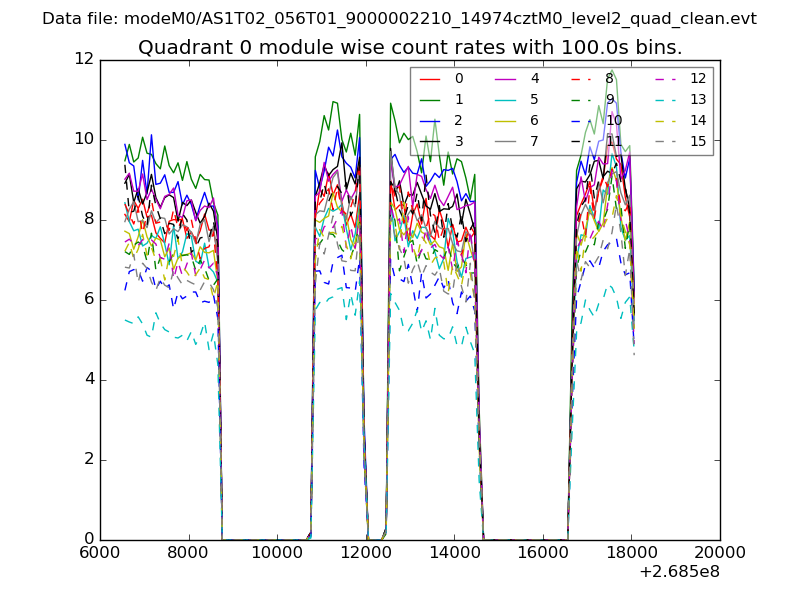 |
 |
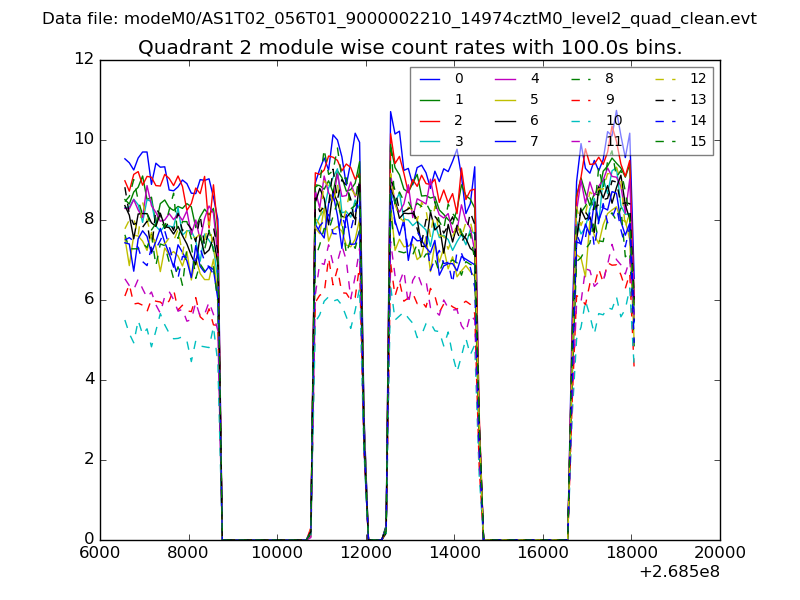
| Module-wise count rates for Quadrant B Data is divided into 100 sec bins |
 |
 |
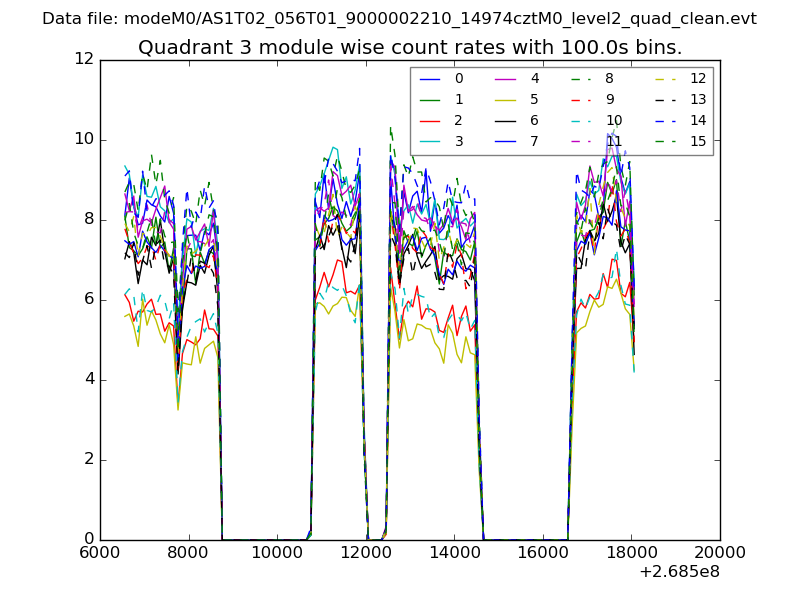
| Module-wise count rates for Quadrant C Data is divided into 100 sec bins |
 |
 |
| Module-wise count rates for Quadrant D Data is divided into 100 sec bins |
 |
 |
| Parameter | Plot |
|---|---|
| CZT HV Monitor | 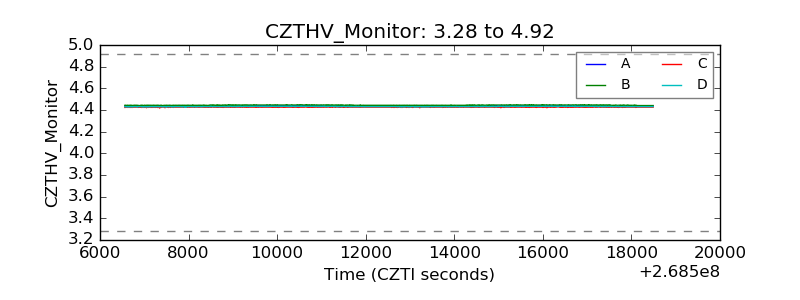 |
| D_VDD | 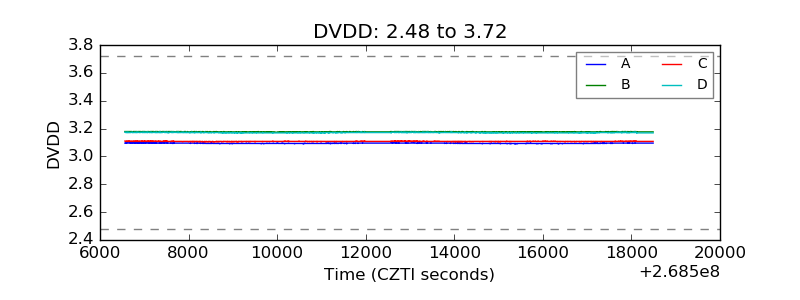 |
| Temperature 1 | 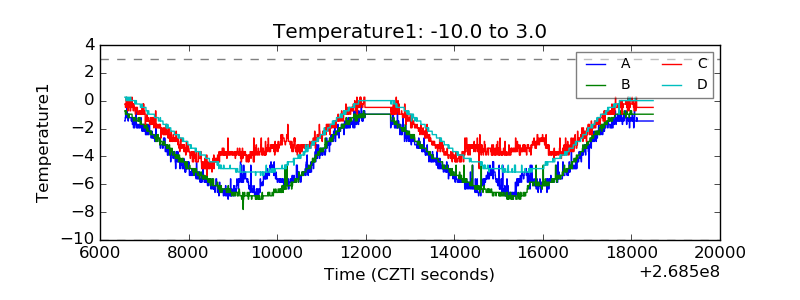 |
| Veto HV Monitor | 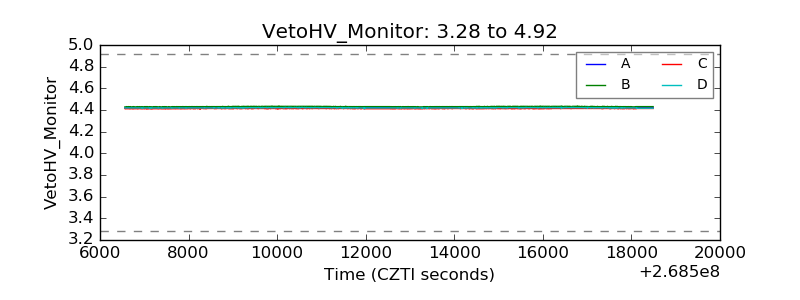 |
| Veto LLD | 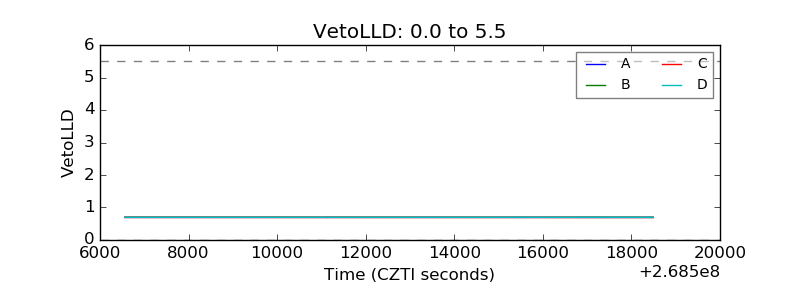 |
| Alpha Counter | 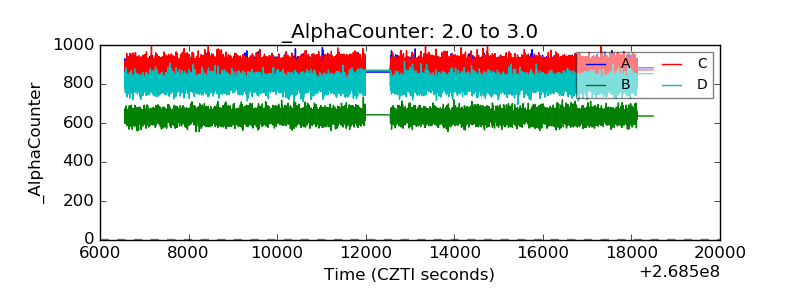 |
| _CPM_Rate | 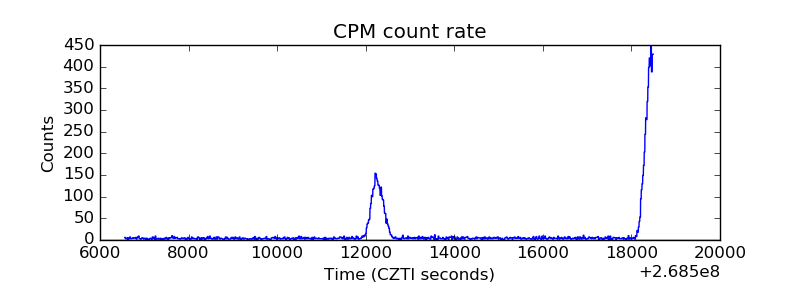 |
| CZT Counter | 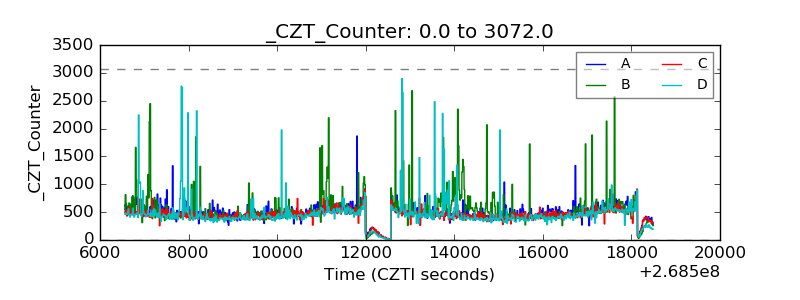 |
| +2.5 Volts monitor |  |
| +5 Volts monitor | 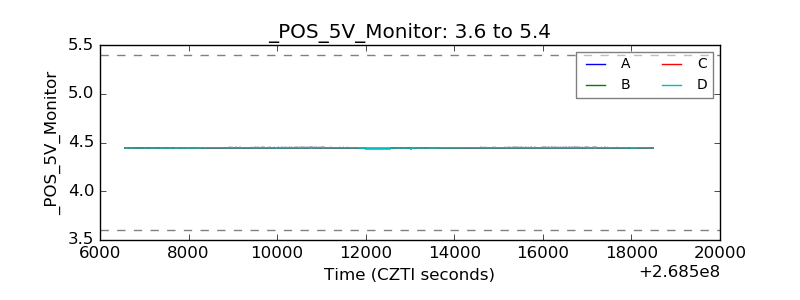 |
| _ROLL_ROT | 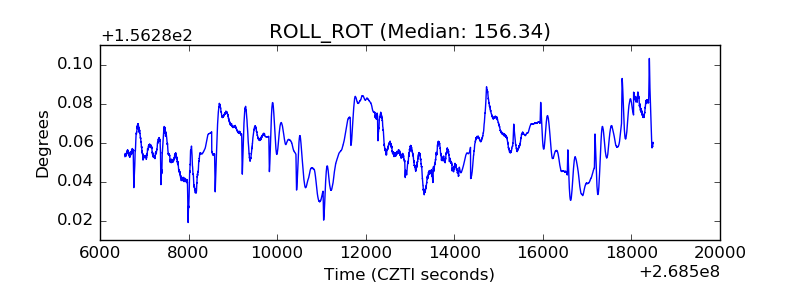 |
| _Roll_DEC |  |
| _Roll_RA | 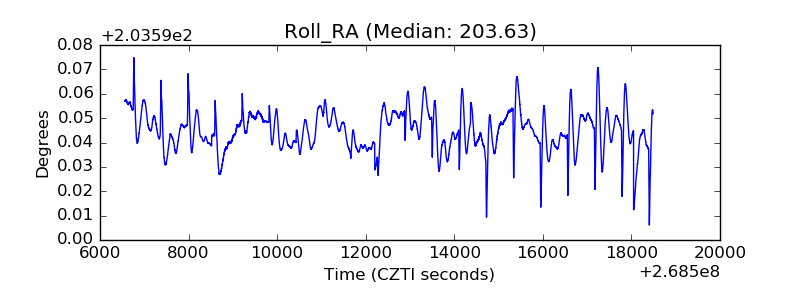 |
| Veto Counter | 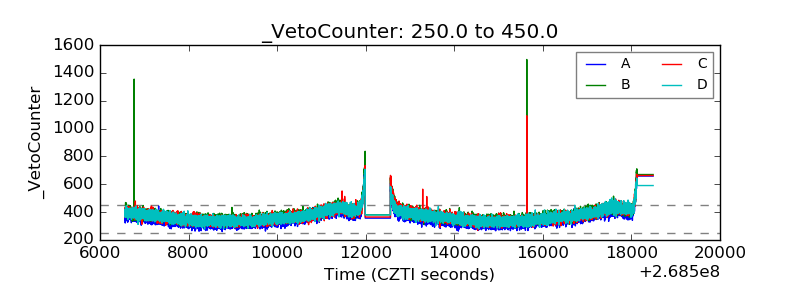 |