| Param | Original file | Final file |
|---|---|---|
| Filename | modeM0/AS1T02_056T01_9000002210_14975cztM0_level2.evt | modeM0/AS1T02_056T01_9000002210_14975cztM0_level2_quad_clean.evt |
| Size (bytes) | 484,162,560 | 93,170,880 |
| Size | 461.7 MB | 88.9 MB |
| Events in quadrant A | 3,481,351 | 597,190 |
| Events in quadrant B | 3,943,874 | 592,434 |
| Events in quadrant C | 3,276,697 | 581,240 |
| Events in quadrant D | 3,487,120 | 564,702 |
| Mode M0 | |||
|---|---|---|---|
| Quadrant | BADHDUFLAG | Total packets | Discarded packets |
| A | 0 | 14897 | 3 |
| B | 0 | 16264 | 2 |
| C | 0 | 14218 | 2 |
| D | 0 | 15318 | 2 |
| Mode M9 | |||
|---|---|---|---|
| Quadrant | BADHDUFLAG | Total packets | Discarded packets |
| A | 0 | 16 | 0 |
| B | 0 | 16 | 0 |
| C | 0 | 16 | 0 |
| D | 0 | 16 | 0 |
| Mode SS | |||
|---|---|---|---|
| Quadrant | BADHDUFLAG | Total packets | Discarded packets |
| A | 0 | 146 | 0 |
| B | 0 | 146 | 0 |
| C | 0 | 146 | 0 |
| D | 0 | 146 | 0 |
| Quadrant | Total seconds | Saturated seconds | Saturation percentage |
|---|---|---|---|
| A | 6968 | 33 | 0.473594% |
| B | 6968 | 113 | 1.621699% |
| C | 6968 | 15 | 0.215270% |
| D | 6968 | 105 | 1.506889% |
Noise dominated data is calculated using 1-second bins in cleaned event files. If a bin has >2000 counts, and if more than 50% of those come from <1% of pixels, then it is considered to be noise-dominated and hence unusable.
| Quadrant | # 1 sec bins | Bins with >0 counts | Bins with >2000 counts | High rate bins dominated by noise | Noise dominated (total time) | Noise dominated (detector-on time) | Marked lightcurve |
|---|---|---|---|---|---|---|---|
| A | 8645 | 6971 | 3 | 3 | 0.03% | 0.04% | 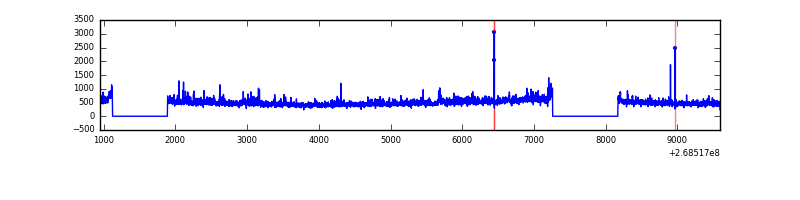 |
| B | 8645 | 6971 | 57 | 57 | 0.66% | 0.82% | 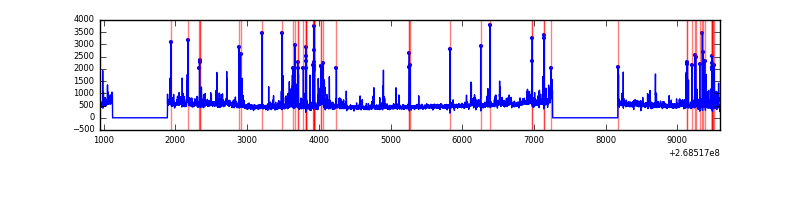 |
| C | 8645 | 6971 | 0 | 0 | 0.00% | 0.00% | 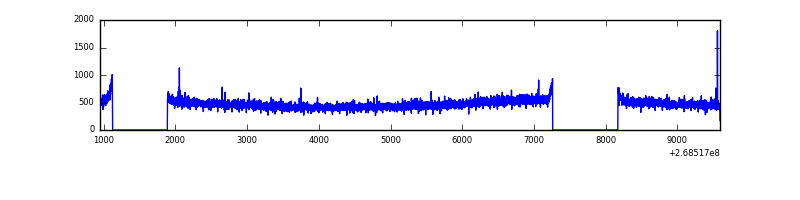 |
| D | 8645 | 6971 | 77 | 77 | 0.89% | 1.10% | 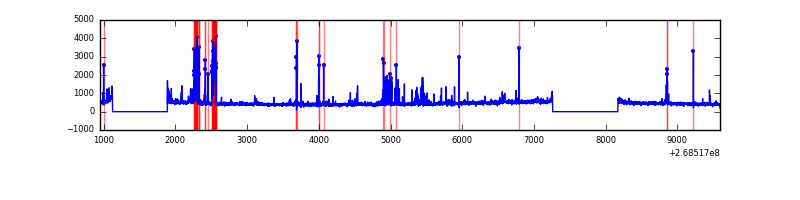 |
Top three noisy pixels from each quadrant. If the there are fewer than three noisy pixels in the level2.evt file, extra rows are filled as -1
| Pixel properties | Quadrant properties | ||||||
|---|---|---|---|---|---|---|---|
| Quadrant | DetID | PixID | Counts | Sigma | Mean | Median | Sigma |
| A | 12 | 189 | 84547 | 501.57 | 824 | 807 | 167.0 |
| A | 1 | 162 | 80323 | 476.27 | 824 | 807 | 167.0 |
| A | 1 | 178 | 41501 | 243.74 | 824 | 807 | 167.0 |
| B | 3 | 64 | 339345 | 2156.21 | 822 | 803 | 157.0 |
| B | 10 | 16 | 141903 | 898.68 | 822 | 803 | 157.0 |
| B | 0 | 219 | 42280 | 264.17 | 822 | 803 | 157.0 |
| C | 3 | 233 | 126343 | 674.83 | 803 | 807 | 186.0 |
| C | 8 | 128 | 9849 | 48.61 | 803 | 807 | 186.0 |
| C | 13 | 61 | 5866 | 27.2 | 803 | 807 | 186.0 |
| D | 7 | 38 | 239674 | 1152.62 | 791 | 772 | 207.3 |
| D | 13 | 249 | 133157 | 638.71 | 791 | 772 | 207.3 |
| D | 2 | 234 | 27366 | 128.31 | 791 | 772 | 207.3 |
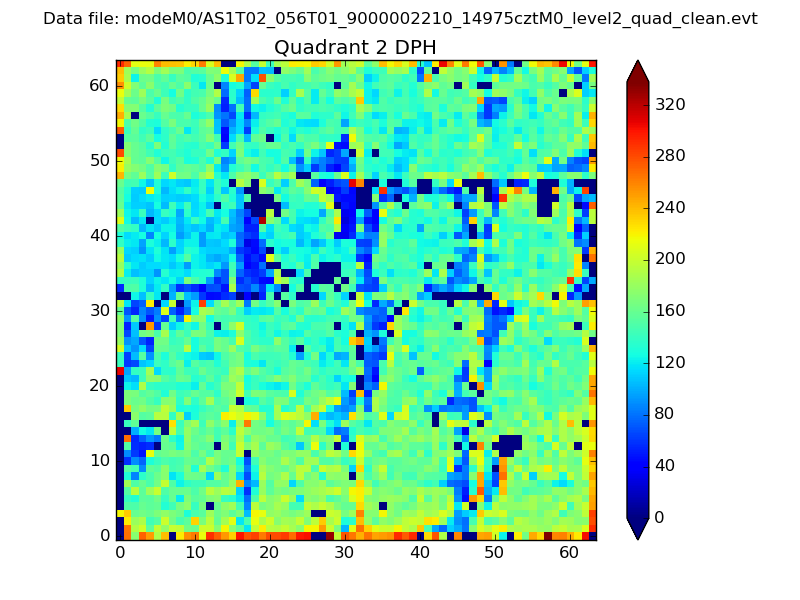
Histogram calculated using DETX and DETY for each event in the final _common_clean file
| Quadrant A | 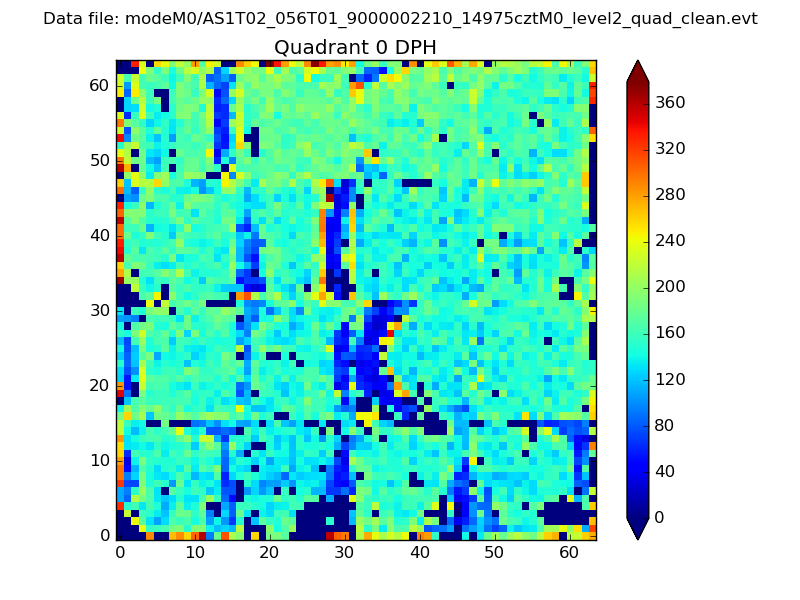 |
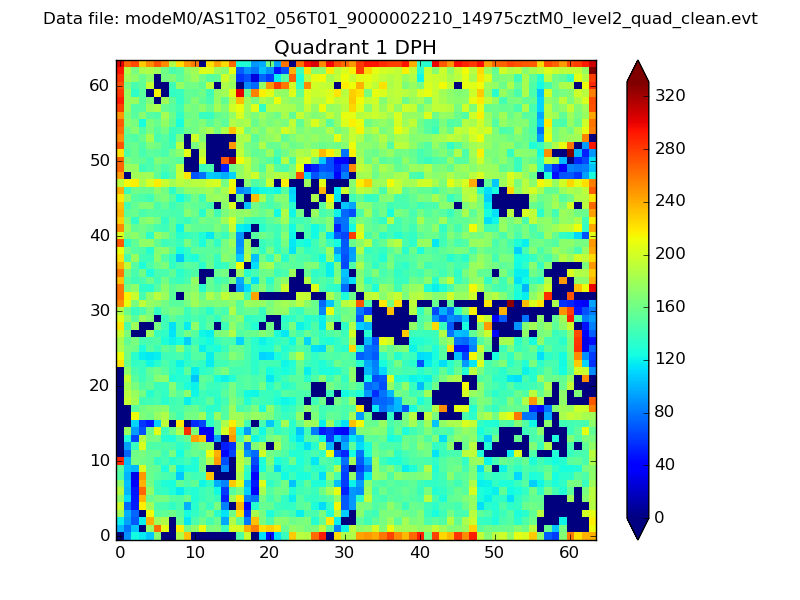 |
Quadrant B |
|---|---|---|---|
| Quadrant D | 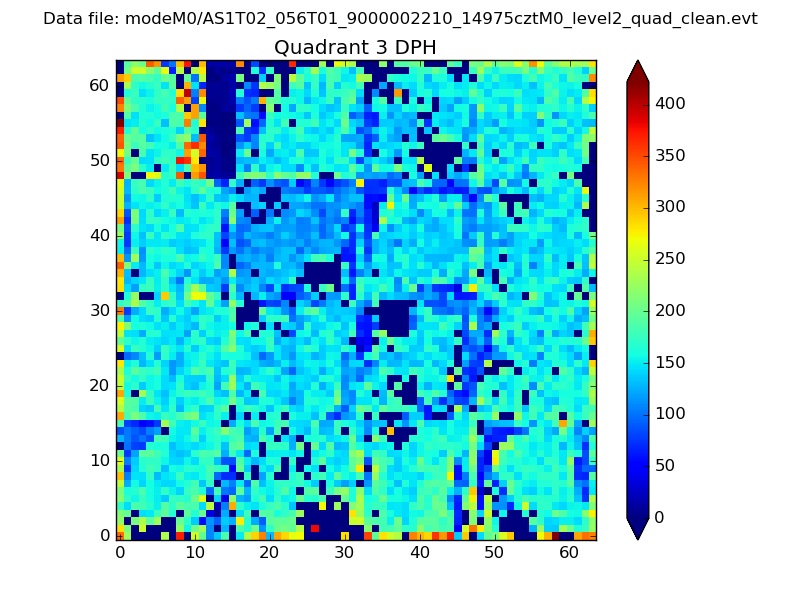 |
 |
Quadrant C |
| Plot type | Count rate plots | Images |
|---|---|---|
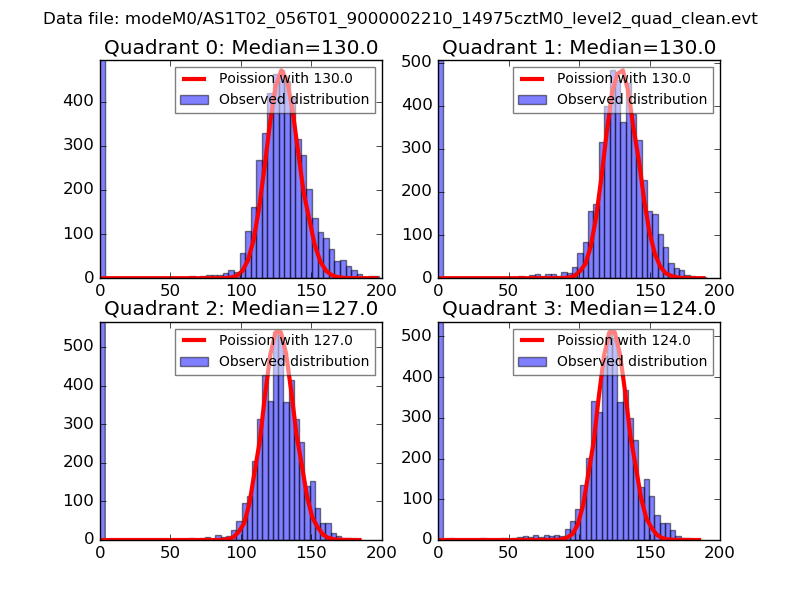
| Comparison with Poisson distribution Blue bars denote a histogram of data divided into 1 sec bins. Red curve is a Poisson curve with rate = median count rate of data. |
 |
 |
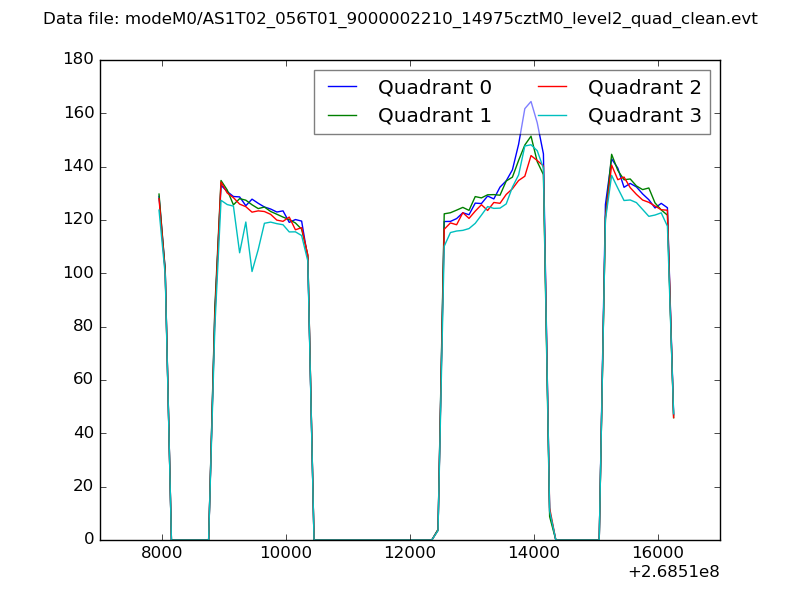
| Quadrant-wise count rates Data is divided into 100 sec bins |
 |
|
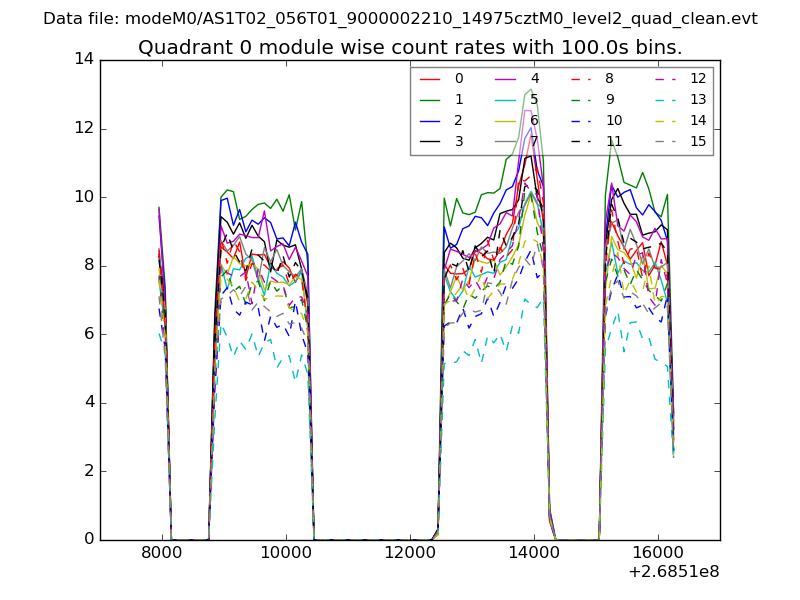
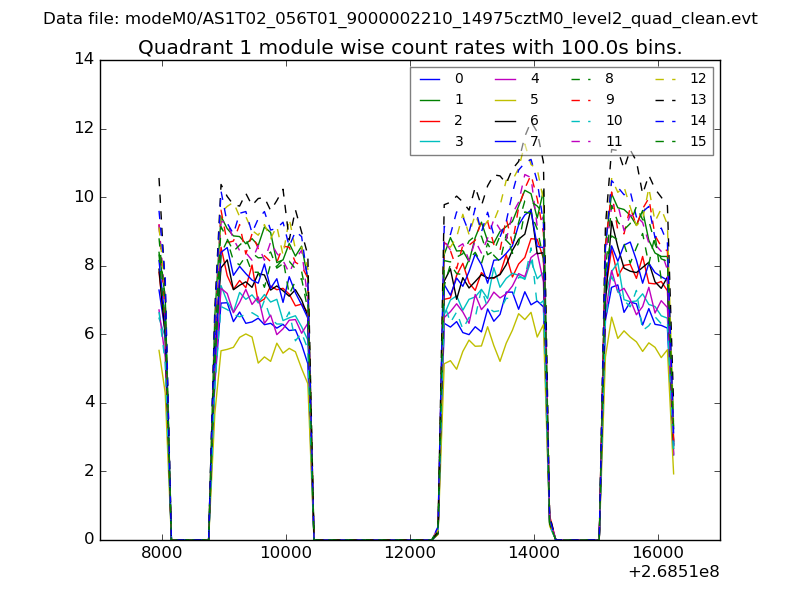
| Module-wise count rates for Quadrant A Data is divided into 100 sec bins |
 |
 |
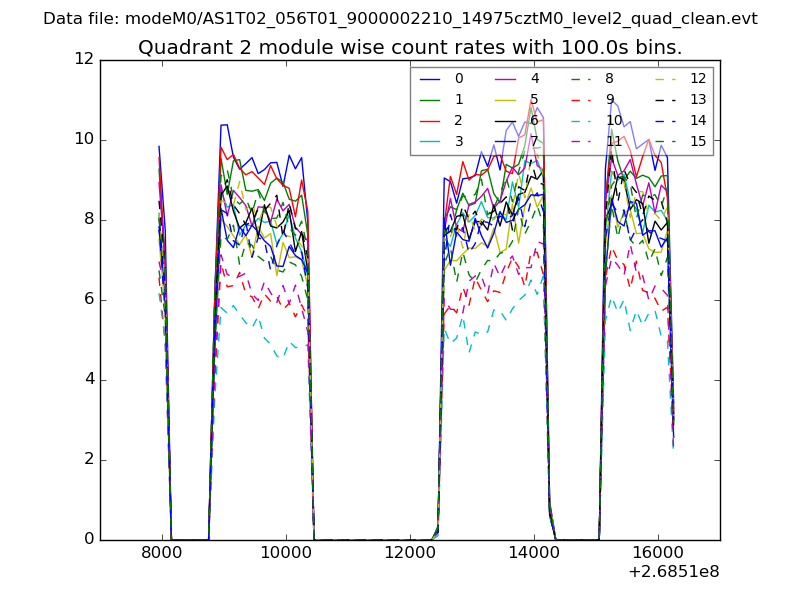
| Module-wise count rates for Quadrant B Data is divided into 100 sec bins |
 |
 |
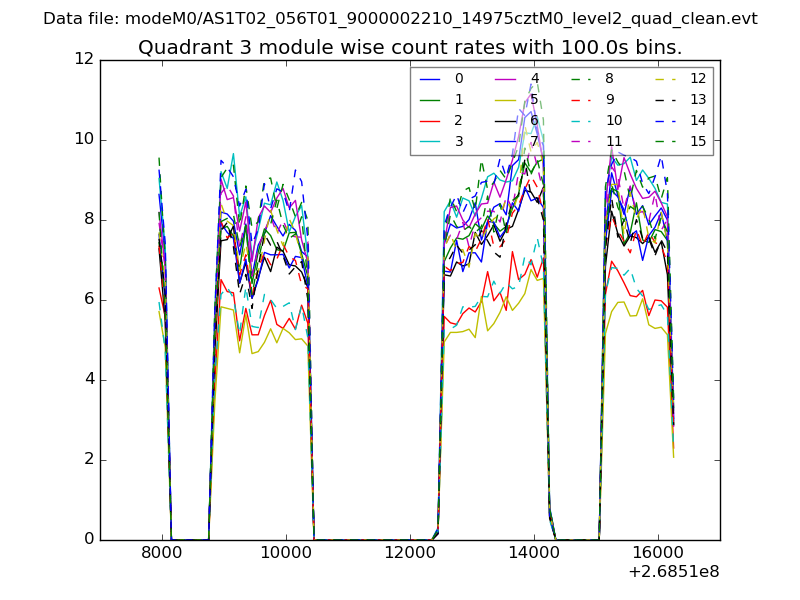
| Module-wise count rates for Quadrant C Data is divided into 100 sec bins |
 |
 |
| Module-wise count rates for Quadrant D Data is divided into 100 sec bins |
 |
 |
| Parameter | Plot |
|---|---|
| CZT HV Monitor | 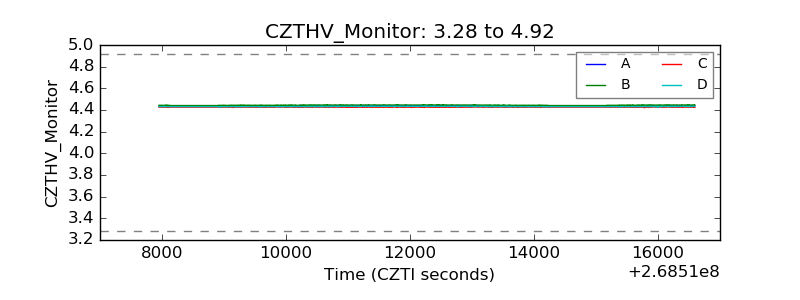 |
| D_VDD | 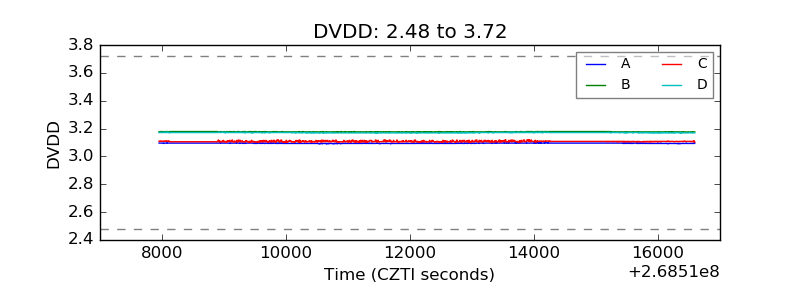 |
| Temperature 1 | 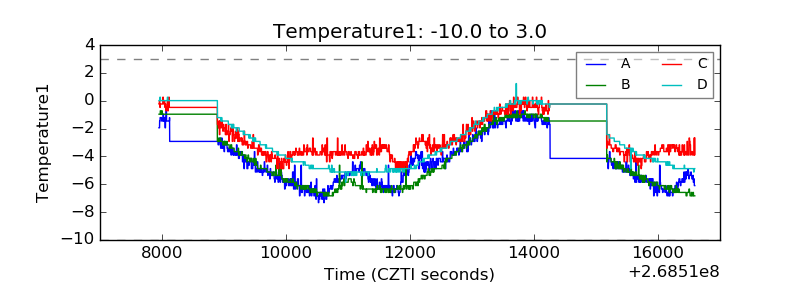 |
| Veto HV Monitor | 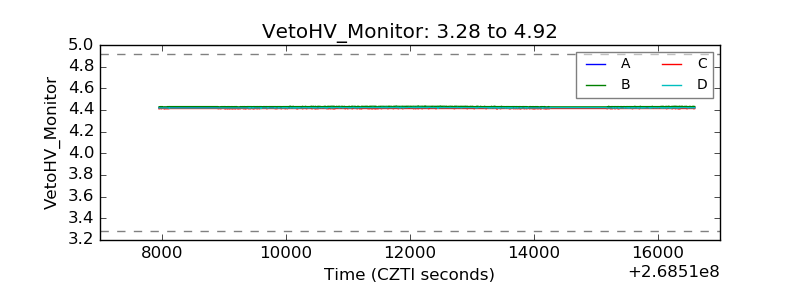 |
| Veto LLD | 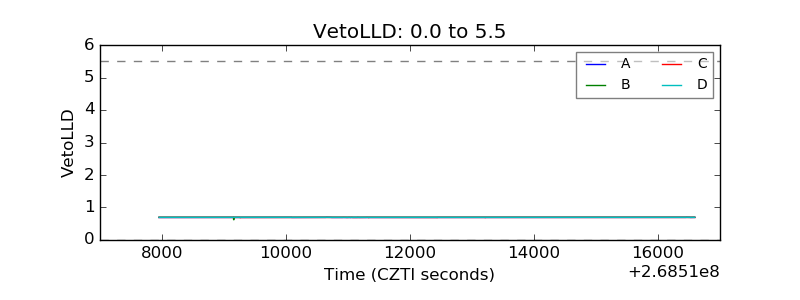 |
| Alpha Counter | 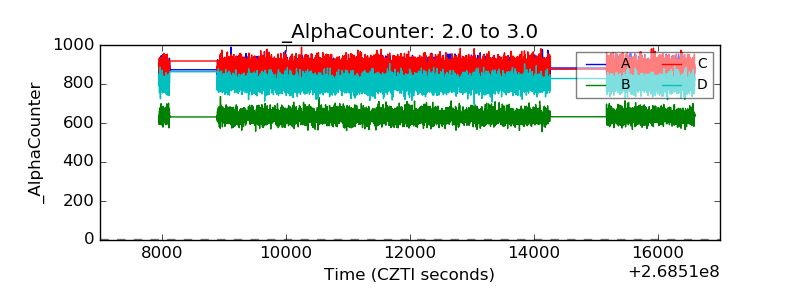 |
| _CPM_Rate | 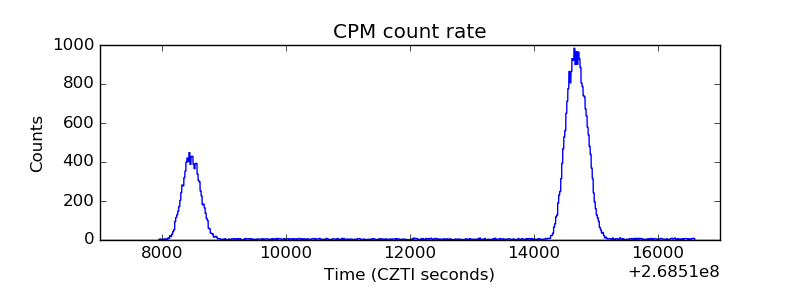 |
| CZT Counter | 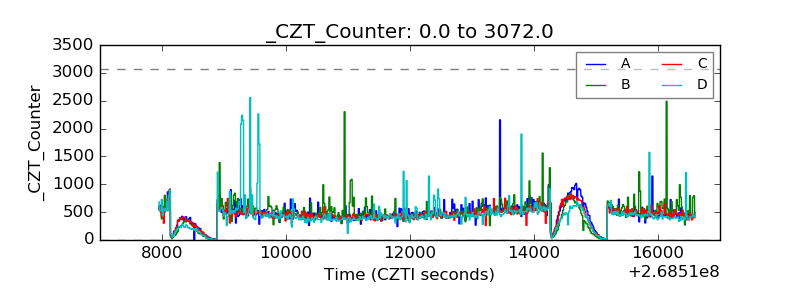 |
| +2.5 Volts monitor |  |
| +5 Volts monitor |  |
| _ROLL_ROT | 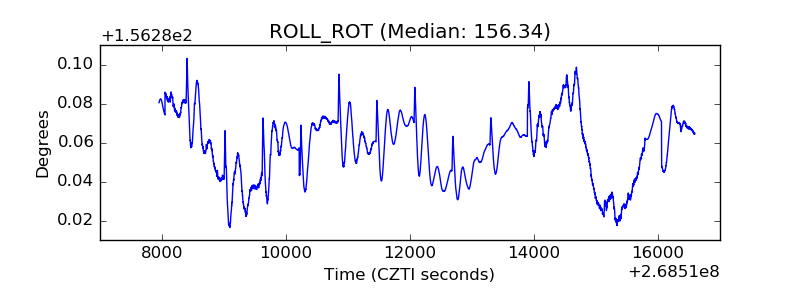 |
| _Roll_DEC | 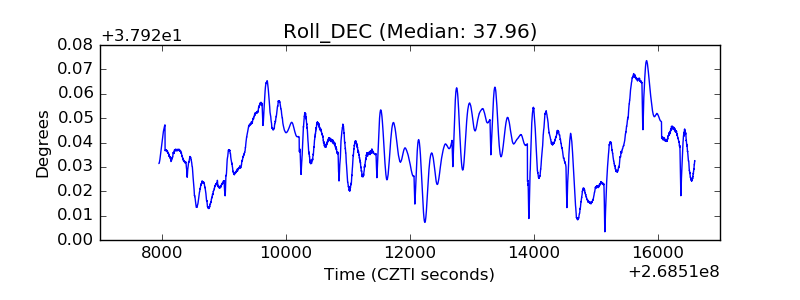 |
| _Roll_RA | 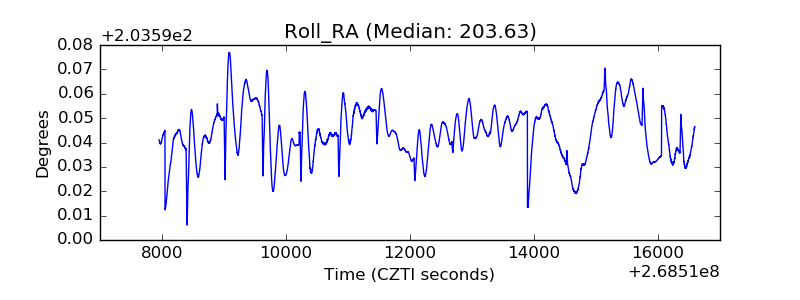 |
| Veto Counter | 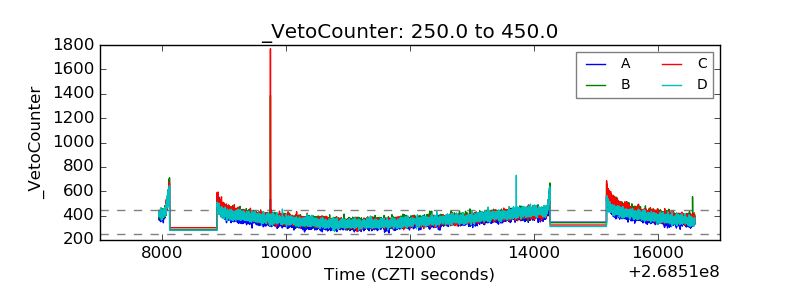 |