| Param | Original file | Final file |
|---|---|---|
| Filename | modeM0/AS1T02_056T01_9000002210_14977cztM0_level2.evt | modeM0/AS1T02_056T01_9000002210_14977cztM0_level2_quad_clean.evt |
| Size (bytes) | 497,393,280 | 74,854,080 |
| Size | 474.4 MB | 71.4 MB |
| Events in quadrant A | 3,313,604 | 461,790 |
| Events in quadrant B | 4,043,090 | 464,633 |
| Events in quadrant C | 3,286,726 | 449,585 |
| Events in quadrant D | 3,970,569 | 428,855 |
| Mode M0 | |||
|---|---|---|---|
| Quadrant | BADHDUFLAG | Total packets | Discarded packets |
| A | 0 | 13954 | 3 |
| B | 0 | 16190 | 2 |
| C | 0 | 13743 | 2 |
| D | 0 | 16138 | 2 |
| Mode M9 | |||
|---|---|---|---|
| Quadrant | BADHDUFLAG | Total packets | Discarded packets |
| A | 0 | 22 | 0 |
| B | 0 | 22 | 0 |
| C | 0 | 22 | 0 |
| D | 0 | 22 | 0 |
| Mode SS | |||
|---|---|---|---|
| Quadrant | BADHDUFLAG | Total packets | Discarded packets |
| A | 0 | 136 | 0 |
| B | 0 | 136 | 0 |
| C | 0 | 136 | 0 |
| D | 0 | 136 | 0 |
| Quadrant | Total seconds | Saturated seconds | Saturation percentage |
|---|---|---|---|
| A | 6624 | 28 | 0.422705% |
| B | 6624 | 198 | 2.989130% |
| C | 6624 | 15 | 0.226449% |
| D | 6624 | 217 | 3.275966% |
Noise dominated data is calculated using 1-second bins in cleaned event files. If a bin has >2000 counts, and if more than 50% of those come from <1% of pixels, then it is considered to be noise-dominated and hence unusable.
| Quadrant | # 1 sec bins | Bins with >0 counts | Bins with >2000 counts | High rate bins dominated by noise | Noise dominated (total time) | Noise dominated (detector-on time) | Marked lightcurve |
|---|---|---|---|---|---|---|---|
| A | 8825 | 6627 | 0 | 0 | 0.00% | 0.00% | 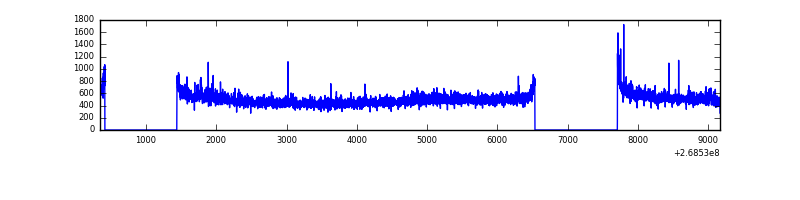 |
| B | 8825 | 6627 | 96 | 96 | 1.09% | 1.45% | 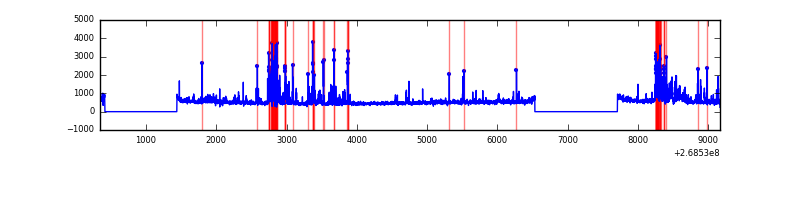 |
| C | 8825 | 6627 | 0 | 0 | 0.00% | 0.00% | 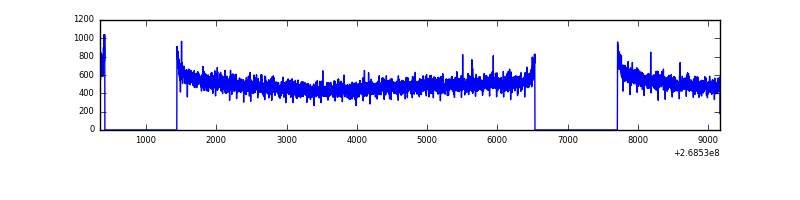 |
| D | 8825 | 6627 | 191 | 191 | 2.16% | 2.88% | 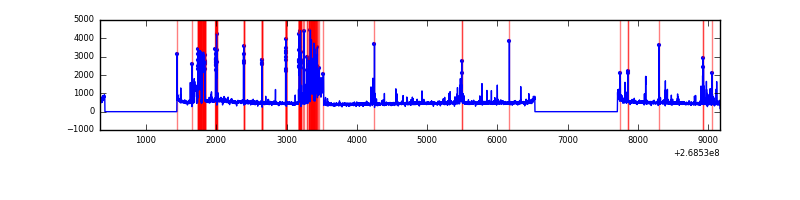 |
Top three noisy pixels from each quadrant. If the there are fewer than three noisy pixels in the level2.evt file, extra rows are filled as -1
| Pixel properties | Quadrant properties | ||||||
|---|---|---|---|---|---|---|---|
| Quadrant | DetID | PixID | Counts | Sigma | Mean | Median | Sigma |
| A | 1 | 162 | 45614 | 269.29 | 823 | 809 | 166.4 |
| A | 12 | 189 | 44216 | 260.89 | 823 | 809 | 166.4 |
| A | 1 | 178 | 19513 | 112.42 | 823 | 809 | 166.4 |
| B | 3 | 64 | 403212 | 2613.47 | 818 | 802 | 154.0 |
| B | 10 | 245 | 305138 | 1976.52 | 818 | 802 | 154.0 |
| B | 0 | 219 | 45001 | 287.05 | 818 | 802 | 154.0 |
| C | 3 | 233 | 160333 | 865.89 | 796 | 803 | 184.2 |
| C | 8 | 128 | 10392 | 52.05 | 796 | 803 | 184.2 |
| C | 13 | 61 | 5784 | 27.04 | 796 | 803 | 184.2 |
| D | 7 | 223 | 642278 | 3121.32 | 775 | 759 | 205.5 |
| D | 13 | 249 | 228976 | 1110.39 | 775 | 759 | 205.5 |
| D | 13 | 172 | 42533 | 203.25 | 775 | 759 | 205.5 |
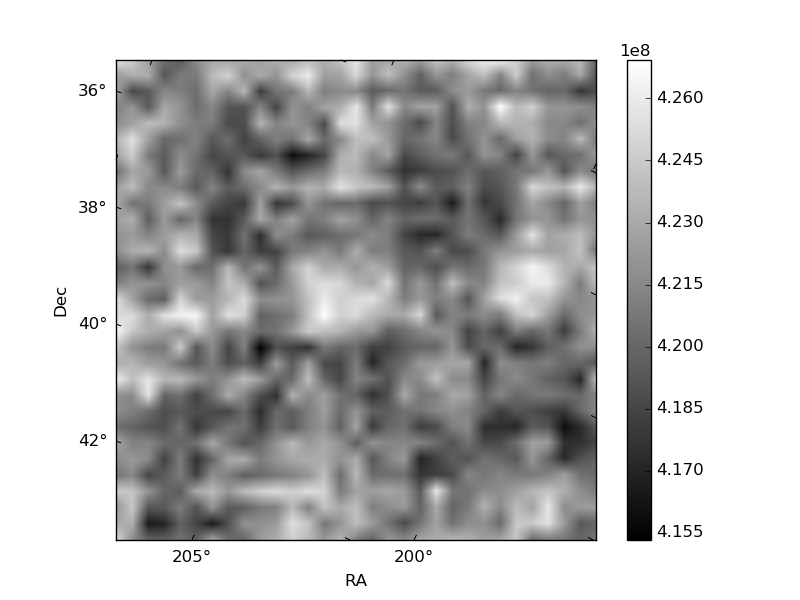
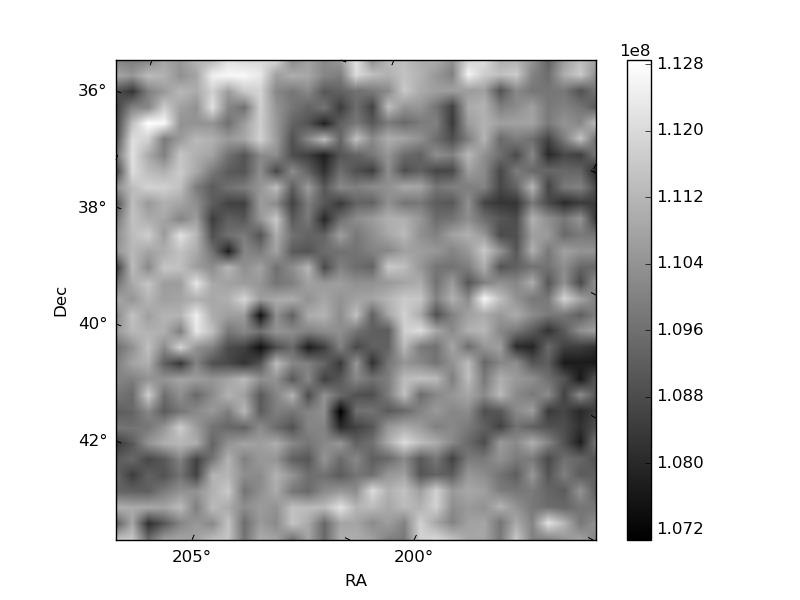
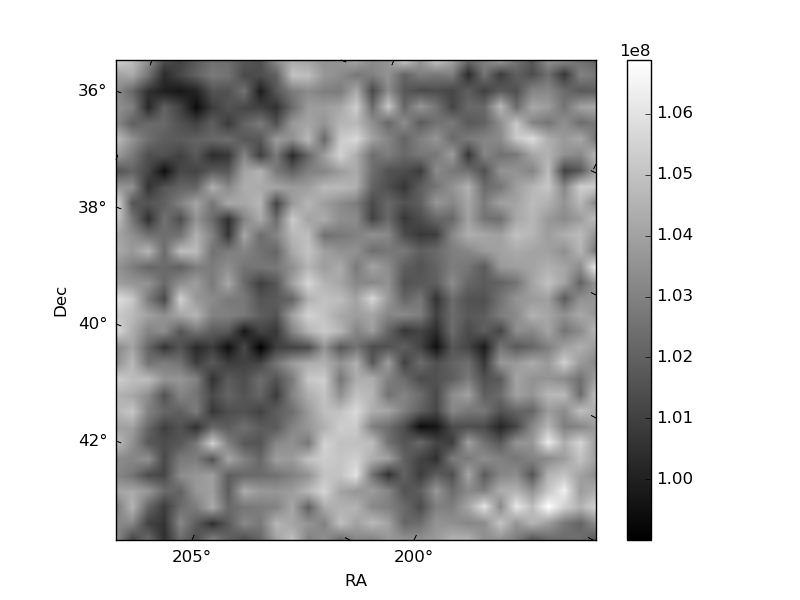
Histogram calculated using DETX and DETY for each event in the final _common_clean file
| Quadrant A | 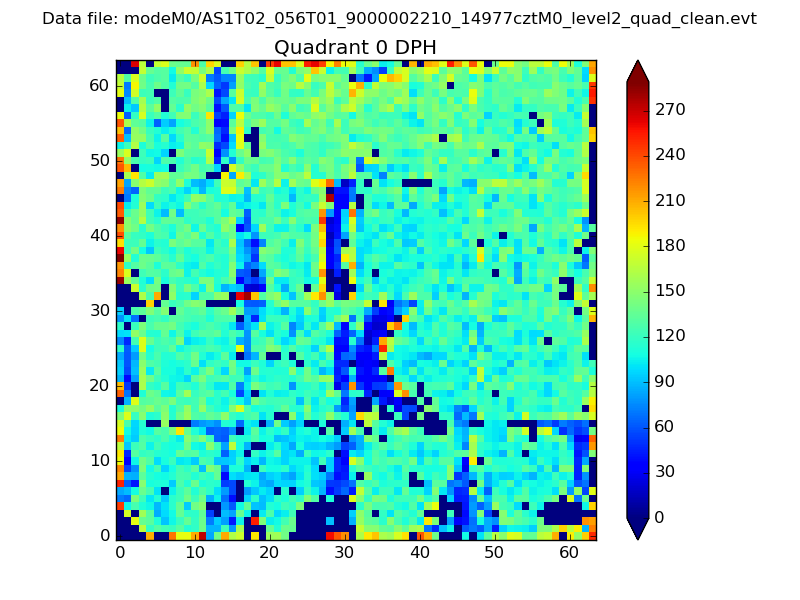 |
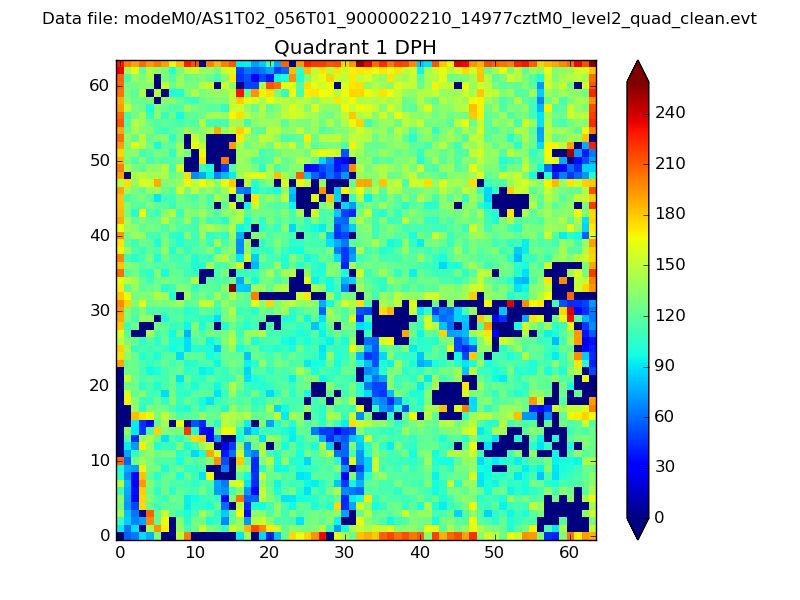 |
Quadrant B |
|---|---|---|---|
| Quadrant D | 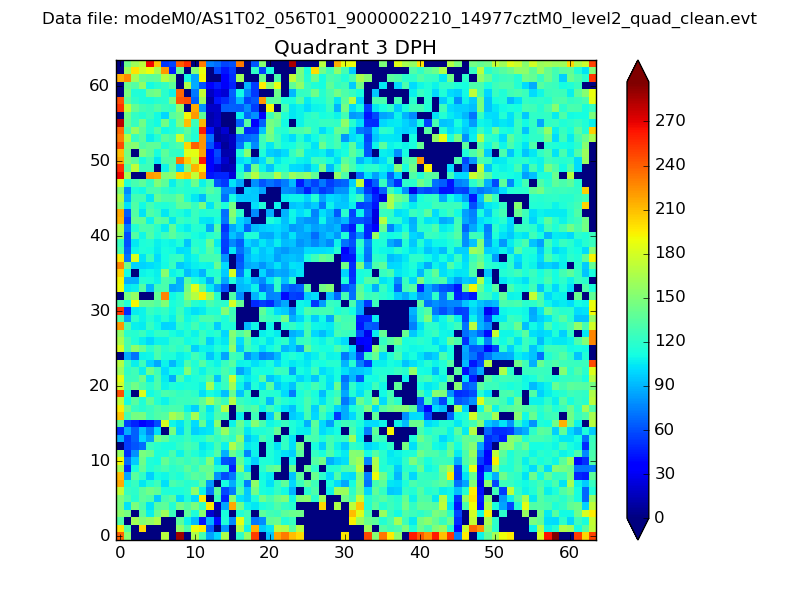 |
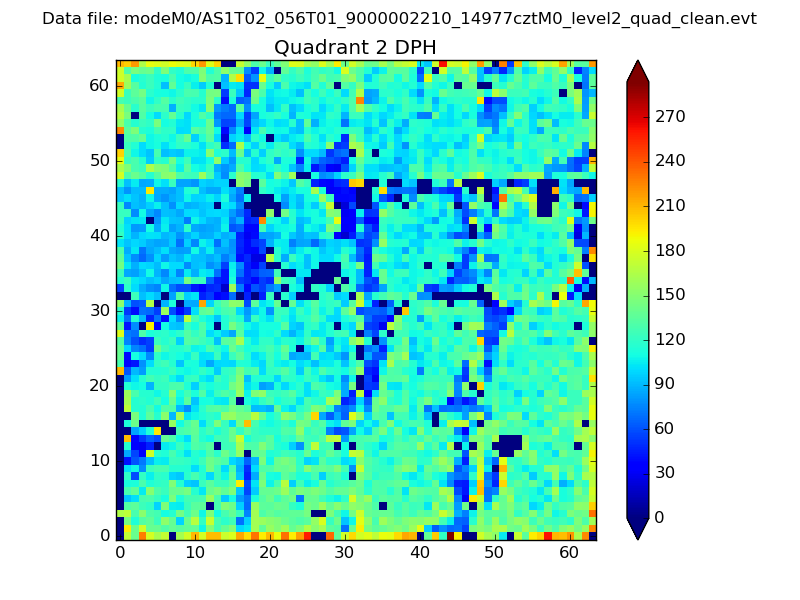 |
Quadrant C |
| Plot type | Count rate plots | Images |
|---|---|---|
| Comparison with Poisson distribution Blue bars denote a histogram of data divided into 1 sec bins. Red curve is a Poisson curve with rate = median count rate of data. |
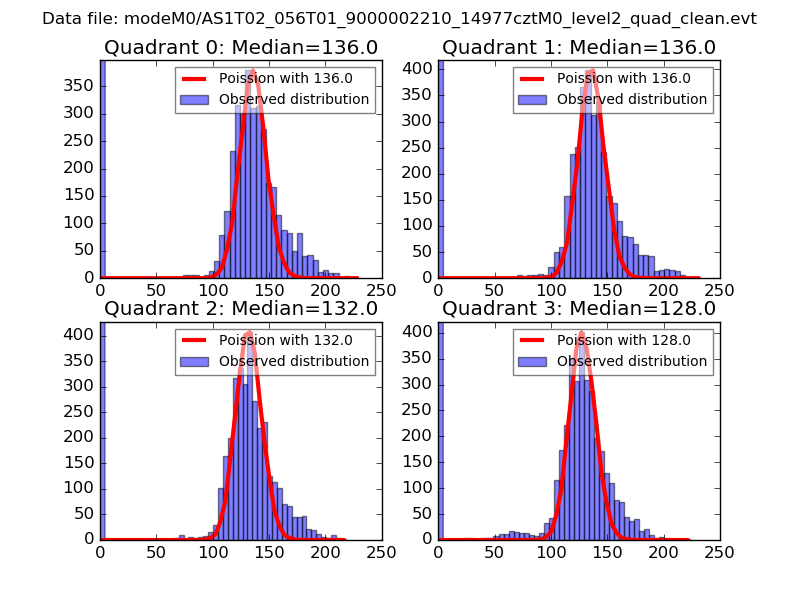 |
 |
| Quadrant-wise count rates Data is divided into 100 sec bins |
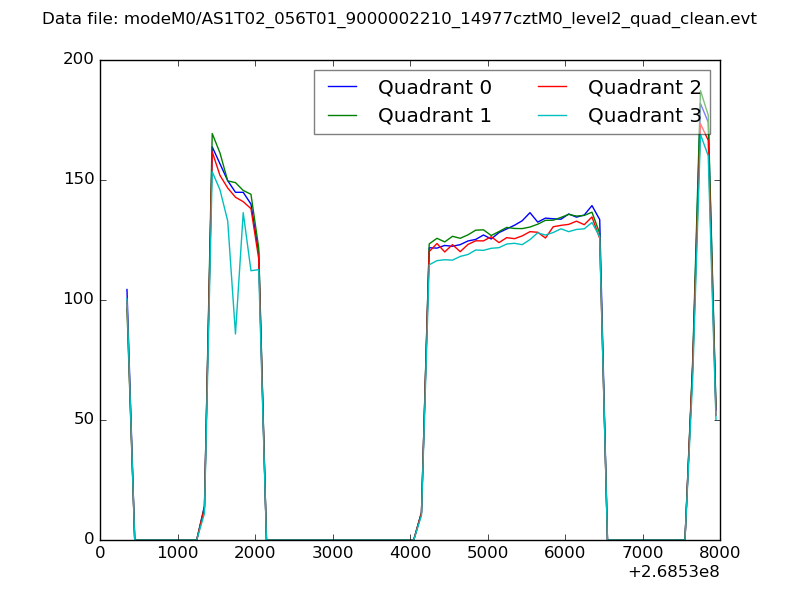 |
|
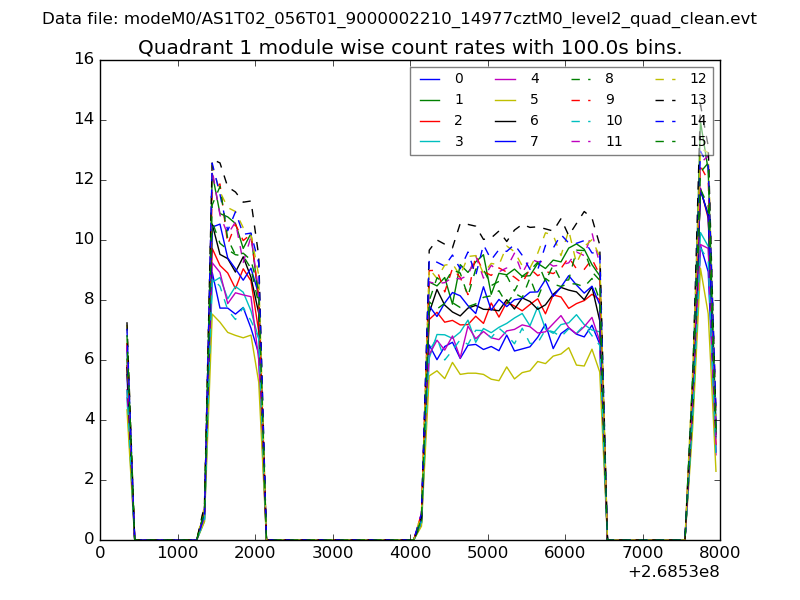
| Module-wise count rates for Quadrant A Data is divided into 100 sec bins |
 |
 |
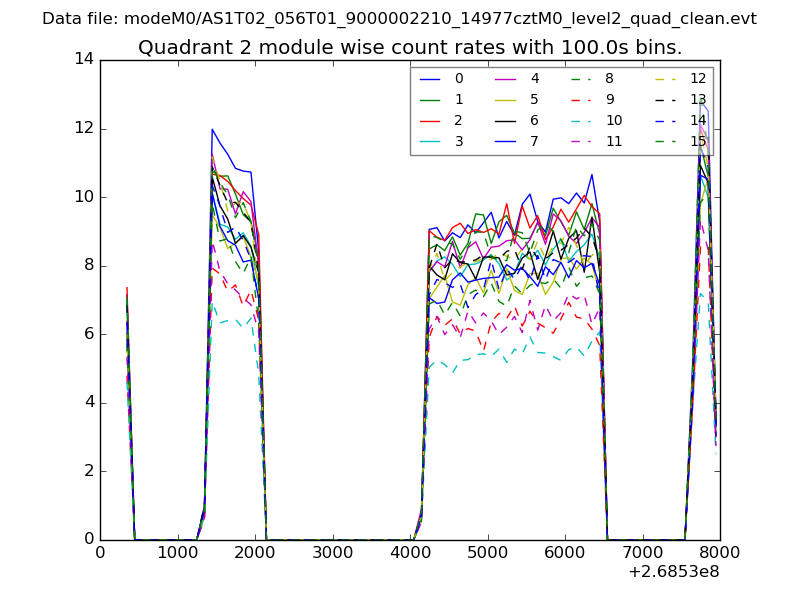
| Module-wise count rates for Quadrant B Data is divided into 100 sec bins |
 |
 |
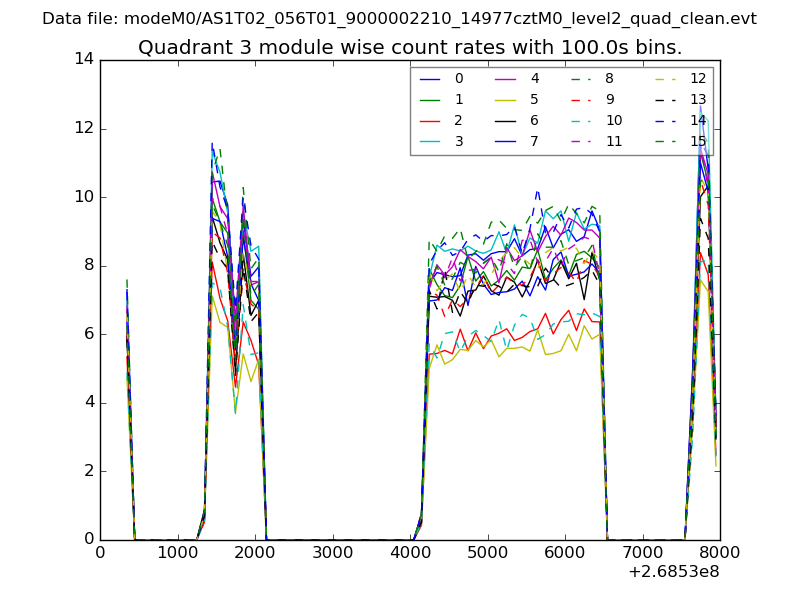
| Module-wise count rates for Quadrant C Data is divided into 100 sec bins |
 |
 |
| Module-wise count rates for Quadrant D Data is divided into 100 sec bins |
 |
 |
| Parameter | Plot |
|---|---|
| CZT HV Monitor | 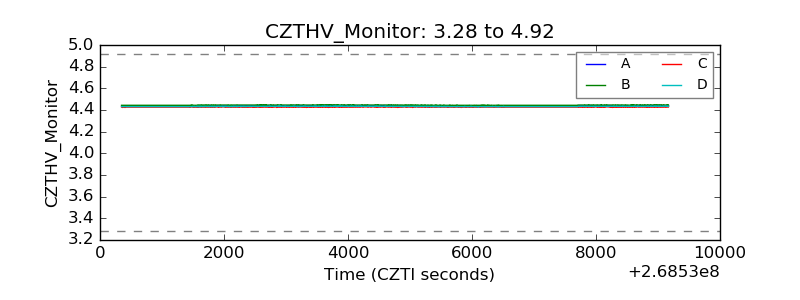 |
| D_VDD | 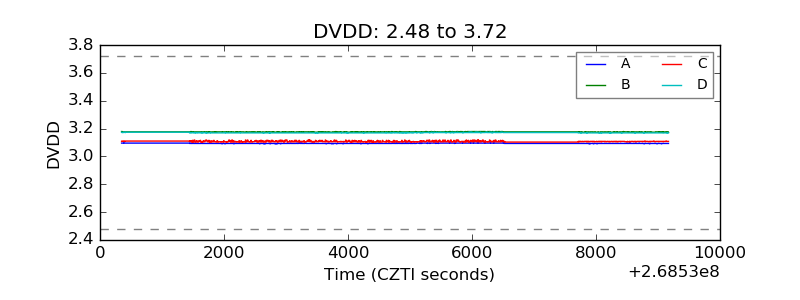 |
| Temperature 1 |  |
| Veto HV Monitor | 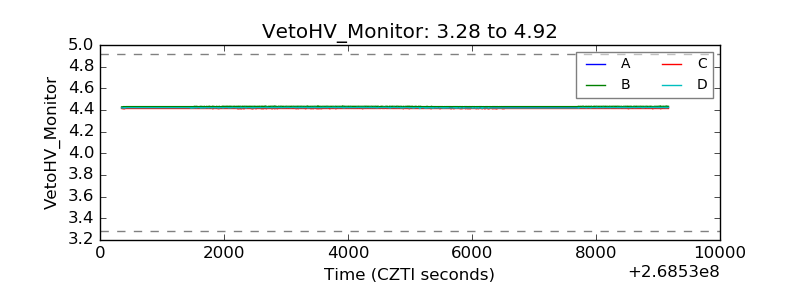 |
| Veto LLD | 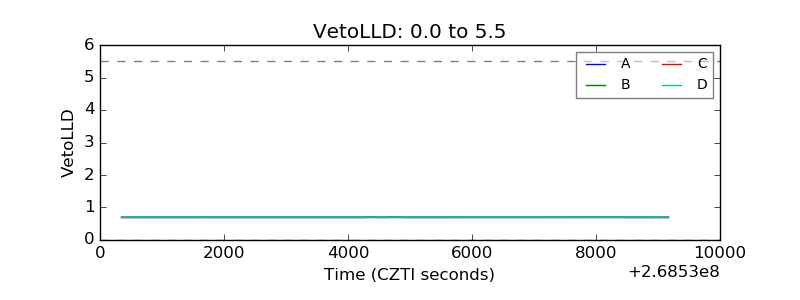 |
| Alpha Counter | 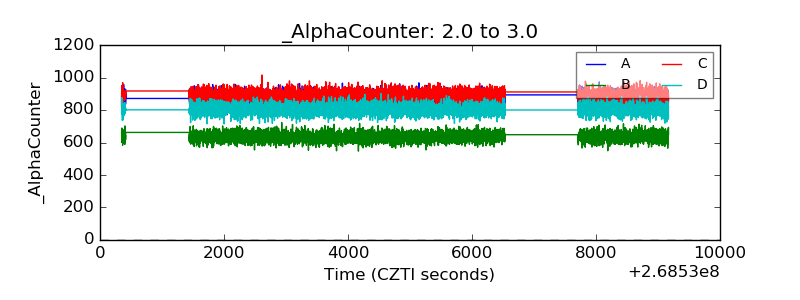 |
| _CPM_Rate | 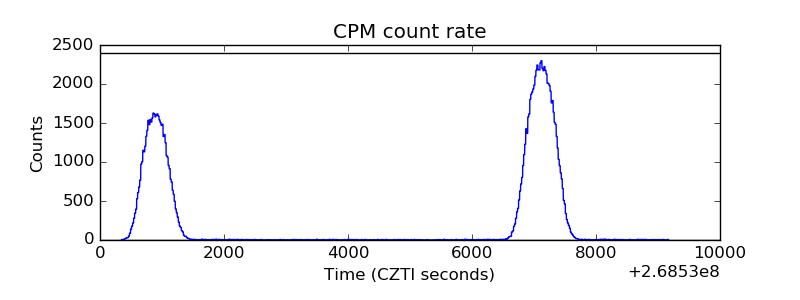 |
| CZT Counter | 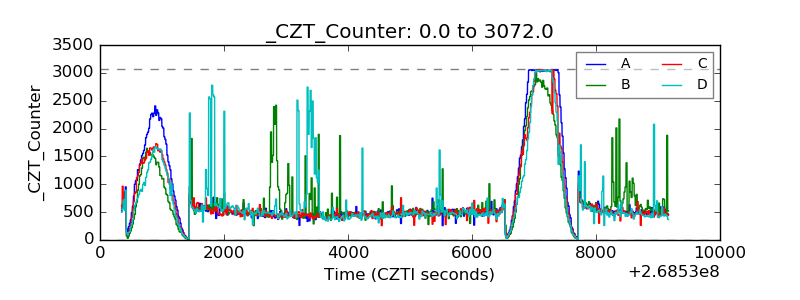 |
| +2.5 Volts monitor |  |
| +5 Volts monitor |  |
| _ROLL_ROT | 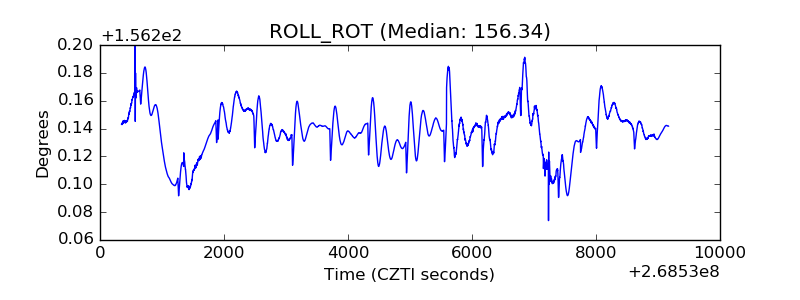 |
| _Roll_DEC | 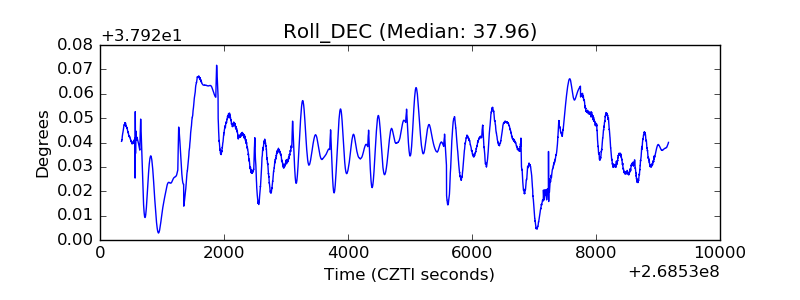 |
| _Roll_RA | 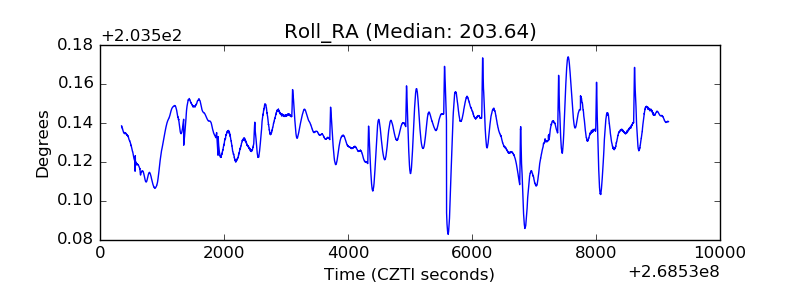 |
| Veto Counter | 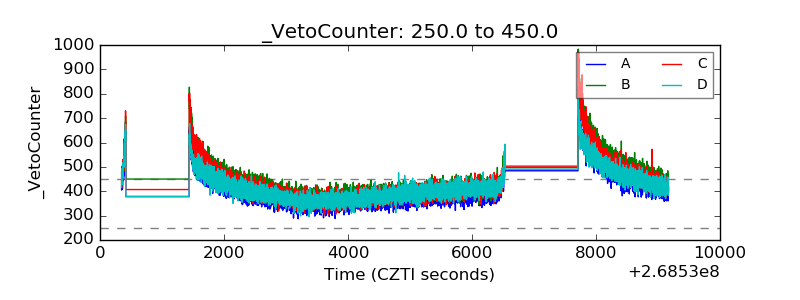 |