| Param | Original file | Final file |
|---|---|---|
| Filename | modeM0/AS1T02_056T01_9000002210_14979cztM0_level2.evt | modeM0/AS1T02_056T01_9000002210_14979cztM0_level2_quad_clean.evt |
| Size (bytes) | 473,443,200 | 66,490,560 |
| Size | 451.5 MB | 63.4 MB |
| Events in quadrant A | 3,459,438 | 399,874 |
| Events in quadrant B | 3,855,416 | 403,292 |
| Events in quadrant C | 3,247,929 | 388,784 |
| Events in quadrant D | 3,342,408 | 376,030 |
| Mode M0 | |||
|---|---|---|---|
| Quadrant | BADHDUFLAG | Total packets | Discarded packets |
| A | 0 | 14155 | 3 |
| B | 0 | 15444 | 2 |
| C | 0 | 13399 | 2 |
| D | 0 | 14084 | 2 |
| Mode M9 | |||
|---|---|---|---|
| Quadrant | BADHDUFLAG | Total packets | Discarded packets |
| A | 0 | 15 | 0 |
| B | 0 | 15 | 0 |
| C | 0 | 15 | 0 |
| D | 0 | 16 | 0 |
| Mode SS | |||
|---|---|---|---|
| Quadrant | BADHDUFLAG | Total packets | Discarded packets |
| A | 0 | 130 | 0 |
| B | 0 | 130 | 0 |
| C | 0 | 130 | 0 |
| D | 0 | 130 | 0 |
| Quadrant | Total seconds | Saturated seconds | Saturation percentage |
|---|---|---|---|
| A | 6379 | 37 | 0.580028% |
| B | 6379 | 110 | 1.724408% |
| C | 6379 | 17 | 0.266499% |
| D | 6379 | 96 | 1.504938% |
Noise dominated data is calculated using 1-second bins in cleaned event files. If a bin has >2000 counts, and if more than 50% of those come from <1% of pixels, then it is considered to be noise-dominated and hence unusable.
| Quadrant | # 1 sec bins | Bins with >0 counts | Bins with >2000 counts | High rate bins dominated by noise | Noise dominated (total time) | Noise dominated (detector-on time) | Marked lightcurve |
|---|---|---|---|---|---|---|---|
| A | 7630 | 6381 | 0 | 0 | 0.00% | 0.00% | 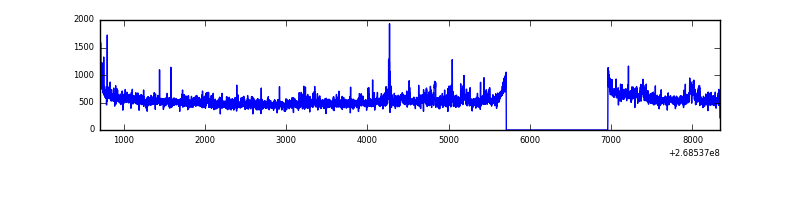 |
| B | 7630 | 6381 | 43 | 43 | 0.56% | 0.67% | 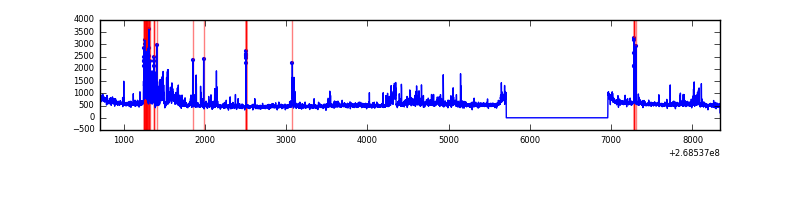 |
| C | 7630 | 6381 | 0 | 0 | 0.00% | 0.00% | 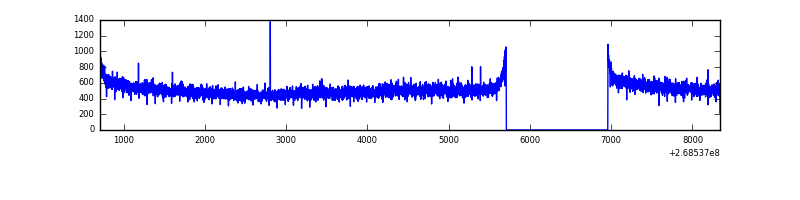 |
| D | 7630 | 6381 | 45 | 45 | 0.59% | 0.71% | 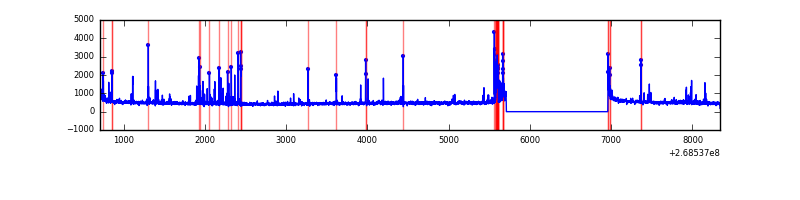 |
Top three noisy pixels from each quadrant. If the there are fewer than three noisy pixels in the level2.evt file, extra rows are filled as -1
| Pixel properties | Quadrant properties | ||||||
|---|---|---|---|---|---|---|---|
| Quadrant | DetID | PixID | Counts | Sigma | Mean | Median | Sigma |
| A | 12 | 189 | 125633 | 744.99 | 831 | 815 | 167.5 |
| A | 1 | 162 | 59561 | 350.63 | 831 | 815 | 167.5 |
| A | 1 | 178 | 24060 | 138.74 | 831 | 815 | 167.5 |
| B | 3 | 64 | 363491 | 2353.61 | 829 | 810 | 154.1 |
| B | 10 | 16 | 73992 | 474.91 | 829 | 810 | 154.1 |
| B | 3 | 209 | 31165 | 196.99 | 829 | 810 | 154.1 |
| C | 3 | 233 | 145200 | 784.58 | 795 | 802 | 184.0 |
| C | 13 | 61 | 5888 | 27.63 | 795 | 802 | 184.0 |
| C | 8 | 222 | 2941 | 11.62 | 795 | 802 | 184.0 |
| D | 13 | 249 | 157962 | 797.31 | 790 | 767 | 197.2 |
| D | 7 | 38 | 102786 | 517.45 | 790 | 767 | 197.2 |
| D | 7 | 223 | 34609 | 171.65 | 790 | 767 | 197.2 |
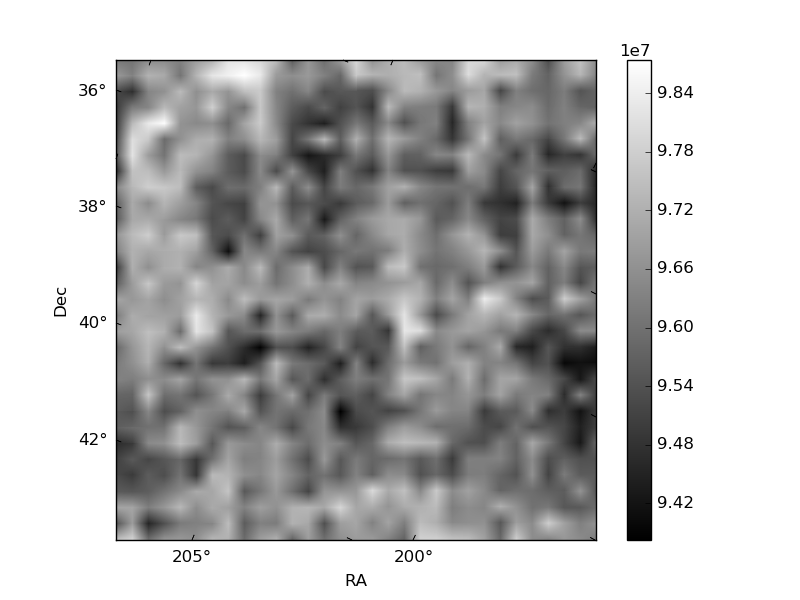
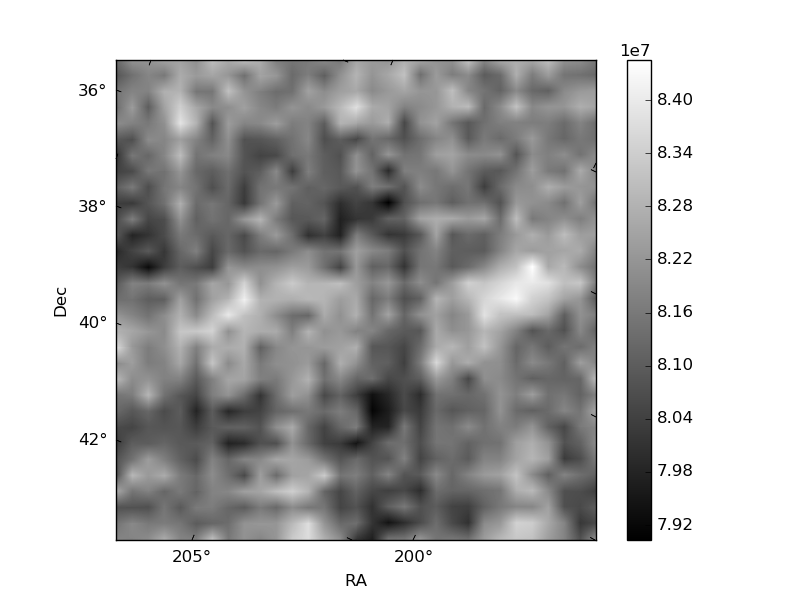
Histogram calculated using DETX and DETY for each event in the final _common_clean file
| Quadrant A | 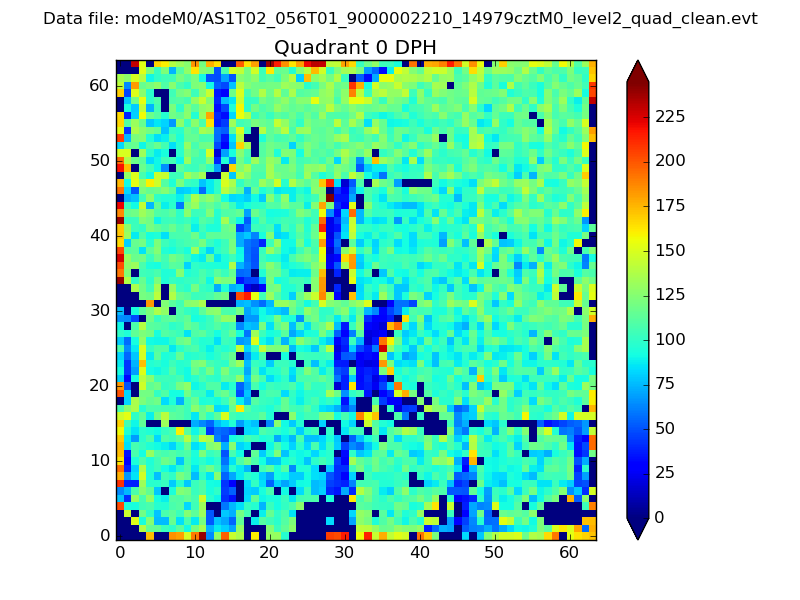 |
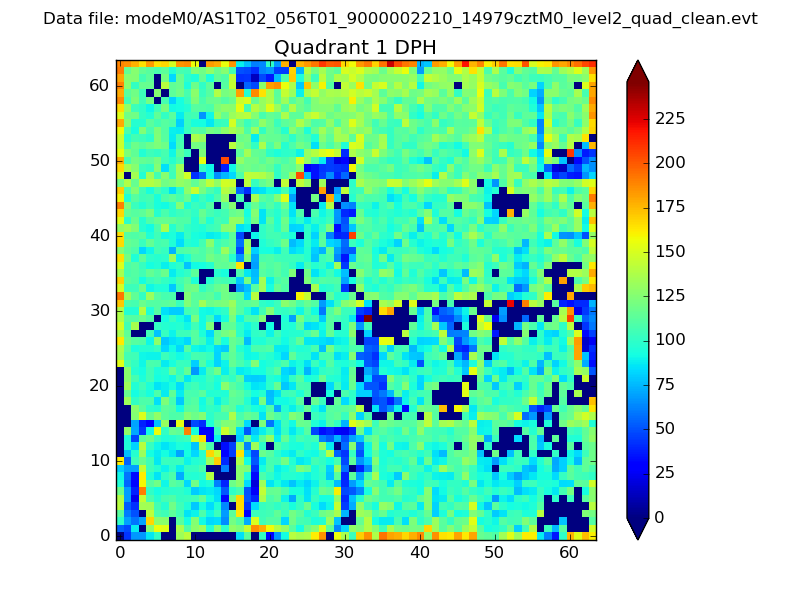 |
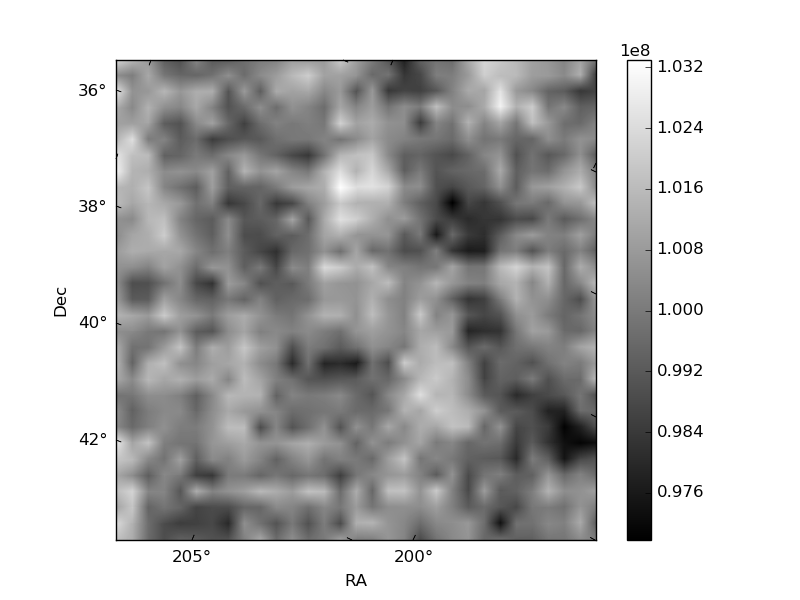
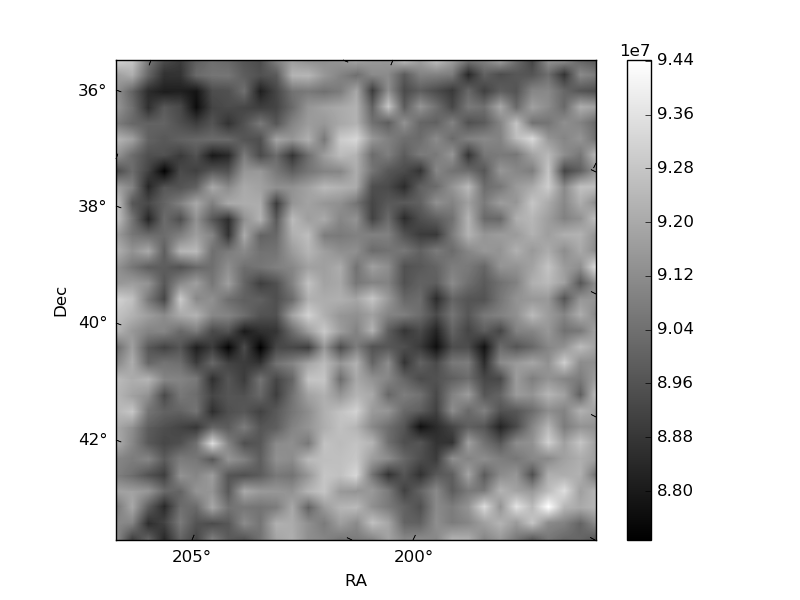
Quadrant B |
|---|---|---|---|
| Quadrant D | 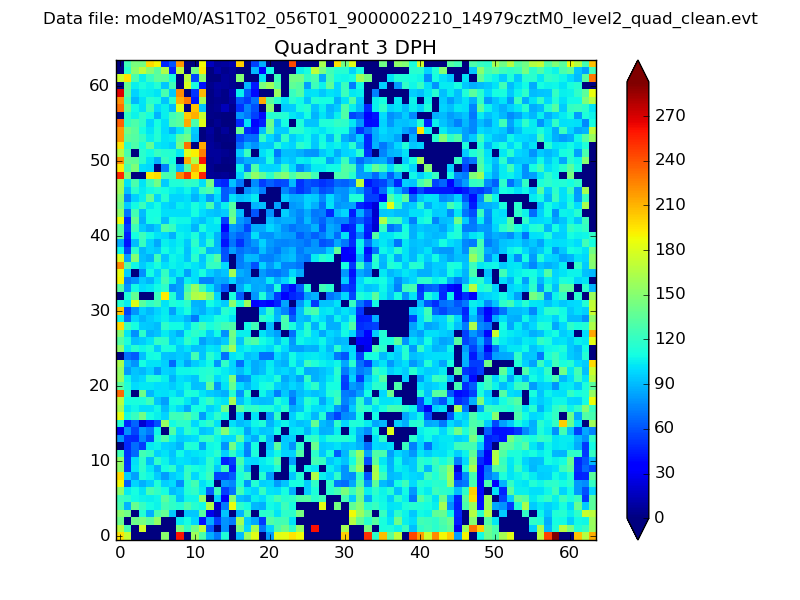 |
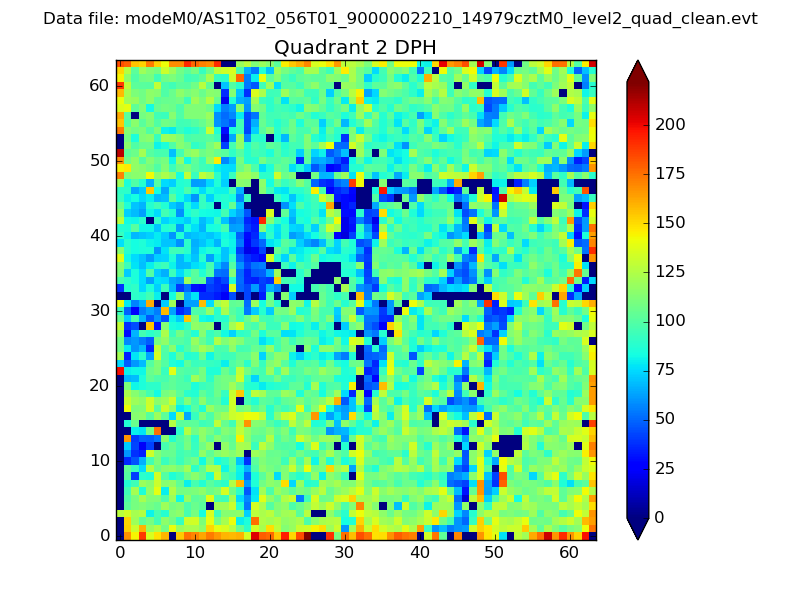 |
Quadrant C |
| Plot type | Count rate plots | Images |
|---|---|---|
| Comparison with Poisson distribution Blue bars denote a histogram of data divided into 1 sec bins. Red curve is a Poisson curve with rate = median count rate of data. |
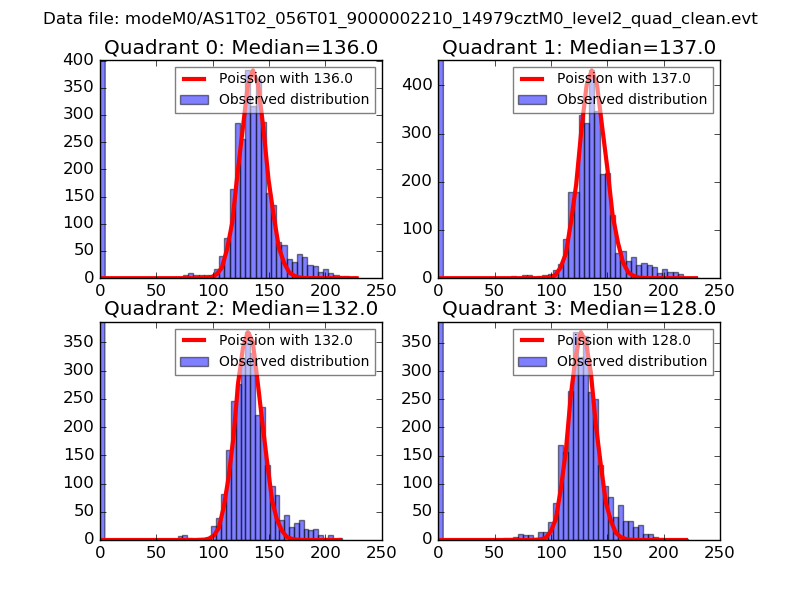 |
 |
| Quadrant-wise count rates Data is divided into 100 sec bins |
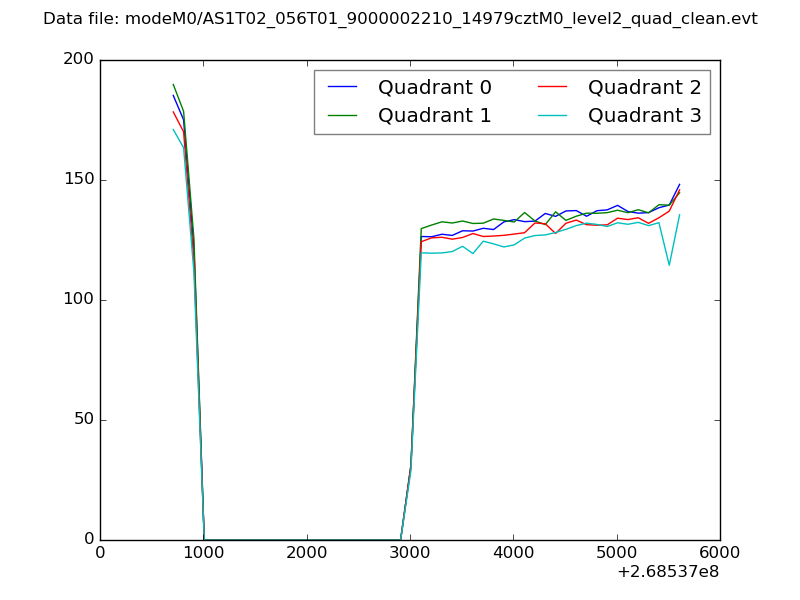 |
|
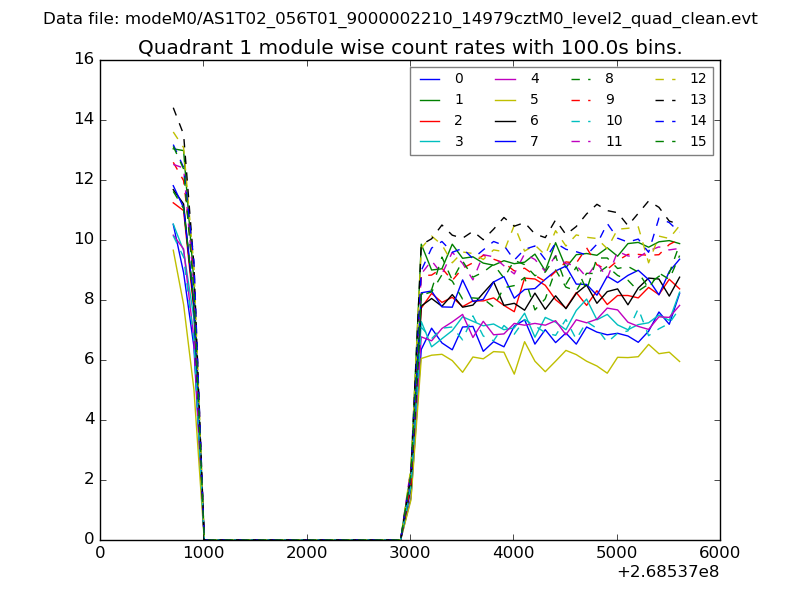
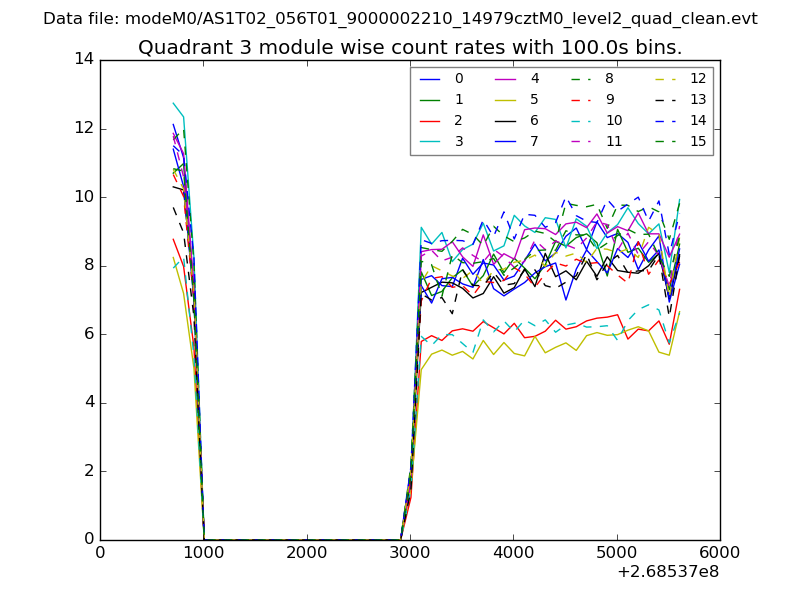
| Module-wise count rates for Quadrant A Data is divided into 100 sec bins |
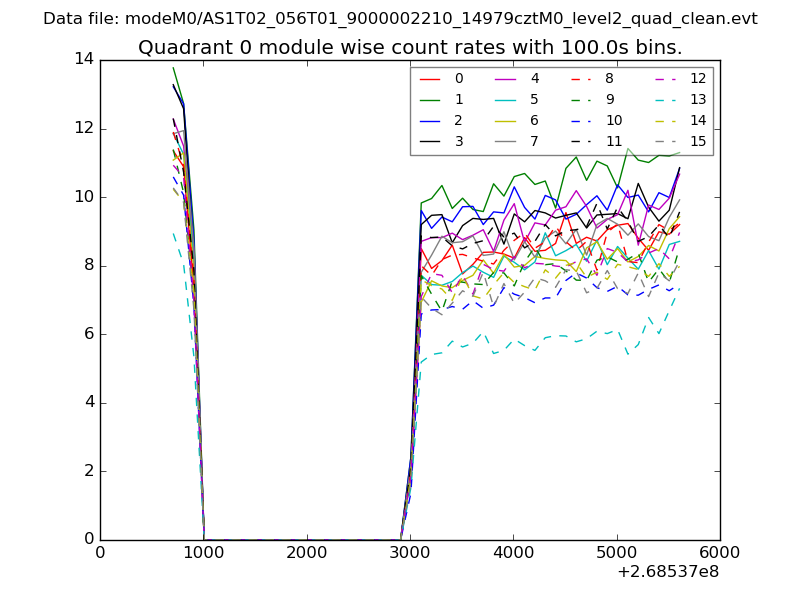 |
 |
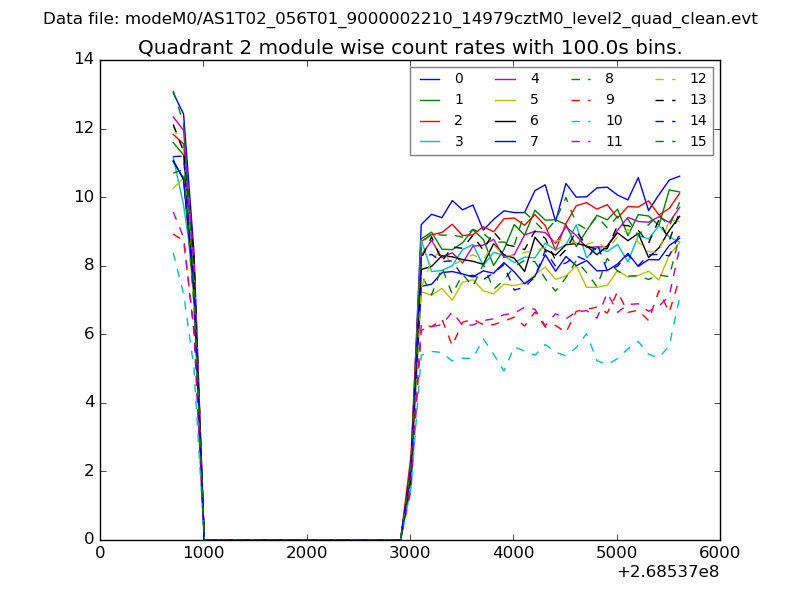
| Module-wise count rates for Quadrant B Data is divided into 100 sec bins |
 |
 |
| Module-wise count rates for Quadrant C Data is divided into 100 sec bins |
 |
 |
| Module-wise count rates for Quadrant D Data is divided into 100 sec bins |
 |
 |
| Parameter | Plot |
|---|---|
| CZT HV Monitor | 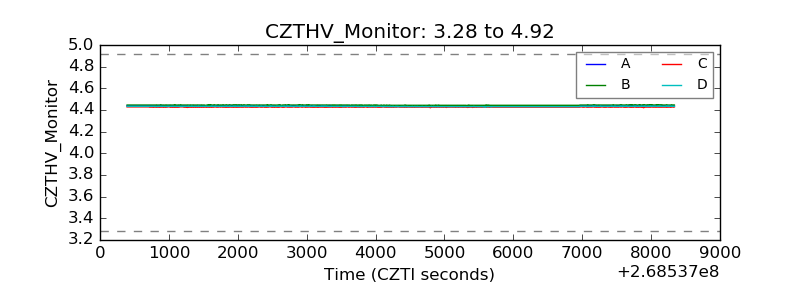 |
| D_VDD | 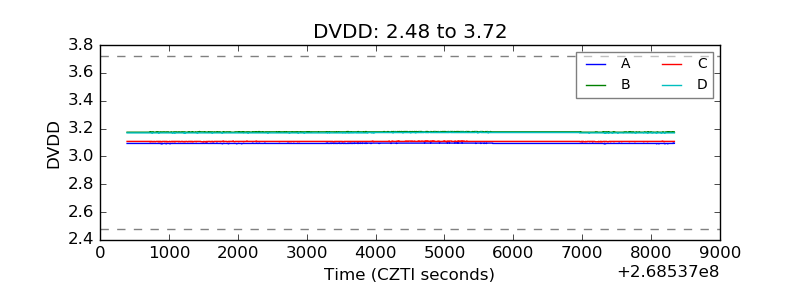 |
| Temperature 1 |  |
| Veto HV Monitor | 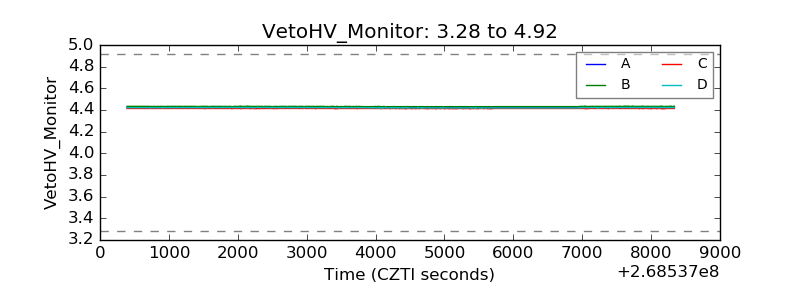 |
| Veto LLD | 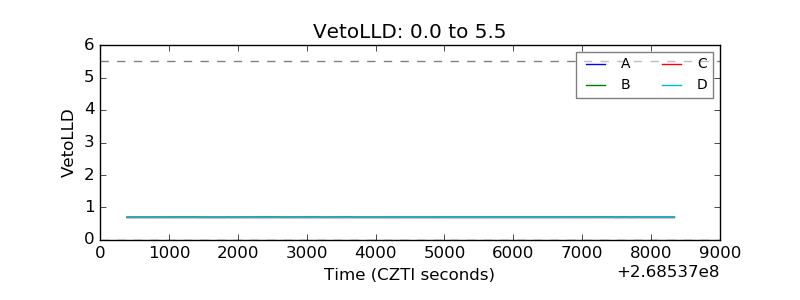 |
| Alpha Counter | 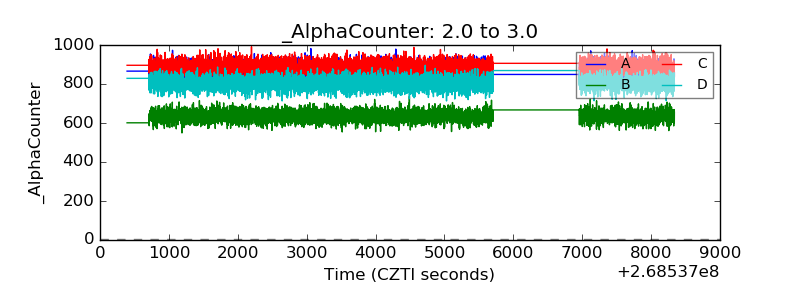 |
| _CPM_Rate | 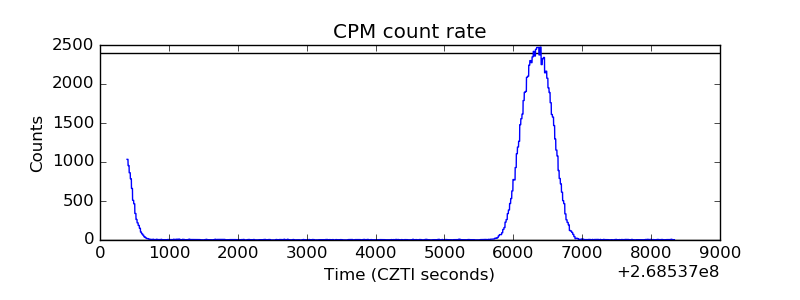 |
| CZT Counter | 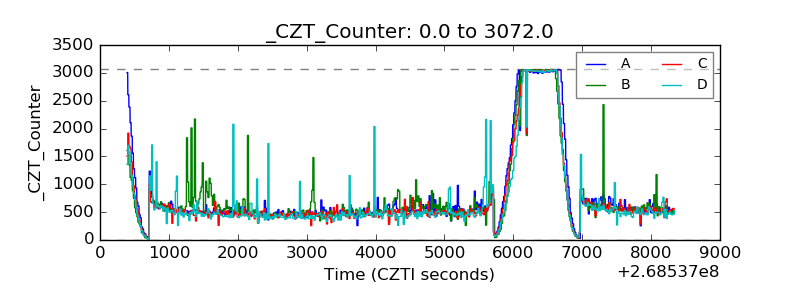 |
| +2.5 Volts monitor |  |
| +5 Volts monitor |  |
| _ROLL_ROT | 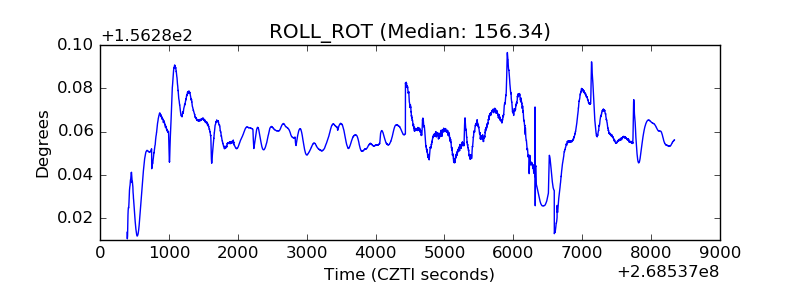 |
| _Roll_DEC |  |
| _Roll_RA | 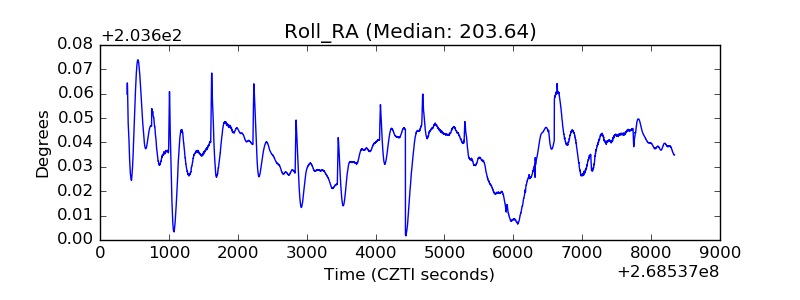 |
| Veto Counter | 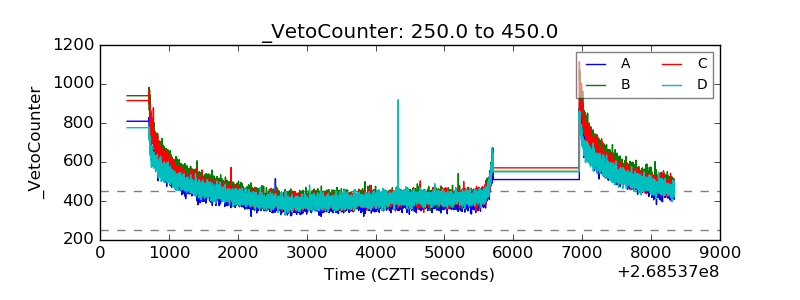 |