| Param | Original file | Final file |
|---|---|---|
| Filename | modeM0/AS1T02_056T01_9000002210_14982cztM0_level2.evt | modeM0/AS1T02_056T01_9000002210_14982cztM0_level2_quad_clean.evt |
| Size (bytes) | 505,195,200 | 91,512,000 |
| Size | 481.8 MB | 87.3 MB |
| Events in quadrant A | 3,586,683 | 598,655 |
| Events in quadrant B | 4,660,108 | 586,971 |
| Events in quadrant C | 3,288,429 | 579,579 |
| Events in quadrant D | 3,332,876 | 562,151 |
| Mode M0 | |||
|---|---|---|---|
| Quadrant | BADHDUFLAG | Total packets | Discarded packets |
| A | 0 | 14608 | 2 |
| B | 0 | 17837 | 1 |
| C | 0 | 13414 | 1 |
| D | 0 | 13966 | 1 |
| Mode M9 | |||
|---|---|---|---|
| Quadrant | BADHDUFLAG | Total packets | Discarded packets |
| A | 0 | 12 | 0 |
| B | 0 | 12 | 0 |
| C | 0 | 12 | 0 |
| D | 0 | 12 | 0 |
| Mode SS | |||
|---|---|---|---|
| Quadrant | BADHDUFLAG | Total packets | Discarded packets |
| A | 0 | 128 | 0 |
| B | 0 | 128 | 0 |
| C | 0 | 128 | 0 |
| D | 0 | 128 | 0 |
| Quadrant | Total seconds | Saturated seconds | Saturation percentage |
|---|---|---|---|
| A | 6365 | 155 | 2.435192% |
| B | 6365 | 451 | 7.085625% |
| C | 6365 | 105 | 1.649647% |
| D | 6365 | 141 | 2.215240% |
Noise dominated data is calculated using 1-second bins in cleaned event files. If a bin has >2000 counts, and if more than 50% of those come from <1% of pixels, then it is considered to be noise-dominated and hence unusable.
| Quadrant | # 1 sec bins | Bins with >0 counts | Bins with >2000 counts | High rate bins dominated by noise | Noise dominated (total time) | Noise dominated (detector-on time) | Marked lightcurve |
|---|---|---|---|---|---|---|---|
| A | 7536 | 6366 | 0 | 0 | 0.00% | 0.00% | 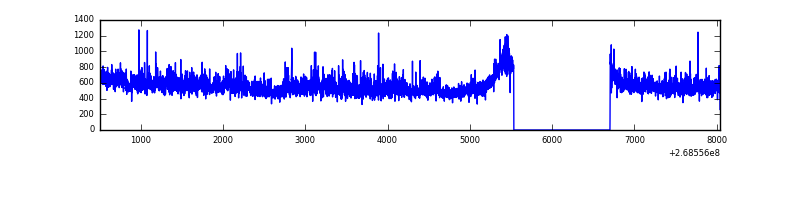 |
| B | 7536 | 6366 | 194 | 194 | 2.57% | 3.05% | 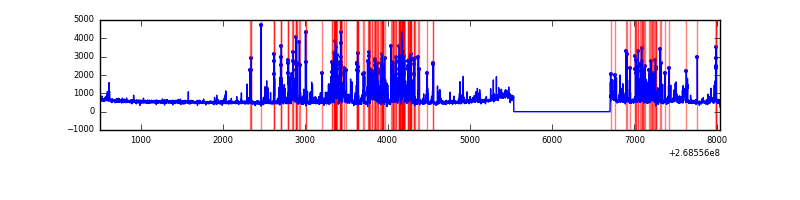 |
| C | 7536 | 6366 | 0 | 0 | 0.00% | 0.00% | 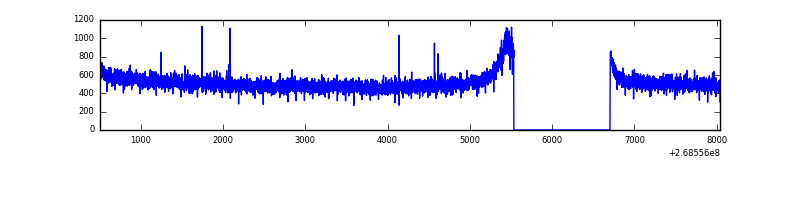 |
| D | 7536 | 6366 | 22 | 22 | 0.29% | 0.35% | 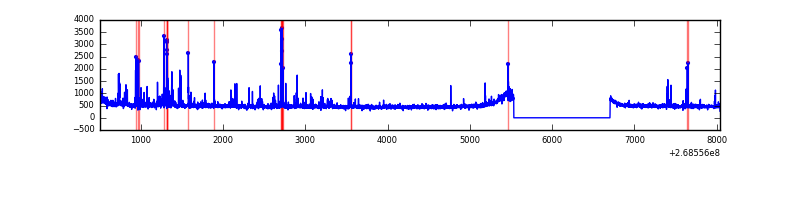 |
Top three noisy pixels from each quadrant. If the there are fewer than three noisy pixels in the level2.evt file, extra rows are filled as -1
| Pixel properties | Quadrant properties | ||||||
|---|---|---|---|---|---|---|---|
| Quadrant | DetID | PixID | Counts | Sigma | Mean | Median | Sigma |
| A | 1 | 162 | 133942 | 783.11 | 842 | 826 | 170.0 |
| A | 1 | 178 | 63160 | 366.71 | 842 | 826 | 170.0 |
| A | 1 | 161 | 54958 | 318.46 | 842 | 826 | 170.0 |
| B | 10 | 245 | 1102128 | 7096.64 | 820 | 800 | 155.2 |
| B | 3 | 64 | 106972 | 684.14 | 820 | 800 | 155.2 |
| B | 3 | 209 | 82178 | 524.38 | 820 | 800 | 155.2 |
| C | 3 | 233 | 161330 | 871.18 | 800 | 804 | 184.3 |
| C | 10 | 22 | 8482 | 41.67 | 800 | 804 | 184.3 |
| C | 13 | 61 | 5809 | 27.16 | 800 | 804 | 184.3 |
| D | 4 | 239 | 102838 | 523.05 | 808 | 786 | 195.1 |
| D | 13 | 249 | 98475 | 500.69 | 808 | 786 | 195.1 |
| D | 2 | 234 | 24829 | 123.23 | 808 | 786 | 195.1 |
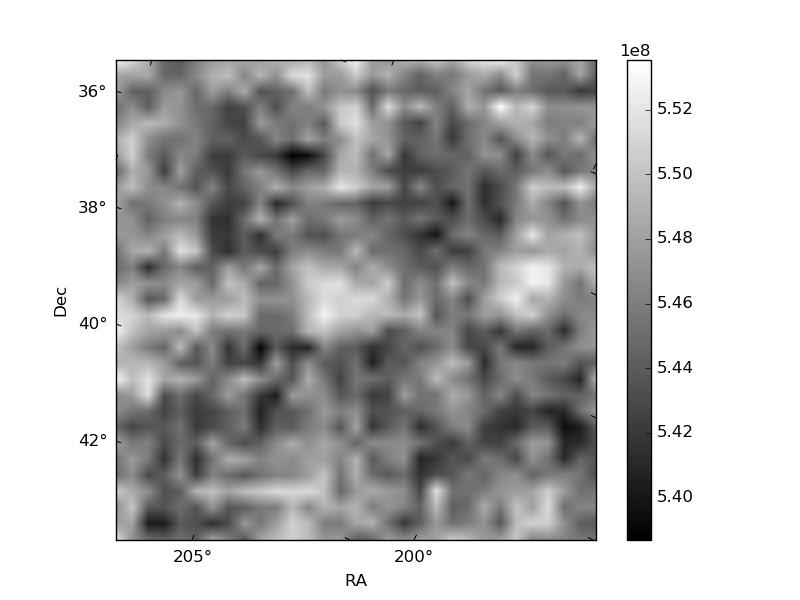
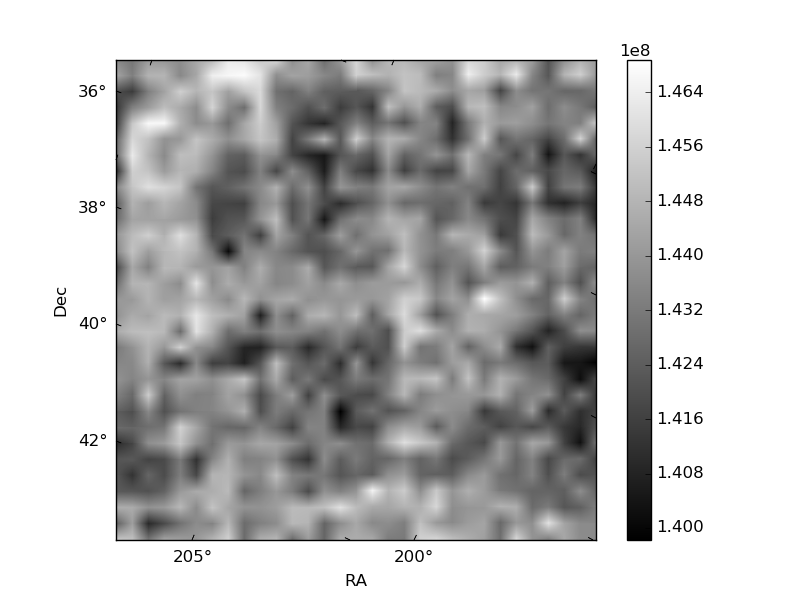
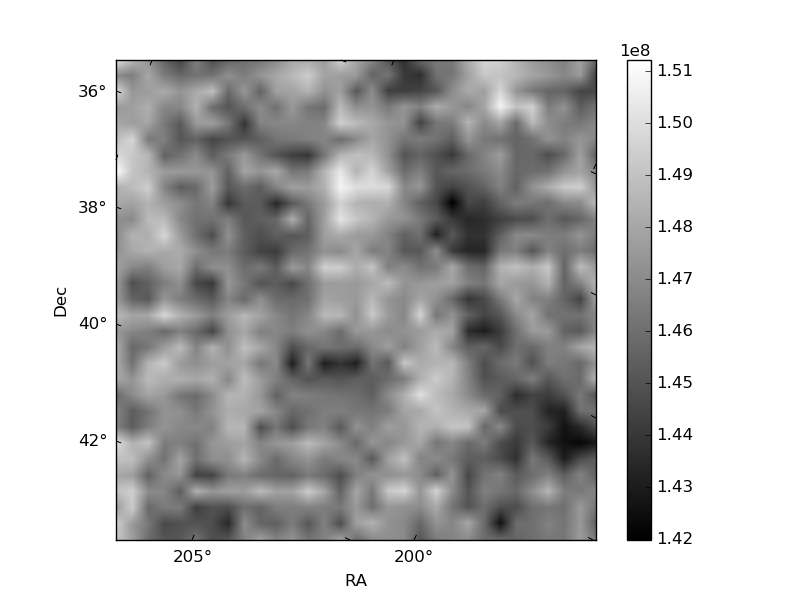
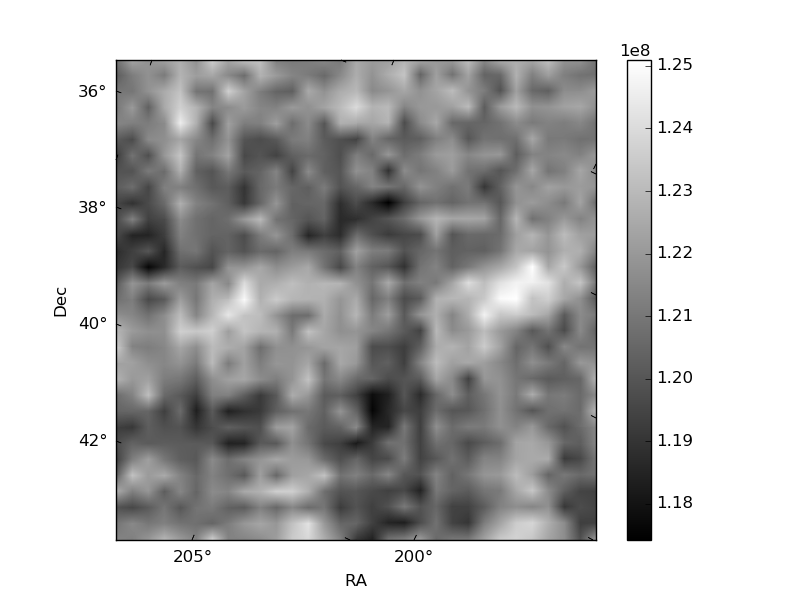
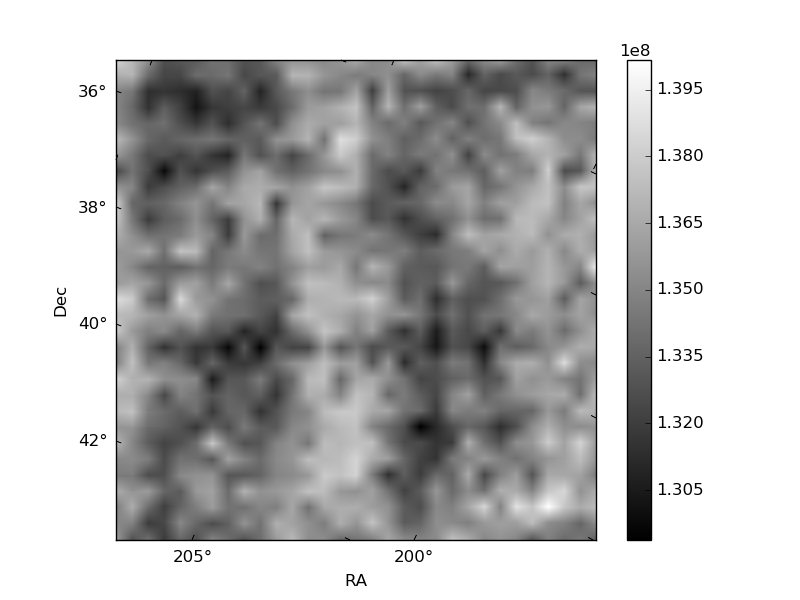
Histogram calculated using DETX and DETY for each event in the final _common_clean file
| Quadrant A | 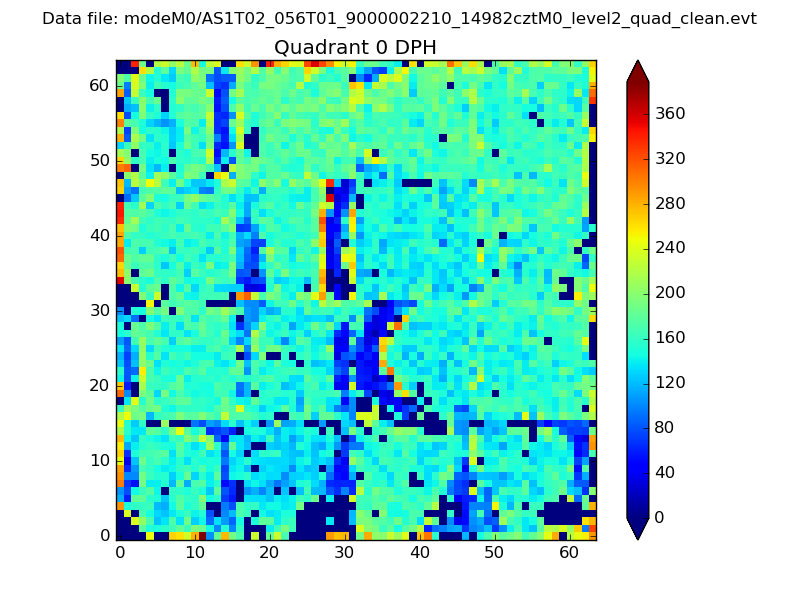 |
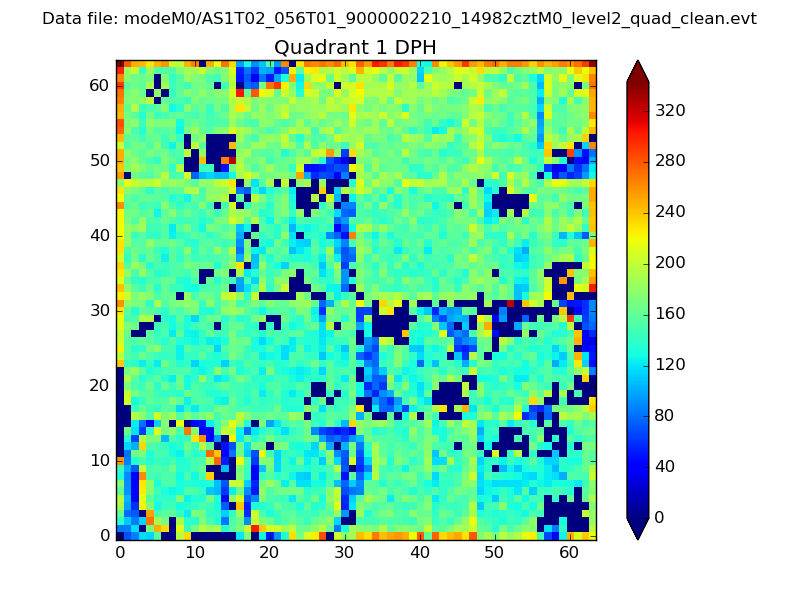 |
Quadrant B |
|---|---|---|---|
| Quadrant D | 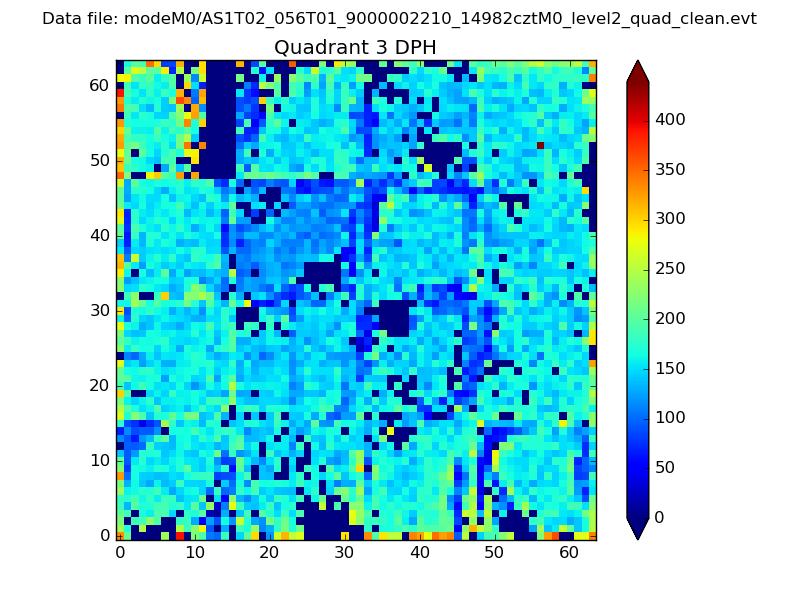 |
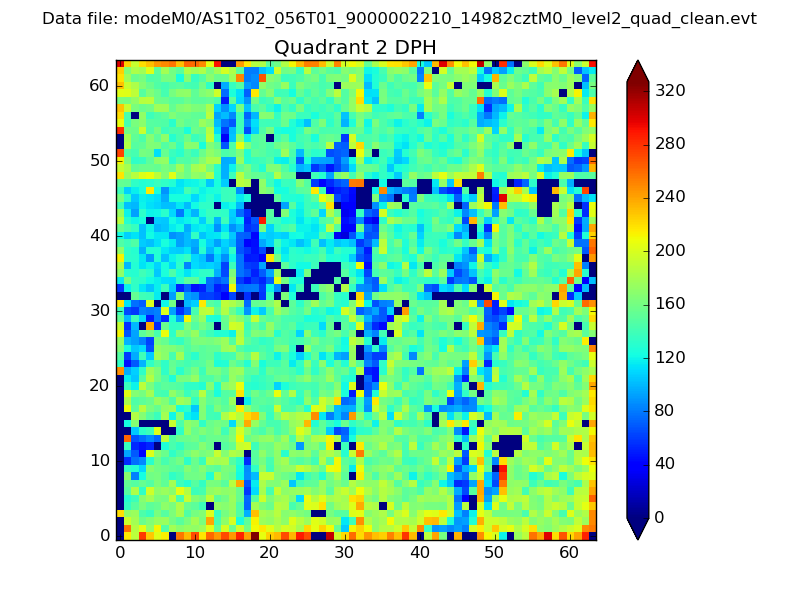 |
Quadrant C |
| Plot type | Count rate plots | Images |
|---|---|---|
| Comparison with Poisson distribution Blue bars denote a histogram of data divided into 1 sec bins. Red curve is a Poisson curve with rate = median count rate of data. |
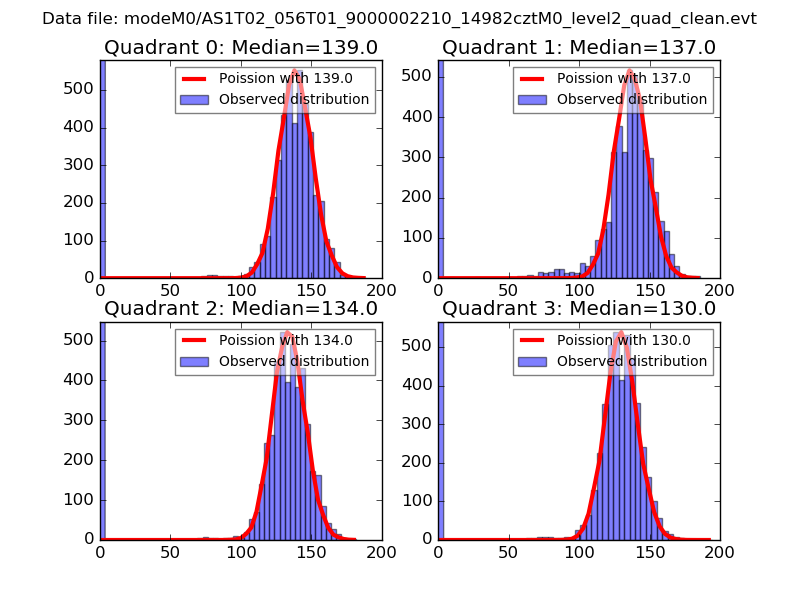 |
 |
| Quadrant-wise count rates Data is divided into 100 sec bins |
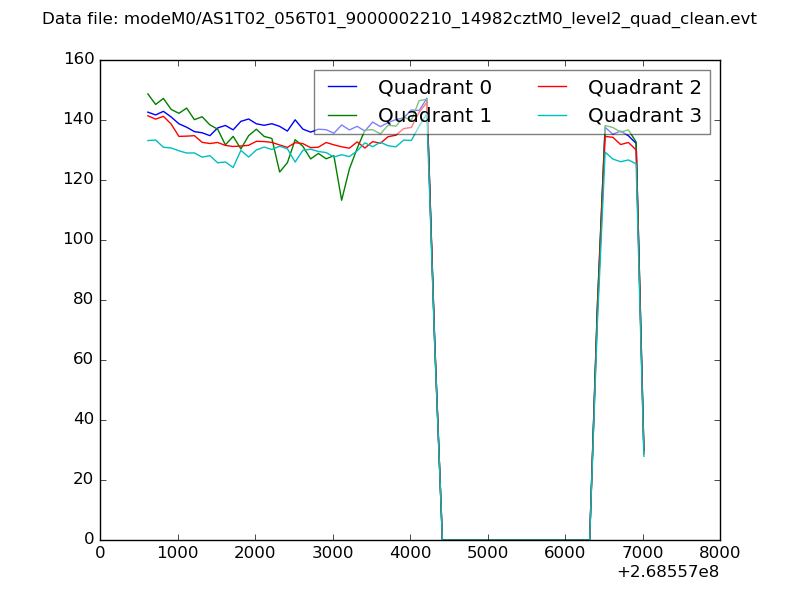 |
|
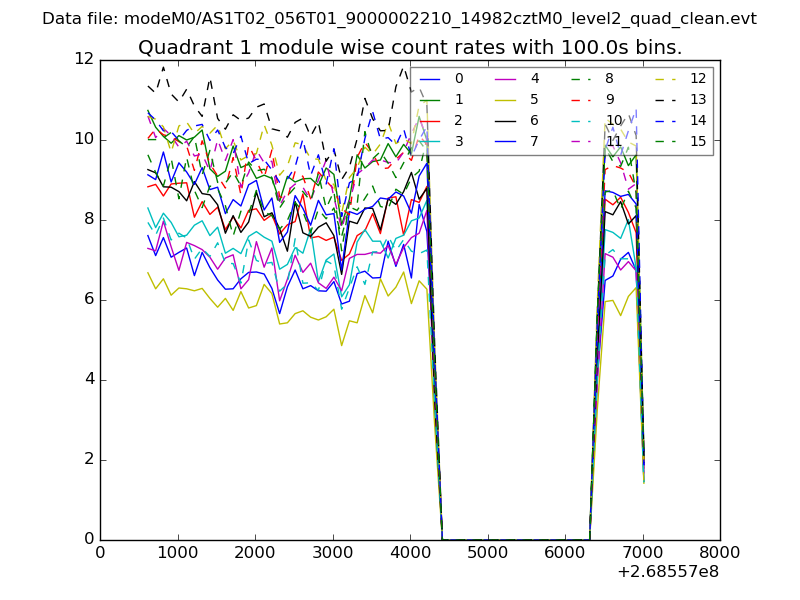
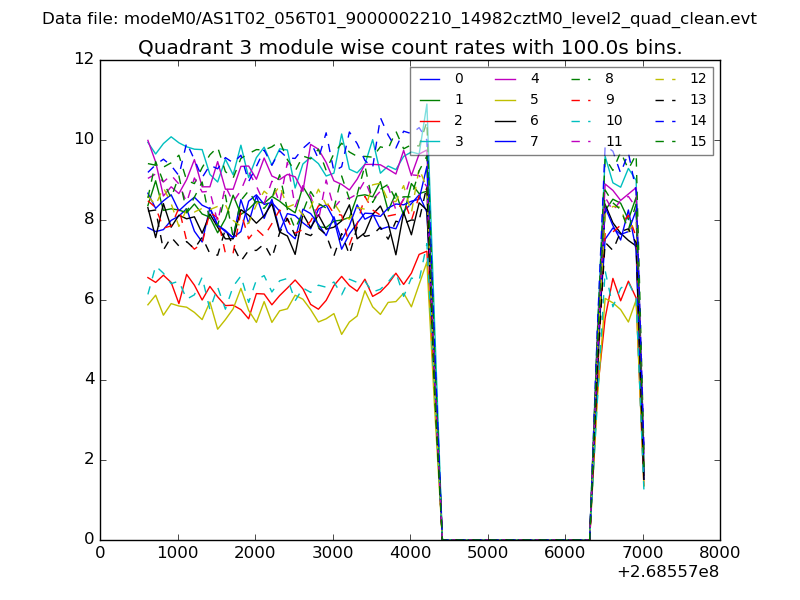
| Module-wise count rates for Quadrant A Data is divided into 100 sec bins |
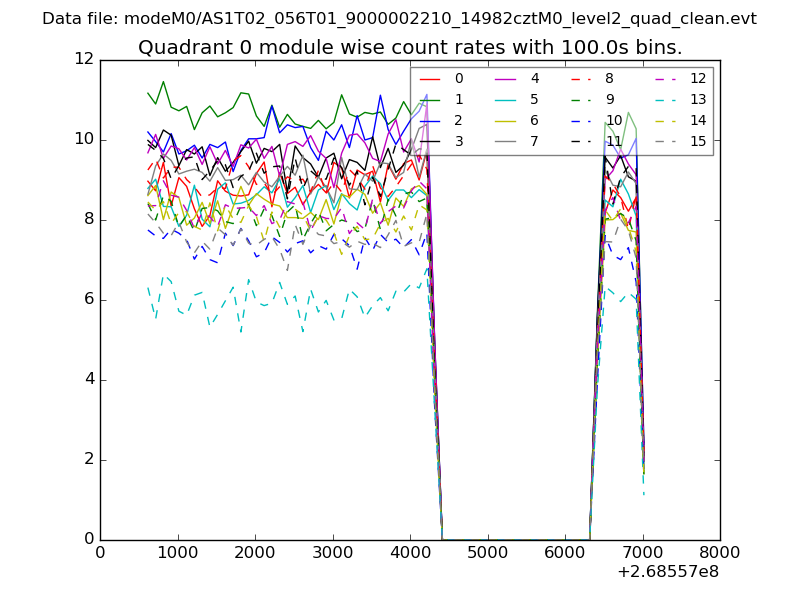 |
 |
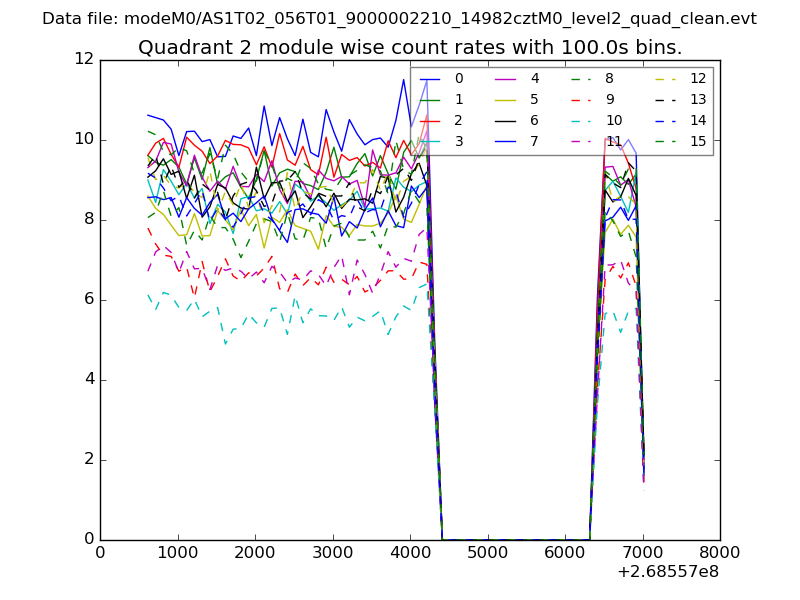
| Module-wise count rates for Quadrant B Data is divided into 100 sec bins |
 |
 |
| Module-wise count rates for Quadrant C Data is divided into 100 sec bins |
 |
 |
| Module-wise count rates for Quadrant D Data is divided into 100 sec bins |
 |
 |
| Parameter | Plot |
|---|---|
| CZT HV Monitor | 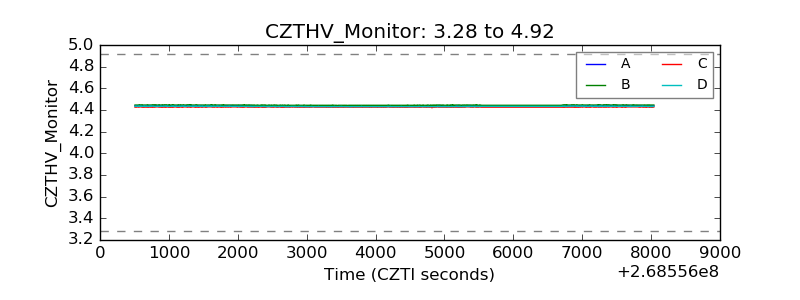 |
| D_VDD | 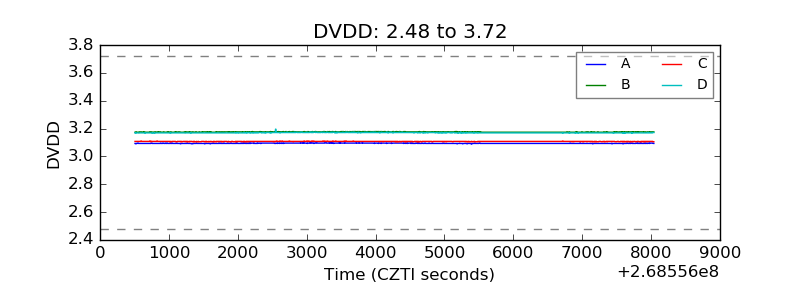 |
| Temperature 1 | 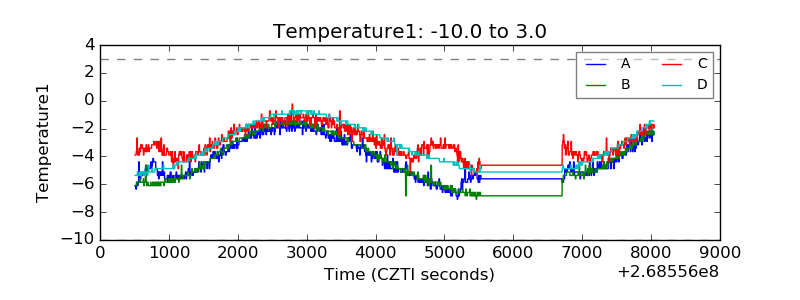 |
| Veto HV Monitor |  |
| Veto LLD | 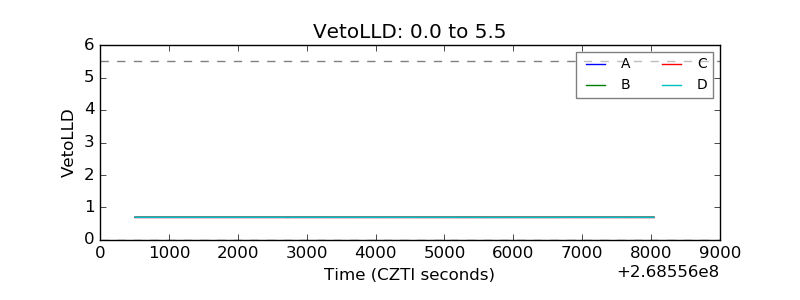 |
| Alpha Counter | 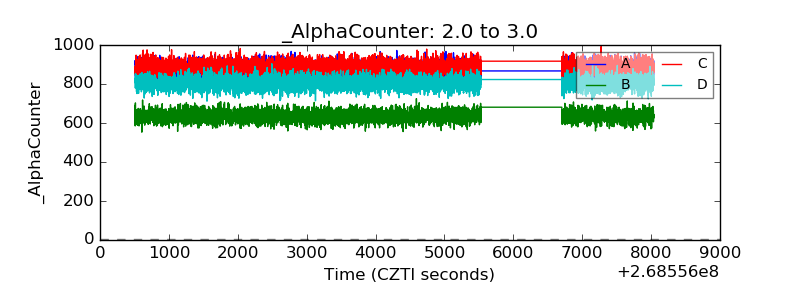 |
| _CPM_Rate | 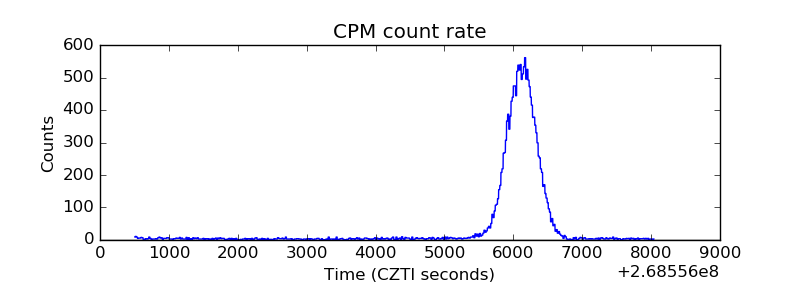 |
| CZT Counter | 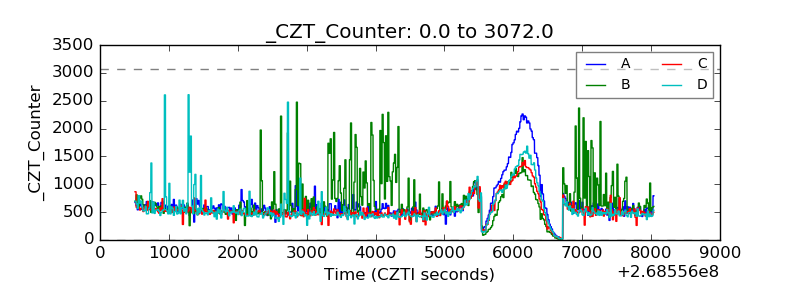 |
| +2.5 Volts monitor |  |
| +5 Volts monitor | 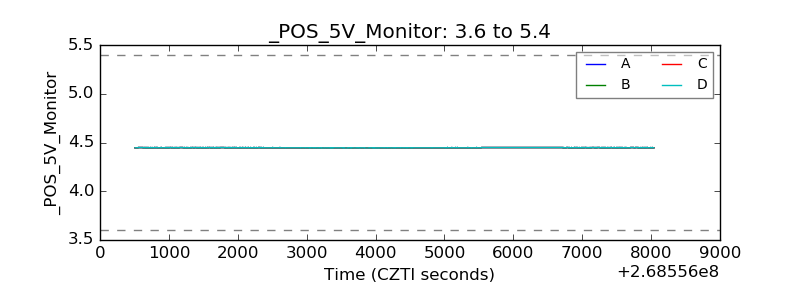 |
| _ROLL_ROT | 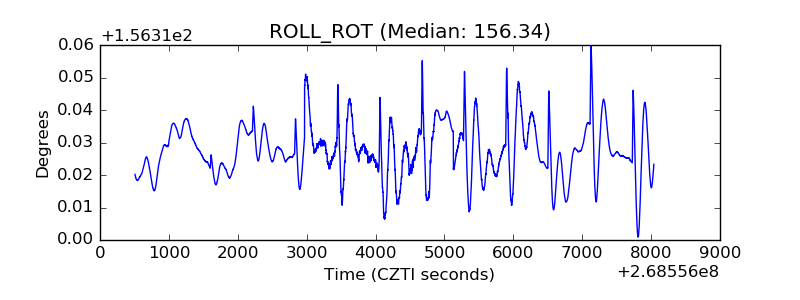 |
| _Roll_DEC | 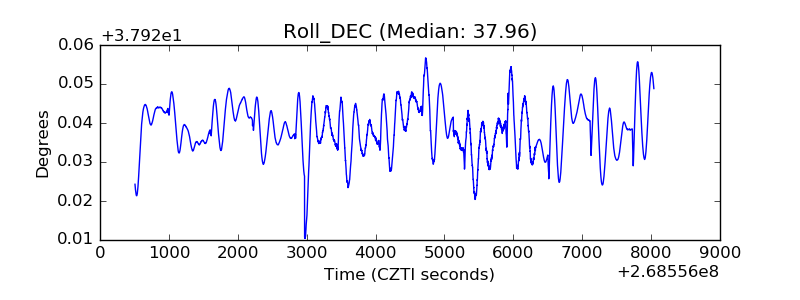 |
| _Roll_RA | 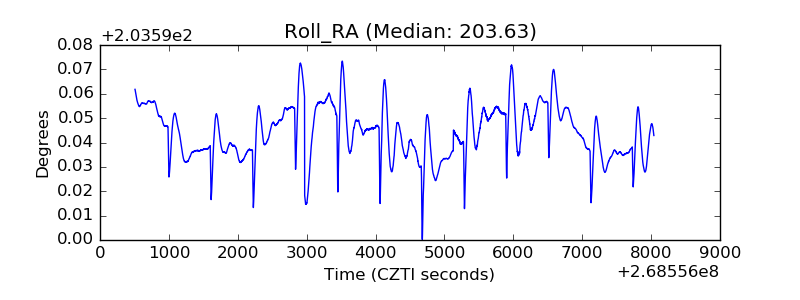 |
| Veto Counter | 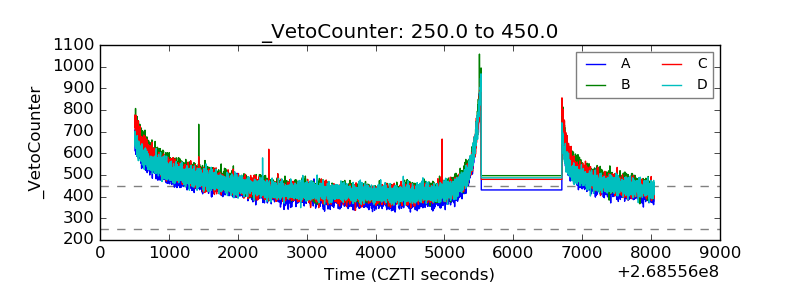 |