| Param | Original file | Final file |
|---|---|---|
| Filename | modeM0/AS1T02_056T01_9000002210_14983cztM0_level2.evt | modeM0/AS1T02_056T01_9000002210_14983cztM0_level2_quad_clean.evt |
| Size (bytes) | 543,006,720 | 95,863,680 |
| Size | 517.9 MB | 91.4 MB |
| Events in quadrant A | 3,957,676 | 621,360 |
| Events in quadrant B | 5,464,601 | 606,282 |
| Events in quadrant C | 3,313,074 | 611,542 |
| Events in quadrant D | 3,254,187 | 595,837 |
| Mode M0 | |||
|---|---|---|---|
| Quadrant | BADHDUFLAG | Total packets | Discarded packets |
| A | 0 | 15721 | 3 |
| B | 0 | 20564 | 2 |
| C | 0 | 13865 | 2 |
| D | 0 | 14174 | 2 |
| Mode M9 | |||
|---|---|---|---|
| Quadrant | BADHDUFLAG | Total packets | Discarded packets |
| A | 0 | 13 | 0 |
| B | 0 | 13 | 0 |
| C | 0 | 13 | 0 |
| D | 0 | 14 | 0 |
| Mode SS | |||
|---|---|---|---|
| Quadrant | BADHDUFLAG | Total packets | Discarded packets |
| A | 0 | 136 | 0 |
| B | 0 | 136 | 0 |
| C | 0 | 136 | 0 |
| D | 0 | 136 | 0 |
| Quadrant | Total seconds | Saturated seconds | Saturation percentage |
|---|---|---|---|
| A | 6715 | 257 | 3.827252% |
| B | 6715 | 618 | 9.203276% |
| C | 6715 | 82 | 1.221147% |
| D | 6715 | 118 | 1.757260% |
Noise dominated data is calculated using 1-second bins in cleaned event files. If a bin has >2000 counts, and if more than 50% of those come from <1% of pixels, then it is considered to be noise-dominated and hence unusable.
| Quadrant | # 1 sec bins | Bins with >0 counts | Bins with >2000 counts | High rate bins dominated by noise | Noise dominated (total time) | Noise dominated (detector-on time) | Marked lightcurve |
|---|---|---|---|---|---|---|---|
| A | 7646 | 6716 | 113 | 113 | 1.48% | 1.68% | 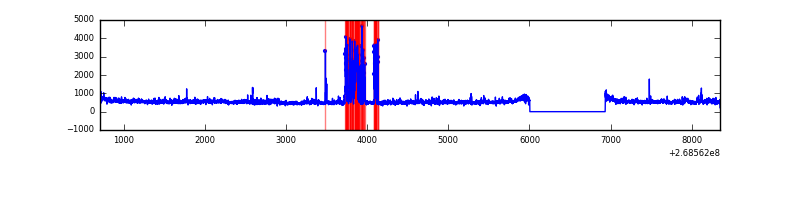 |
| B | 7646 | 6716 | 363 | 363 | 4.75% | 5.41% | 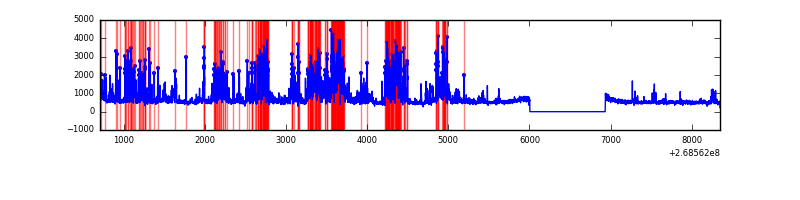 |
| C | 7646 | 6717 | 0 | 0 | 0.00% | 0.00% | 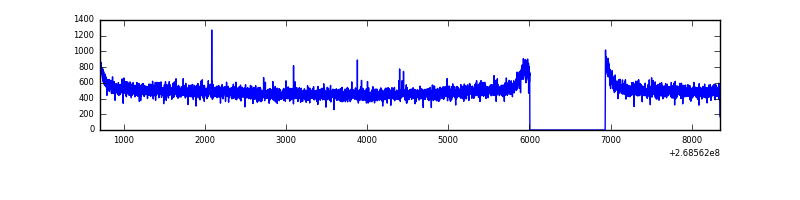 |
| D | 7646 | 6717 | 16 | 16 | 0.21% | 0.24% | 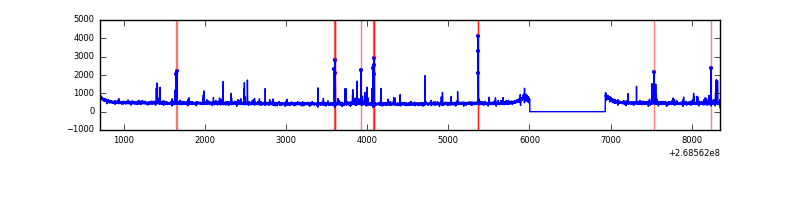 |
Top three noisy pixels from each quadrant. If the there are fewer than three noisy pixels in the level2.evt file, extra rows are filled as -1
| Pixel properties | Quadrant properties | ||||||
|---|---|---|---|---|---|---|---|
| Quadrant | DetID | PixID | Counts | Sigma | Mean | Median | Sigma |
| A | 13 | 248 | 408872 | 2400.93 | 838 | 819 | 170.0 |
| A | 1 | 162 | 121867 | 712.23 | 838 | 819 | 170.0 |
| A | 12 | 189 | 67954 | 395.01 | 838 | 819 | 170.0 |
| B | 10 | 245 | 1505607 | 9569.1 | 821 | 800 | 157.3 |
| B | 3 | 64 | 393622 | 2497.96 | 821 | 800 | 157.3 |
| B | 10 | 16 | 144878 | 916.2 | 821 | 800 | 157.3 |
| C | 3 | 233 | 157829 | 845.25 | 808 | 813 | 185.8 |
| C | 13 | 61 | 5755 | 26.6 | 808 | 813 | 185.8 |
| C | 10 | 22 | 5122 | 23.19 | 808 | 813 | 185.8 |
| D | 7 | 38 | 59467 | 299.71 | 814 | 792 | 195.8 |
| D | 13 | 249 | 55637 | 280.14 | 814 | 792 | 195.8 |
| D | 2 | 234 | 25603 | 126.73 | 814 | 792 | 195.8 |
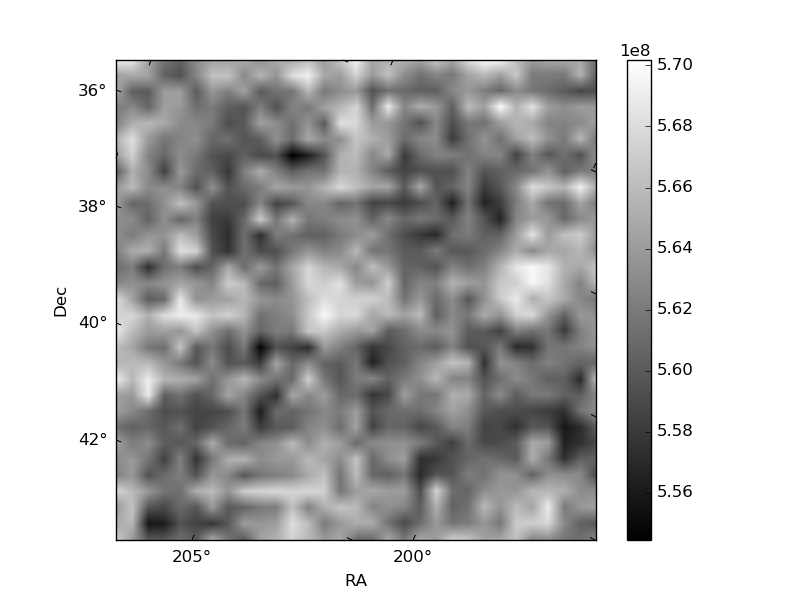
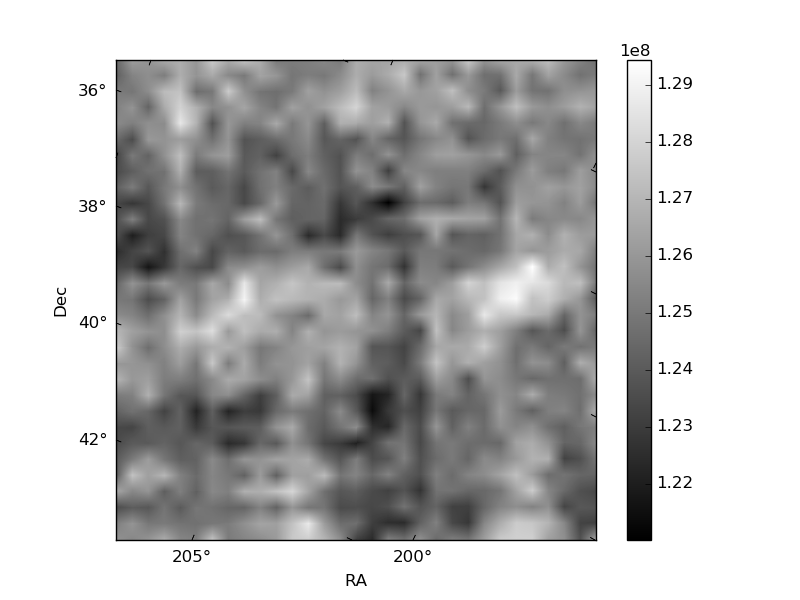
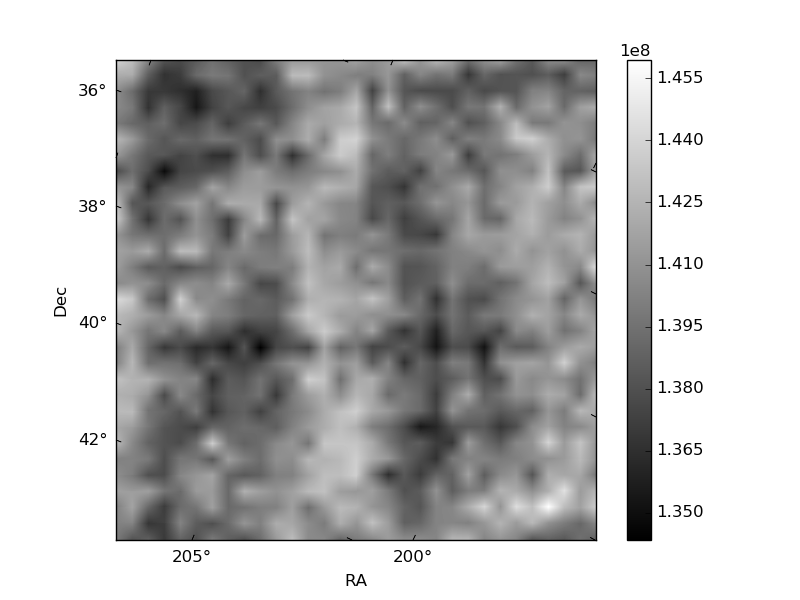
Histogram calculated using DETX and DETY for each event in the final _common_clean file
| Quadrant A | 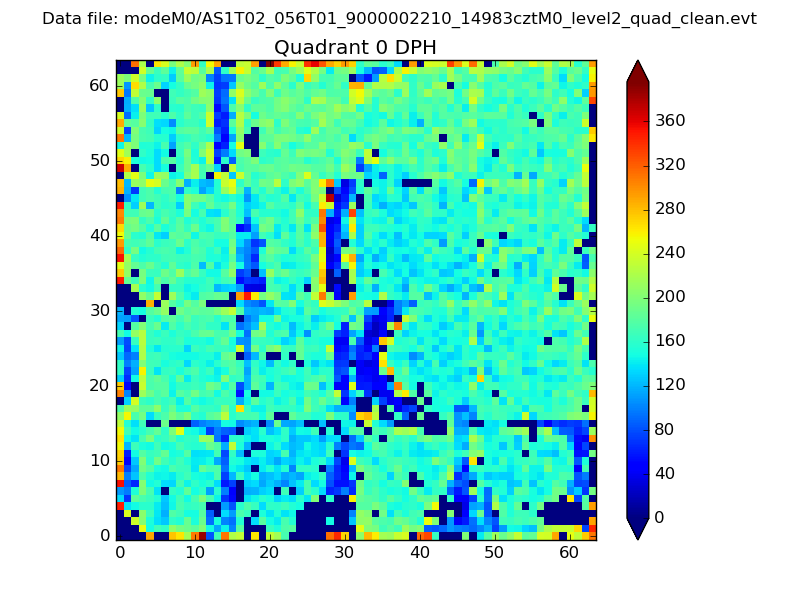 |
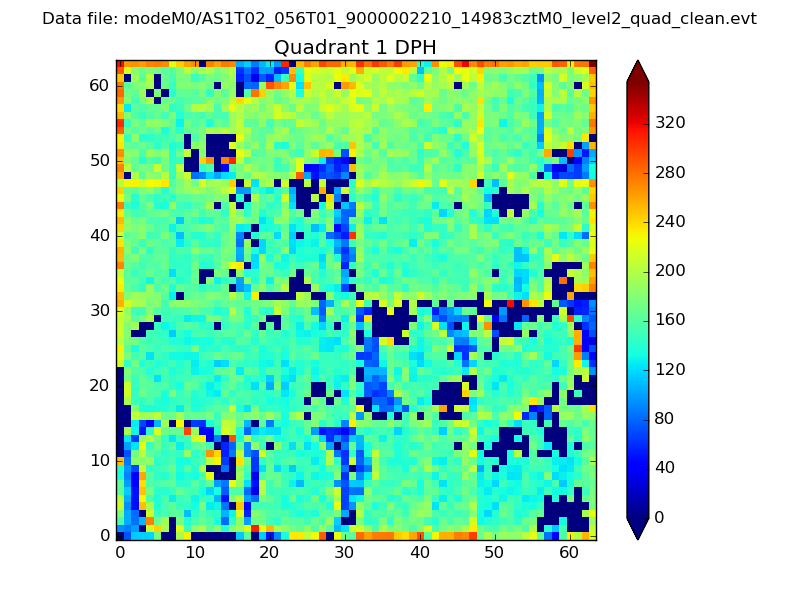 |
Quadrant B |
|---|---|---|---|
| Quadrant D | 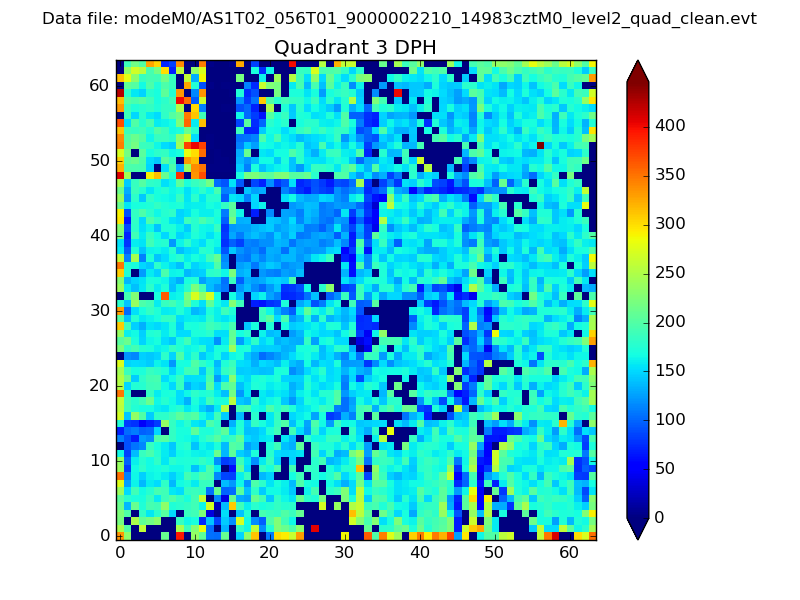 |
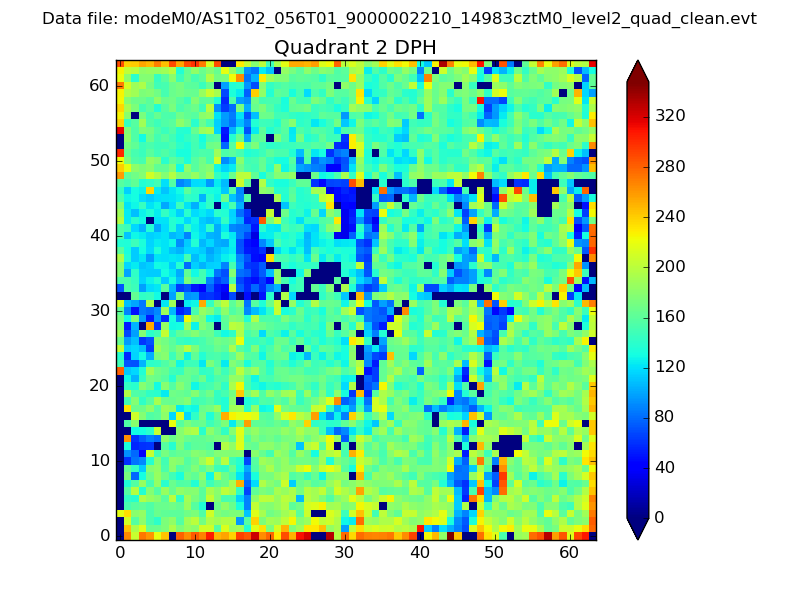 |
Quadrant C |
| Plot type | Count rate plots | Images |
|---|---|---|
| Comparison with Poisson distribution Blue bars denote a histogram of data divided into 1 sec bins. Red curve is a Poisson curve with rate = median count rate of data. |
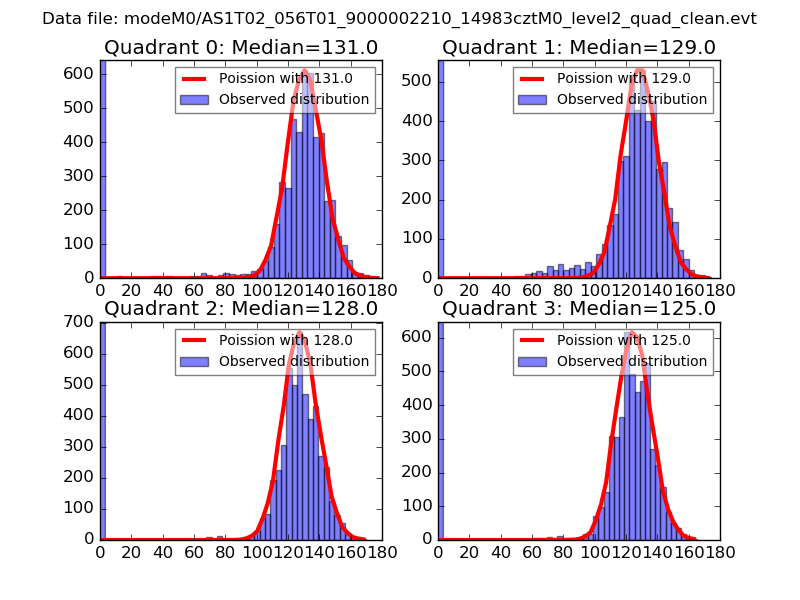 |
 |
| Quadrant-wise count rates Data is divided into 100 sec bins |
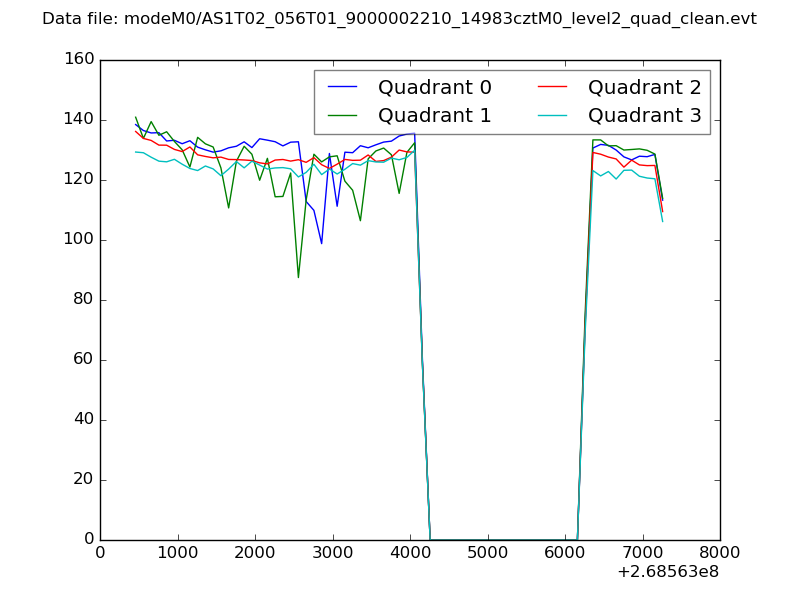 |
|
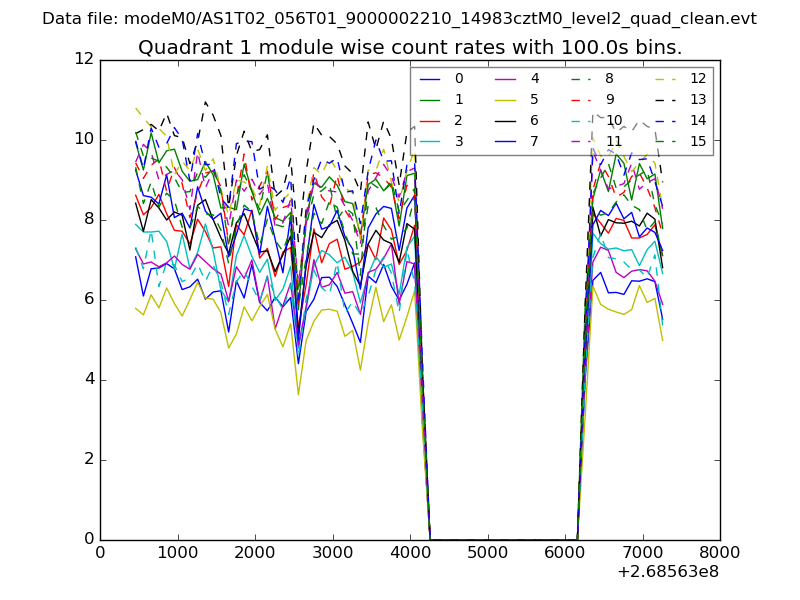
| Module-wise count rates for Quadrant A Data is divided into 100 sec bins |
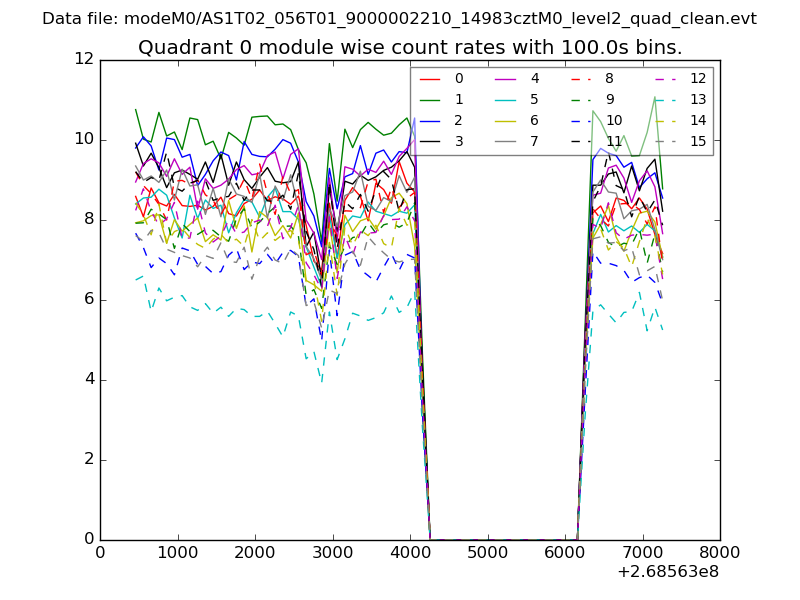 |
 |
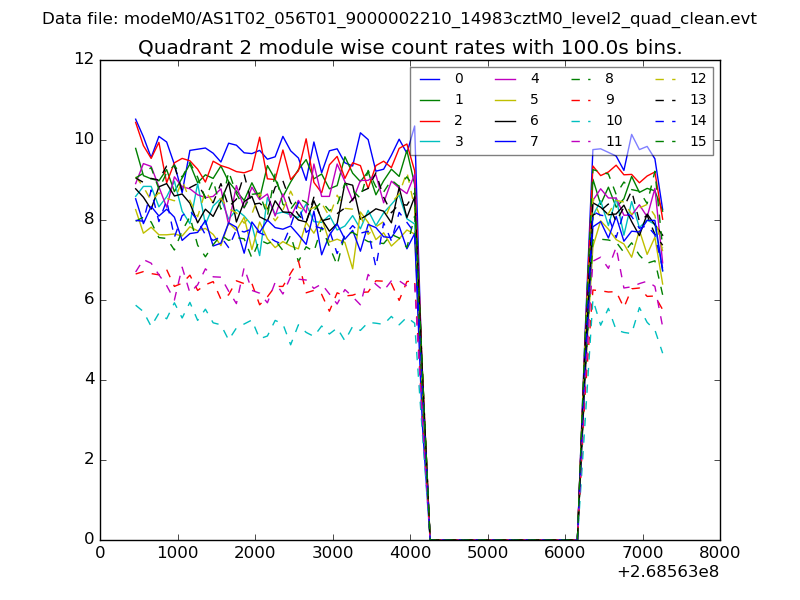
| Module-wise count rates for Quadrant B Data is divided into 100 sec bins |
 |
 |
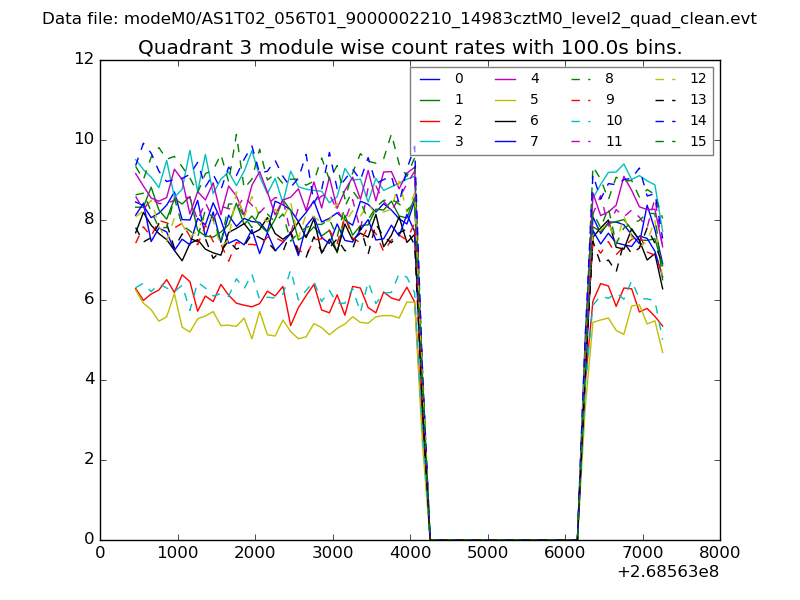
| Module-wise count rates for Quadrant C Data is divided into 100 sec bins |
 |
 |
| Module-wise count rates for Quadrant D Data is divided into 100 sec bins |
 |
 |
| Parameter | Plot |
|---|---|
| CZT HV Monitor | 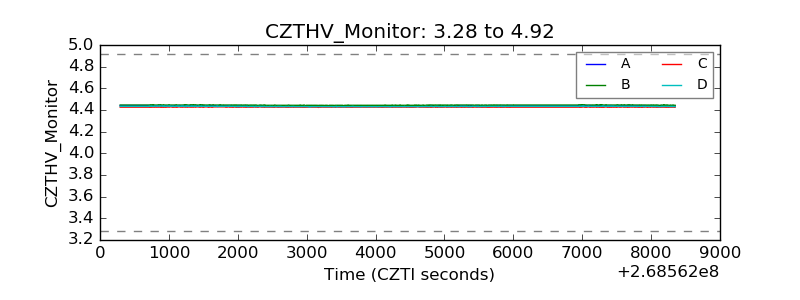 |
| D_VDD |  |
| Temperature 1 |  |
| Veto HV Monitor | 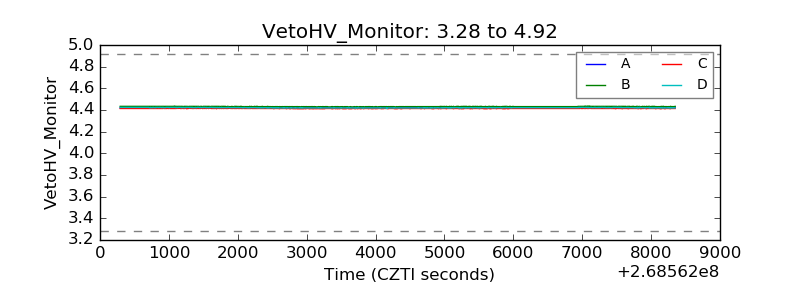 |
| Veto LLD | 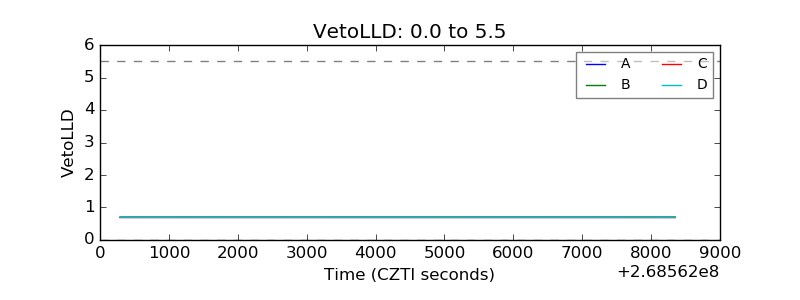 |
| Alpha Counter | 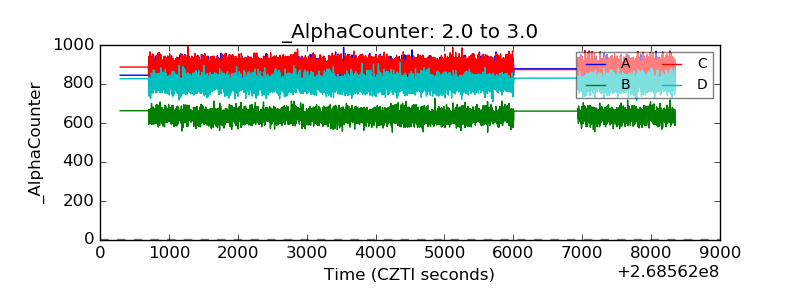 |
| _CPM_Rate | 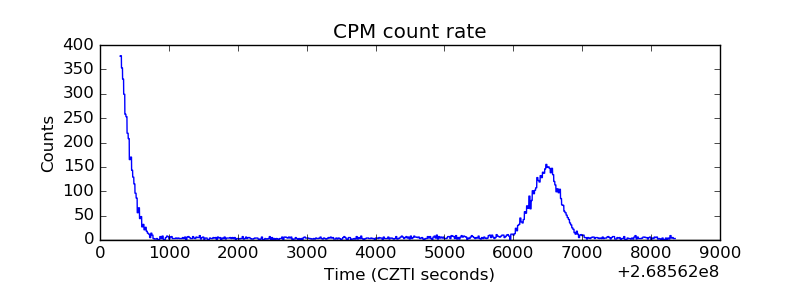 |
| CZT Counter | 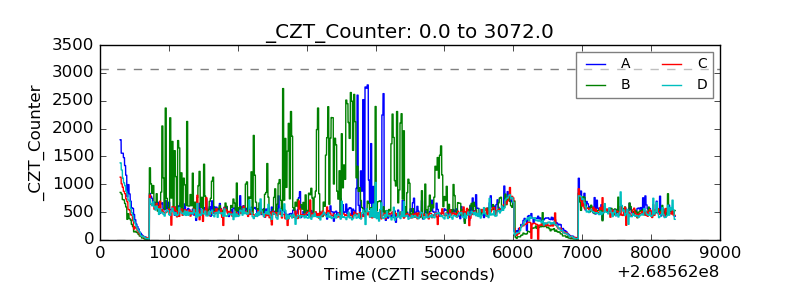 |
| +2.5 Volts monitor |  |
| +5 Volts monitor |  |
| _ROLL_ROT | 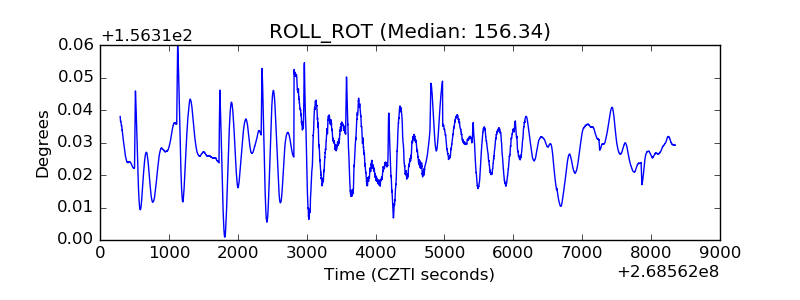 |
| _Roll_DEC | 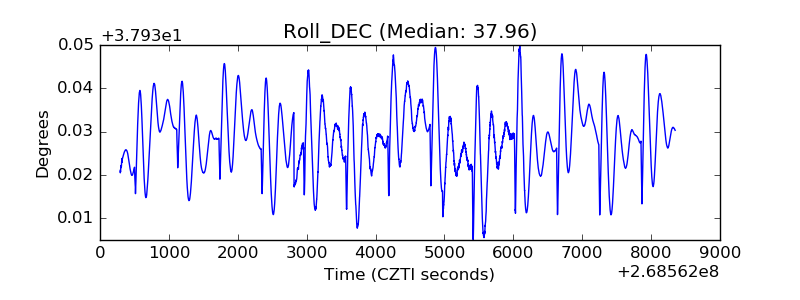 |
| _Roll_RA | 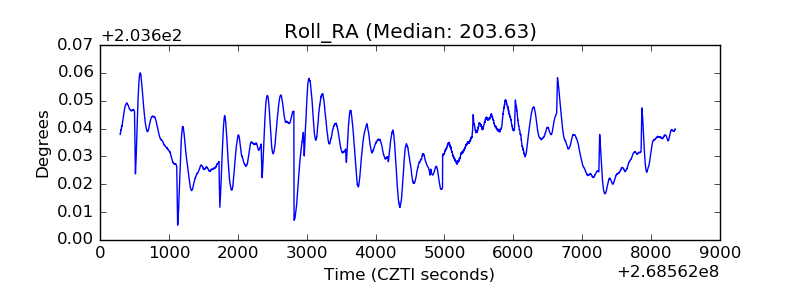 |
| Veto Counter | 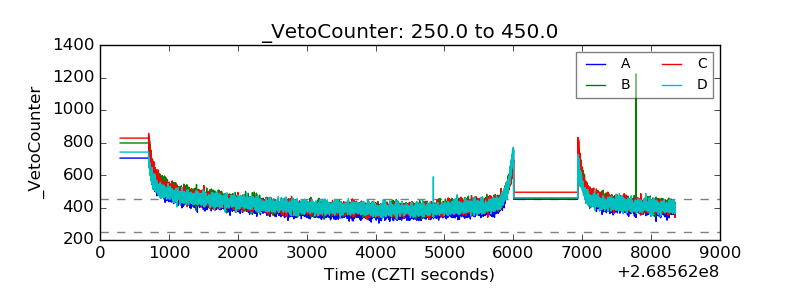 |