| Param | Original file | Final file |
|---|---|---|
| Filename | modeM0/AS1T02_056T01_9000002210_14984cztM0_level2.evt | modeM0/AS1T02_056T01_9000002210_14984cztM0_level2_quad_clean.evt |
| Size (bytes) | 497,427,840 | 101,759,040 |
| Size | 474.4 MB | 97.0 MB |
| Events in quadrant A | 3,623,670 | 664,533 |
| Events in quadrant B | 4,232,303 | 660,549 |
| Events in quadrant C | 3,355,632 | 650,367 |
| Events in quadrant D | 3,389,975 | 631,126 |
| Mode M0 | |||
|---|---|---|---|
| Quadrant | BADHDUFLAG | Total packets | Discarded packets |
| A | 0 | 14855 | 2 |
| B | 0 | 16789 | 1 |
| C | 0 | 14081 | 1 |
| D | 0 | 14832 | 1 |
| Mode M9 | |||
|---|---|---|---|
| Quadrant | BADHDUFLAG | Total packets | Discarded packets |
| A | 0 | 6 | 0 |
| B | 0 | 6 | 0 |
| C | 0 | 6 | 0 |
| D | 0 | 6 | 0 |
| Mode SS | |||
|---|---|---|---|
| Quadrant | BADHDUFLAG | Total packets | Discarded packets |
| A | 0 | 138 | 0 |
| B | 0 | 138 | 0 |
| C | 0 | 138 | 0 |
| D | 0 | 138 | 0 |
| Quadrant | Total seconds | Saturated seconds | Saturation percentage |
|---|---|---|---|
| A | 6820 | 148 | 2.170088% |
| B | 6820 | 229 | 3.357771% |
| C | 6820 | 78 | 1.143695% |
| D | 6820 | 148 | 2.170088% |
Noise dominated data is calculated using 1-second bins in cleaned event files. If a bin has >2000 counts, and if more than 50% of those come from <1% of pixels, then it is considered to be noise-dominated and hence unusable.
| Quadrant | # 1 sec bins | Bins with >0 counts | Bins with >2000 counts | High rate bins dominated by noise | Noise dominated (total time) | Noise dominated (detector-on time) | Marked lightcurve |
|---|---|---|---|---|---|---|---|
| A | 7351 | 6822 | 16 | 16 | 0.22% | 0.23% | 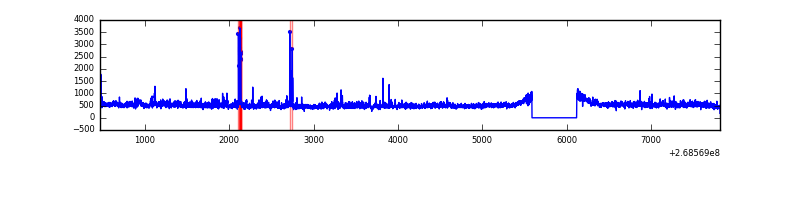 |
| B | 7351 | 6822 | 106 | 106 | 1.44% | 1.55% | 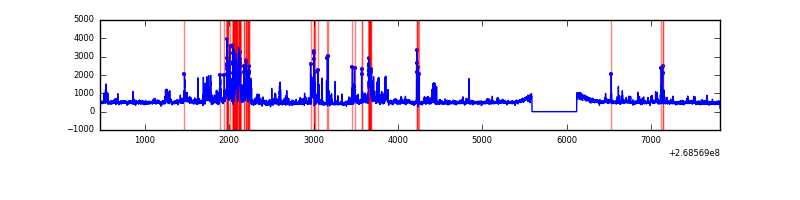 |
| C | 7351 | 6822 | 0 | 0 | 0.00% | 0.00% | 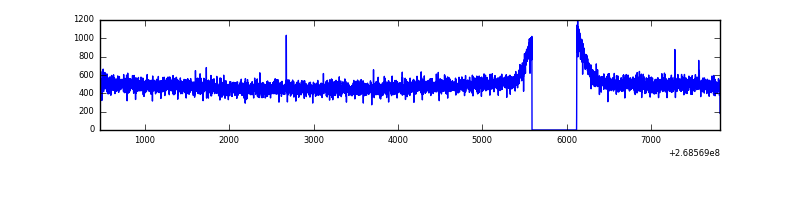 |
| D | 7351 | 6822 | 48 | 48 | 0.65% | 0.70% | 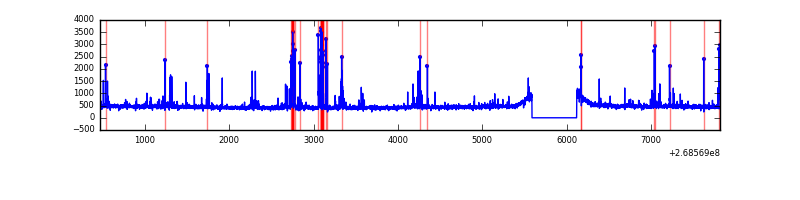 |
Top three noisy pixels from each quadrant. If the there are fewer than three noisy pixels in the level2.evt file, extra rows are filled as -1
| Pixel properties | Quadrant properties | ||||||
|---|---|---|---|---|---|---|---|
| Quadrant | DetID | PixID | Counts | Sigma | Mean | Median | Sigma |
| A | 1 | 162 | 123243 | 721.42 | 830 | 811 | 169.7 |
| A | 12 | 189 | 87548 | 511.09 | 830 | 811 | 169.7 |
| A | 13 | 248 | 73875 | 430.53 | 830 | 811 | 169.7 |
| B | 10 | 245 | 481353 | 3096.19 | 818 | 798 | 155.2 |
| B | 10 | 16 | 191761 | 1230.37 | 818 | 798 | 155.2 |
| B | 3 | 64 | 179058 | 1148.52 | 818 | 798 | 155.2 |
| C | 3 | 233 | 231588 | 1237.26 | 801 | 806 | 186.5 |
| C | 13 | 61 | 5914 | 27.38 | 801 | 806 | 186.5 |
| C | 8 | 222 | 2014 | 6.48 | 801 | 806 | 186.5 |
| D | 7 | 38 | 159697 | 805.67 | 806 | 782 | 197.2 |
| D | 13 | 249 | 59778 | 299.1 | 806 | 782 | 197.2 |
| D | 15 | 0 | 39850 | 198.07 | 806 | 782 | 197.2 |
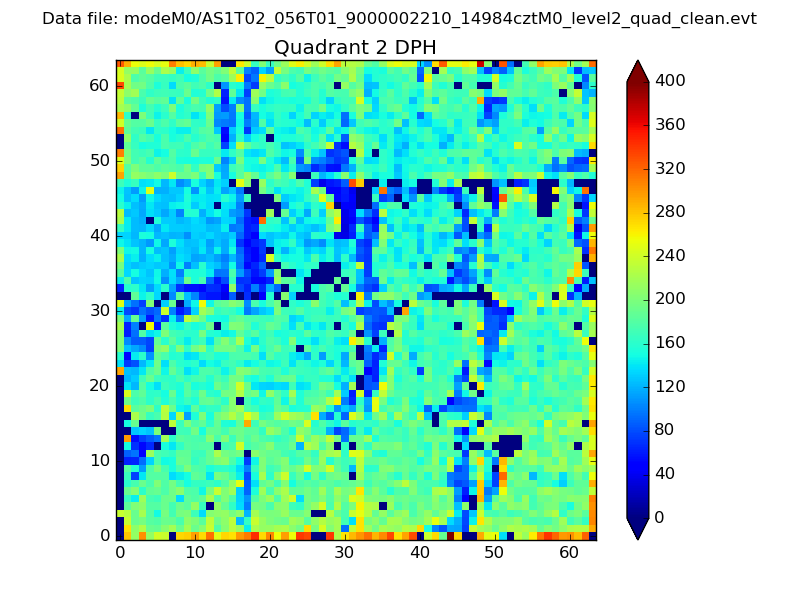
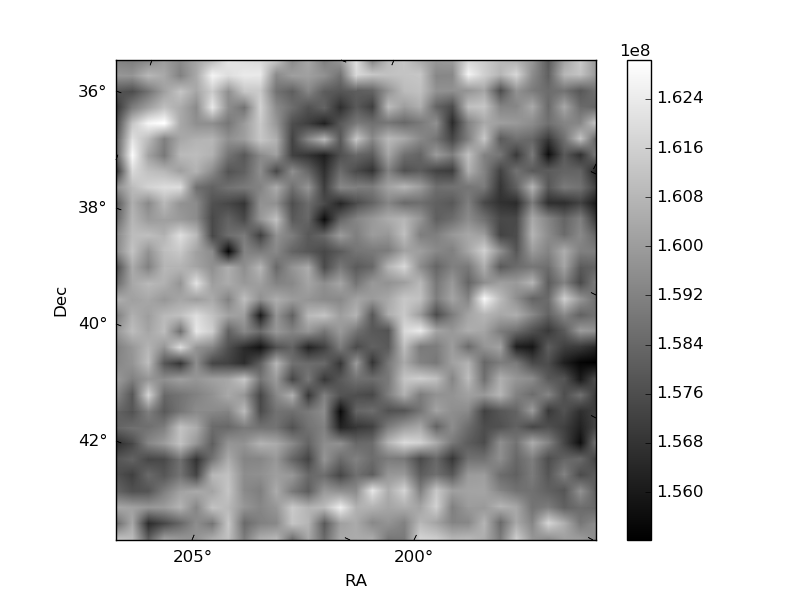
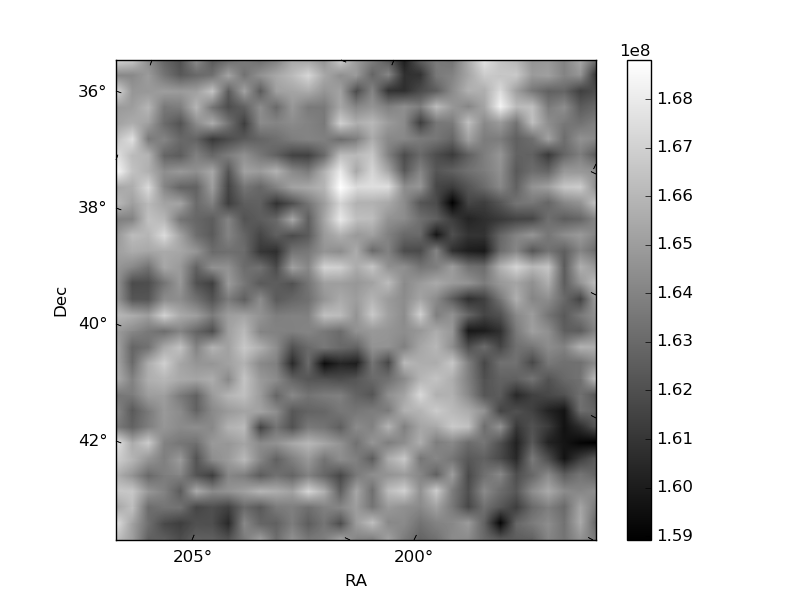
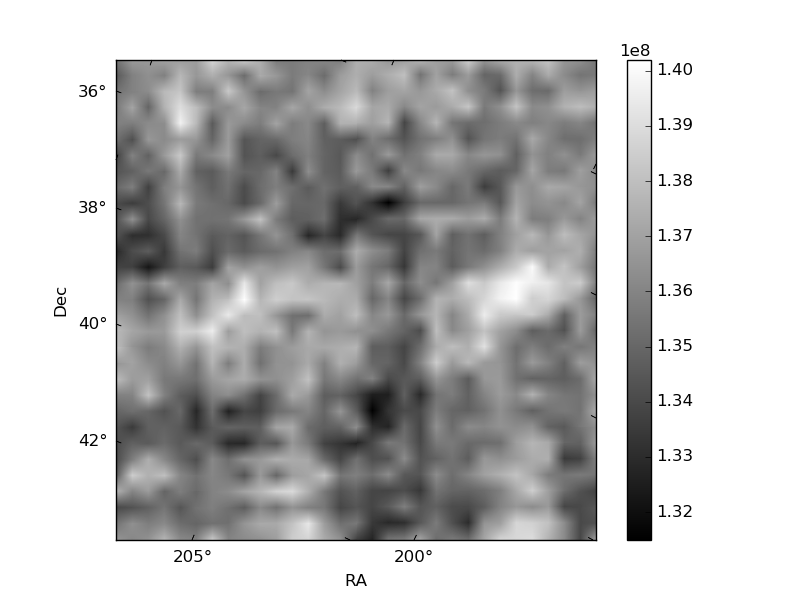
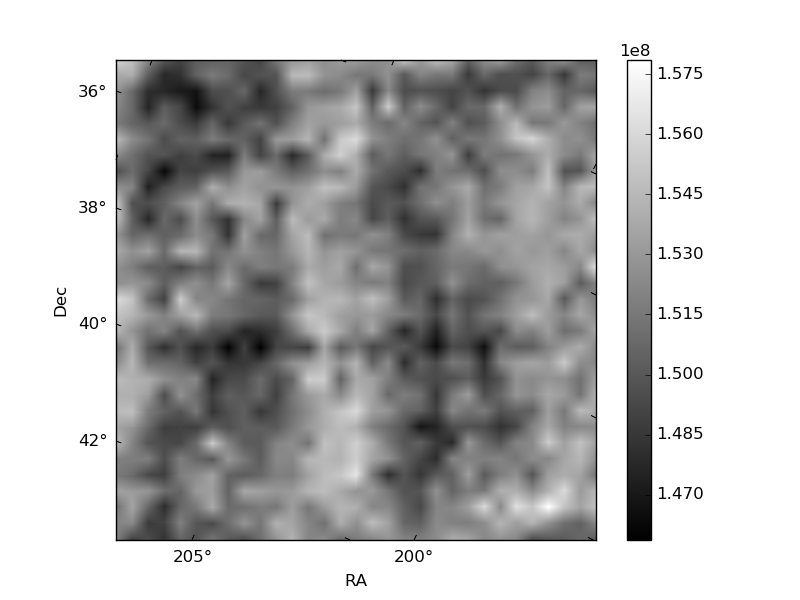
Histogram calculated using DETX and DETY for each event in the final _common_clean file
| Quadrant A | 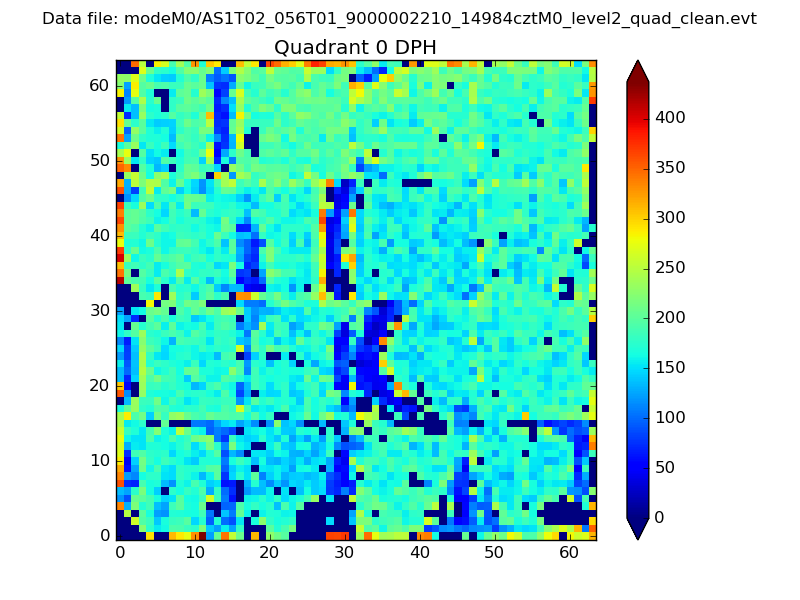 |
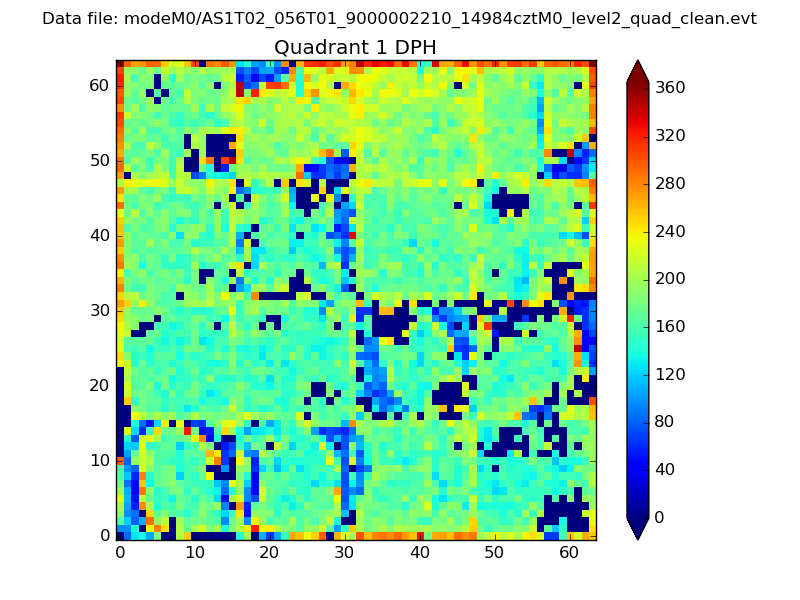 |
Quadrant B |
|---|---|---|---|
| Quadrant D | 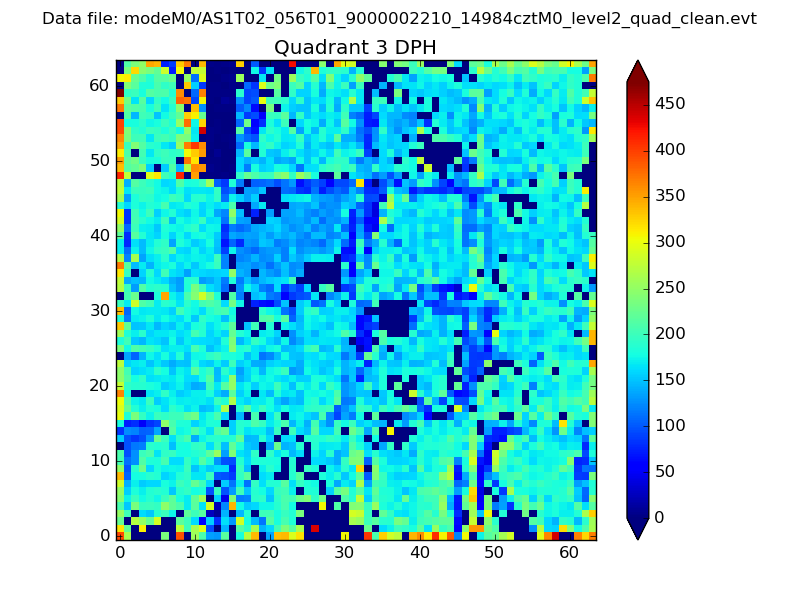 |
 |
Quadrant C |
| Plot type | Count rate plots | Images |
|---|---|---|
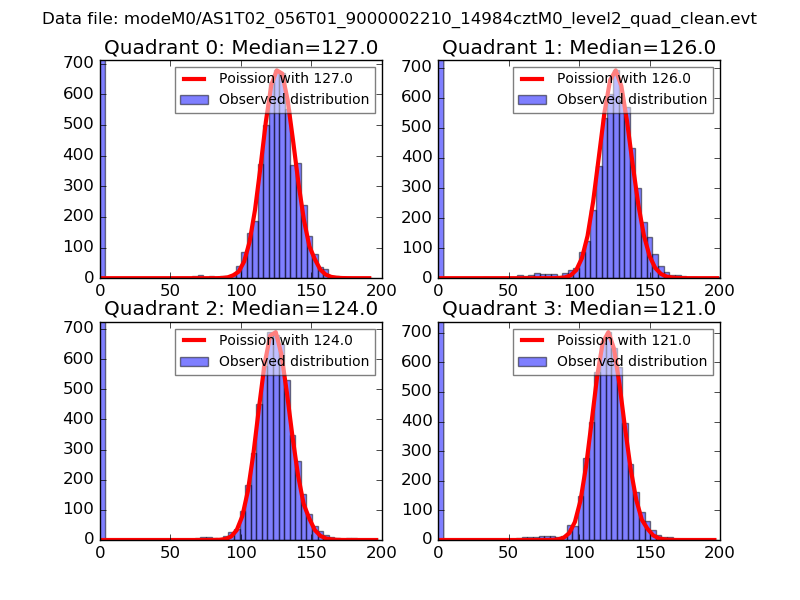
| Comparison with Poisson distribution Blue bars denote a histogram of data divided into 1 sec bins. Red curve is a Poisson curve with rate = median count rate of data. |
 |
 |
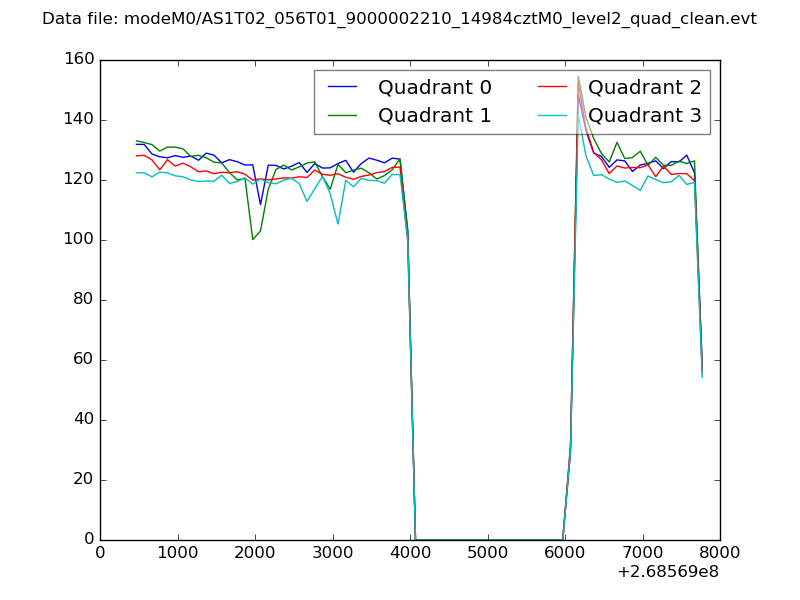
| Quadrant-wise count rates Data is divided into 100 sec bins |
 |
|
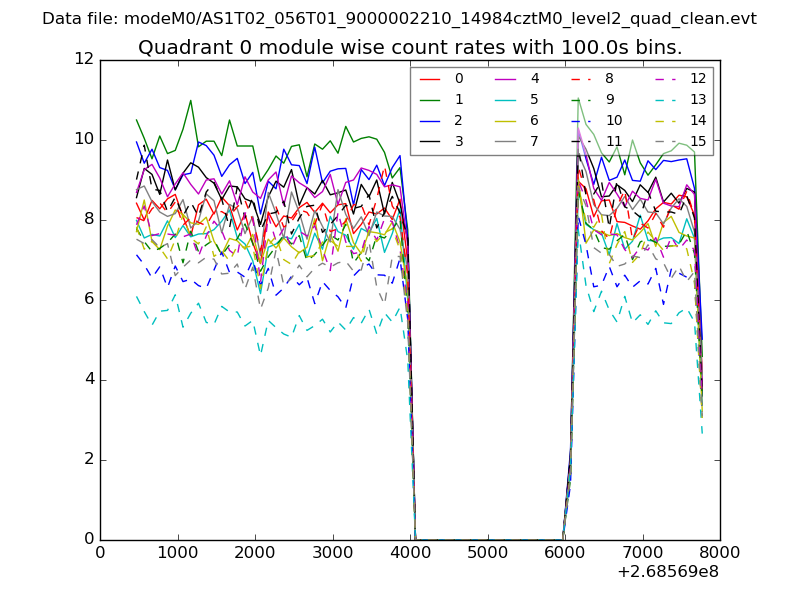
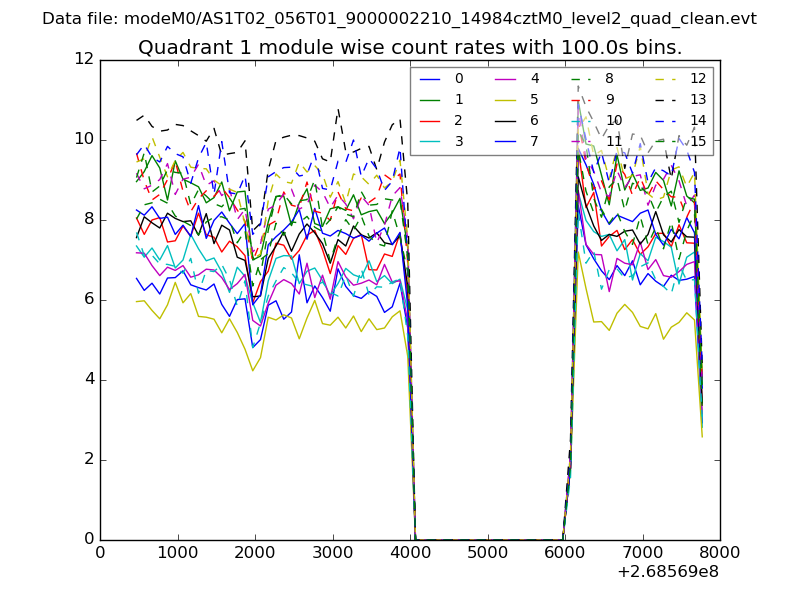
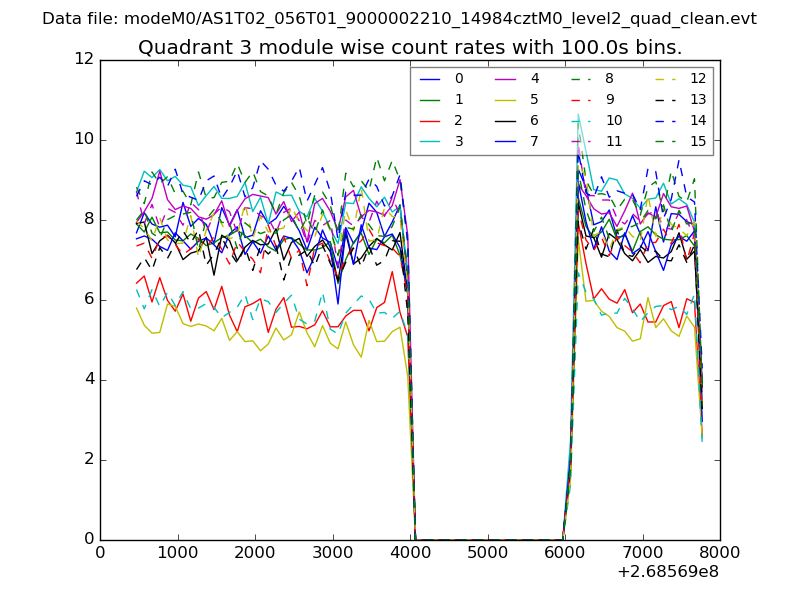
| Module-wise count rates for Quadrant A Data is divided into 100 sec bins |
 |
 |
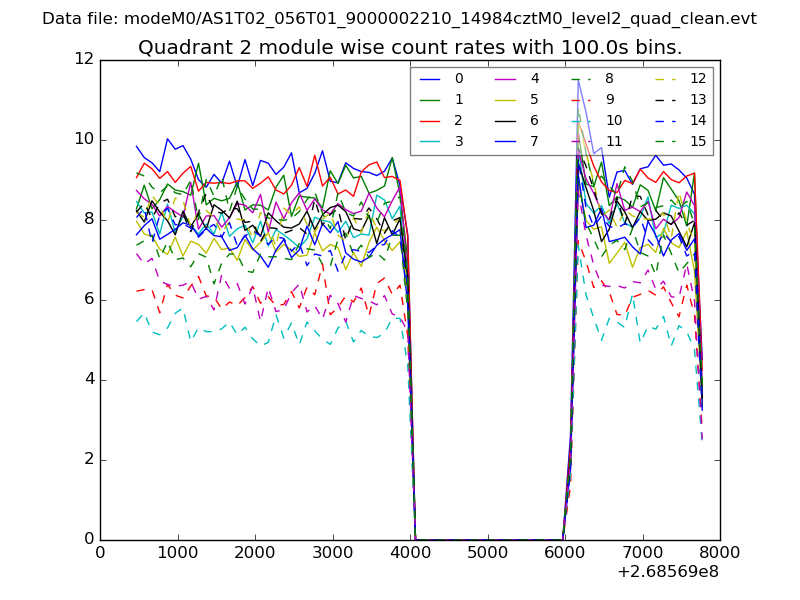
| Module-wise count rates for Quadrant B Data is divided into 100 sec bins |
 |
 |
| Module-wise count rates for Quadrant C Data is divided into 100 sec bins |
 |
 |
| Module-wise count rates for Quadrant D Data is divided into 100 sec bins |
 |
 |
| Parameter | Plot |
|---|---|
| CZT HV Monitor | 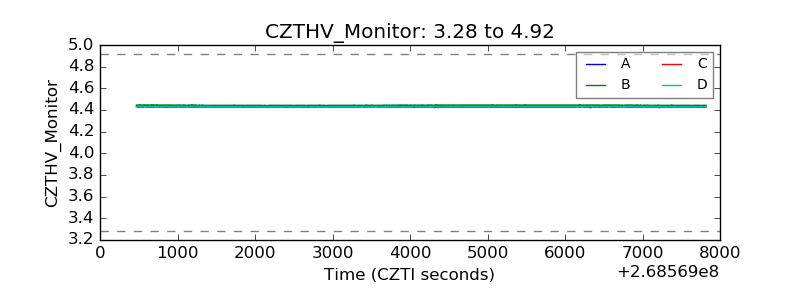 |
| D_VDD | 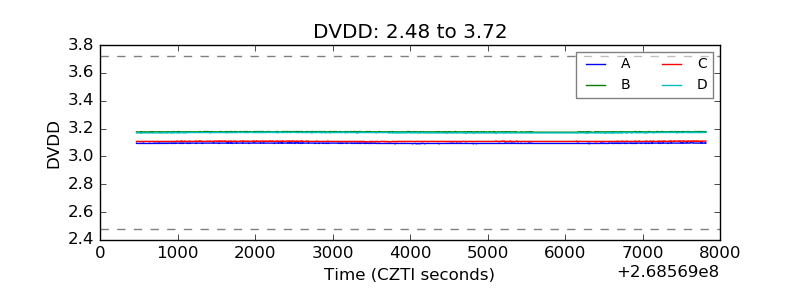 |
| Temperature 1 | 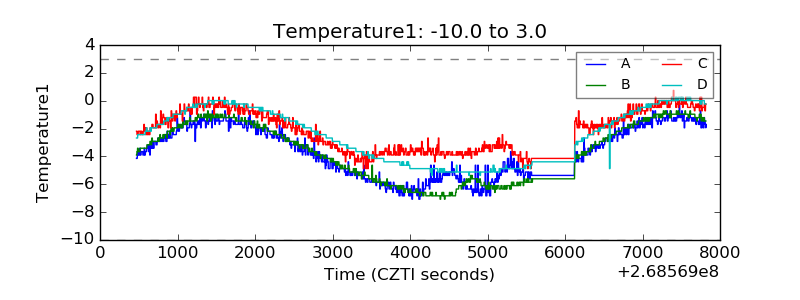 |
| Veto HV Monitor | 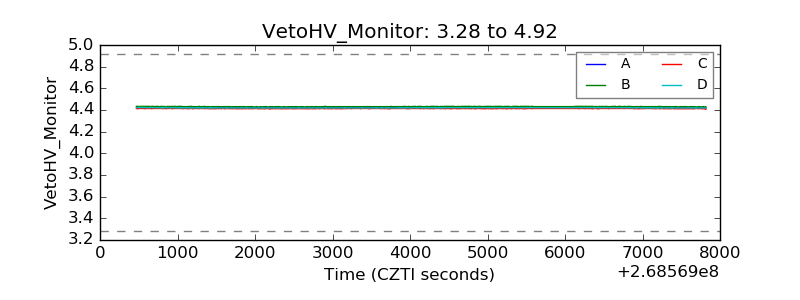 |
| Veto LLD |  |
| Alpha Counter | 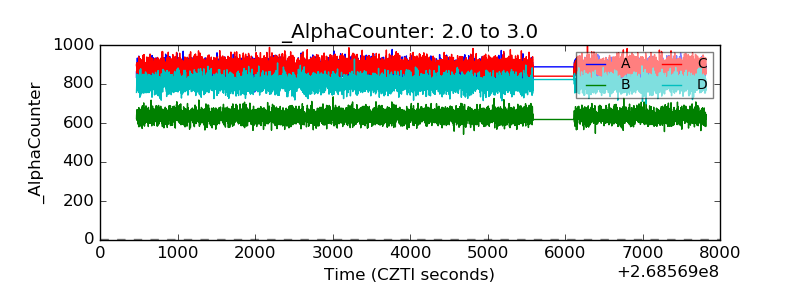 |
| _CPM_Rate | 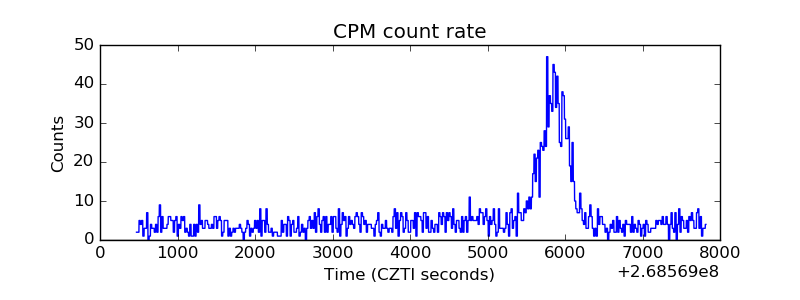 |
| CZT Counter | 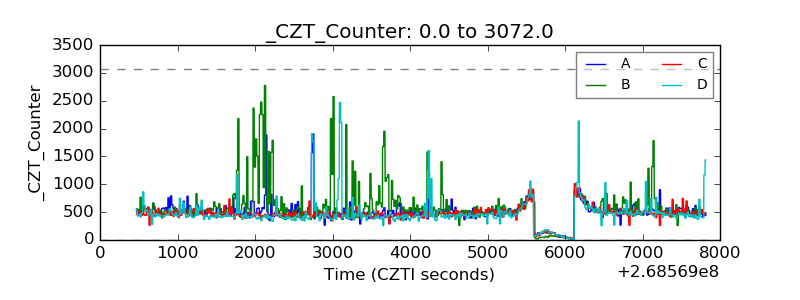 |
| +2.5 Volts monitor |  |
| +5 Volts monitor |  |
| _ROLL_ROT | 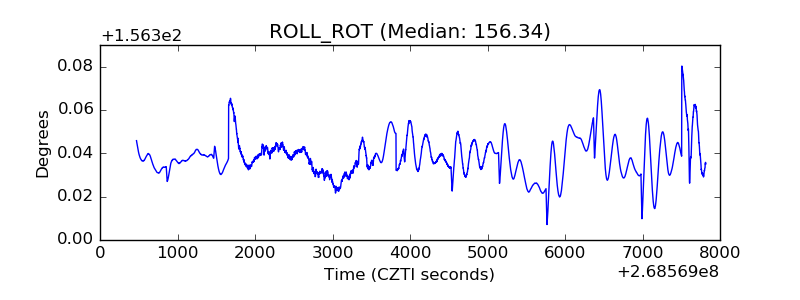 |
| _Roll_DEC |  |
| _Roll_RA | 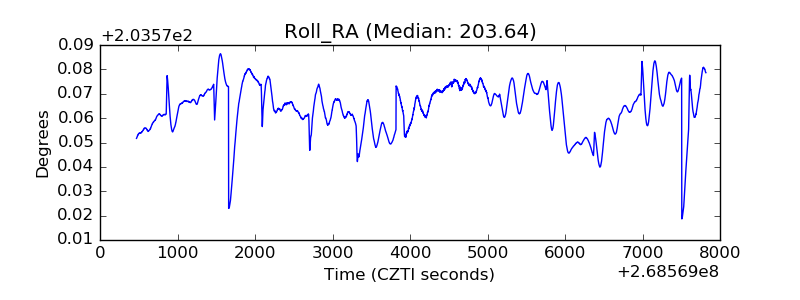 |
| Veto Counter | 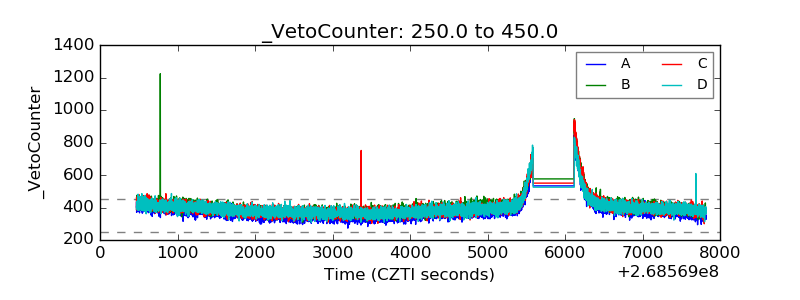 |