| Param | Original file | Final file |
|---|---|---|
| Filename | modeM0/AS1T02_056T01_9000002210_14985cztM0_level2.evt | modeM0/AS1T02_056T01_9000002210_14985cztM0_level2_quad_clean.evt |
| Size (bytes) | 462,792,960 | 88,539,840 |
| Size | 441.4 MB | 84.4 MB |
| Events in quadrant A | 3,452,414 | 563,488 |
| Events in quadrant B | 3,507,412 | 563,915 |
| Events in quadrant C | 3,245,504 | 552,554 |
| Events in quadrant D | 3,359,738 | 538,767 |
| Mode M0 | |||
|---|---|---|---|
| Quadrant | BADHDUFLAG | Total packets | Discarded packets |
| A | 0 | 14551 | 2 |
| B | 0 | 14584 | 1 |
| C | 0 | 13704 | 1 |
| D | 0 | 14572 | 1 |
| Mode M9 | |||
|---|---|---|---|
| Quadrant | BADHDUFLAG | Total packets | Discarded packets |
| A | 0 | 3 | 0 |
| B | 0 | 3 | 0 |
| C | 0 | 3 | 0 |
| D | 0 | 3 | 0 |
| Mode SS | |||
|---|---|---|---|
| Quadrant | BADHDUFLAG | Total packets | Discarded packets |
| A | 0 | 136 | 0 |
| B | 0 | 136 | 0 |
| C | 0 | 136 | 0 |
| D | 0 | 136 | 0 |
| Quadrant | Total seconds | Saturated seconds | Saturation percentage |
|---|---|---|---|
| A | 6629 | 59 | 0.890029% |
| B | 6629 | 107 | 1.614120% |
| C | 6629 | 37 | 0.558154% |
| D | 6629 | 108 | 1.629205% |
Noise dominated data is calculated using 1-second bins in cleaned event files. If a bin has >2000 counts, and if more than 50% of those come from <1% of pixels, then it is considered to be noise-dominated and hence unusable.
| Quadrant | # 1 sec bins | Bins with >0 counts | Bins with >2000 counts | High rate bins dominated by noise | Noise dominated (total time) | Noise dominated (detector-on time) | Marked lightcurve |
|---|---|---|---|---|---|---|---|
| A | 6960 | 6631 | 0 | 0 | 0.00% | 0.00% |  |
| B | 6960 | 6631 | 16 | 16 | 0.23% | 0.24% |  |
| C | 6960 | 6631 | 0 | 0 | 0.00% | 0.00% |  |
| D | 6960 | 6631 | 52 | 52 | 0.75% | 0.78% |  |
Top three noisy pixels from each quadrant. If the there are fewer than three noisy pixels in the level2.evt file, extra rows are filled as -1
| Pixel properties | Quadrant properties | ||||||
|---|---|---|---|---|---|---|---|
| Quadrant | DetID | PixID | Counts | Sigma | Mean | Median | Sigma |
| A | 12 | 189 | 184502 | 1131.04 | 795 | 778 | 162.4 |
| A | 1 | 162 | 97460 | 595.19 | 795 | 778 | 162.4 |
| A | 1 | 178 | 41222 | 248.98 | 795 | 778 | 162.4 |
| B | 10 | 245 | 128516 | 833.79 | 791 | 769 | 153.2 |
| B | 0 | 229 | 102881 | 666.47 | 791 | 769 | 153.2 |
| B | 15 | 201 | 39942 | 255.68 | 791 | 769 | 153.2 |
| C | 3 | 233 | 247355 | 1370.99 | 769 | 772 | 179.9 |
| C | 13 | 61 | 5599 | 26.84 | 769 | 772 | 179.9 |
| C | 14 | 234 | 2183 | 7.85 | 769 | 772 | 179.9 |
| D | 7 | 38 | 214364 | 1039.99 | 768 | 753 | 205.4 |
| D | 4 | 239 | 42060 | 201.11 | 768 | 753 | 205.4 |
| D | 2 | 234 | 28365 | 134.43 | 768 | 753 | 205.4 |
Histogram calculated using DETX and DETY for each event in the final _common_clean file
| Quadrant A |  |
 |
Quadrant B |
|---|---|---|---|
| Quadrant D |  |
 |
Quadrant C |
| Plot type | Count rate plots | Images |
|---|---|---|
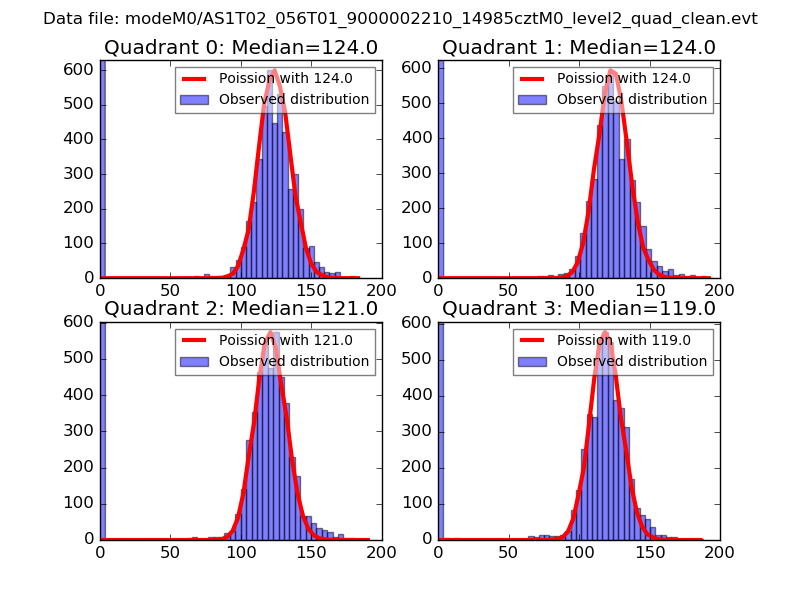
| Comparison with Poisson distribution Blue bars denote a histogram of data divided into 1 sec bins. Red curve is a Poisson curve with rate = median count rate of data. |
 |
 |
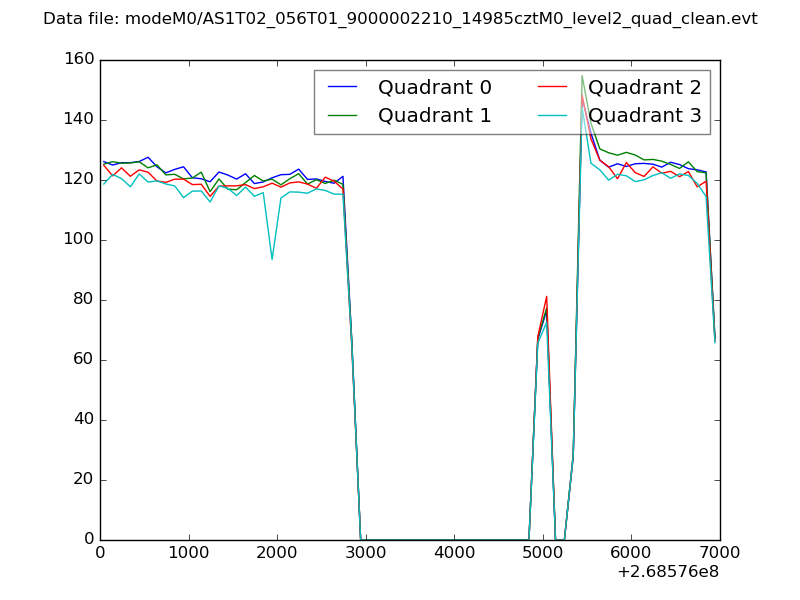
| Quadrant-wise count rates Data is divided into 100 sec bins |
 |
|
| Module-wise count rates for Quadrant A Data is divided into 100 sec bins |
 |
 |
| Module-wise count rates for Quadrant B Data is divided into 100 sec bins |
 |
 |
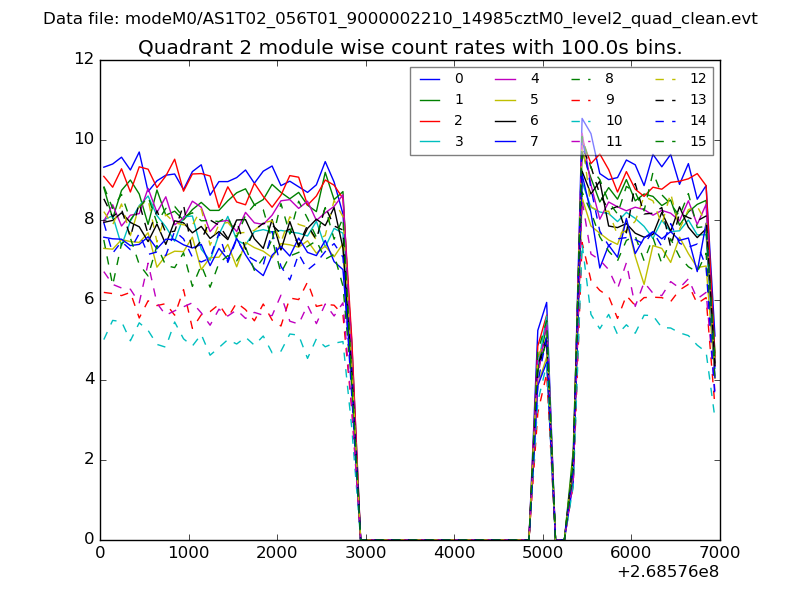
| Module-wise count rates for Quadrant C Data is divided into 100 sec bins |
 |
 |
| Module-wise count rates for Quadrant D Data is divided into 100 sec bins |
 |
 |
| Parameter | Plot |
|---|---|
| CZT HV Monitor |  |
| D_VDD |  |
| Temperature 1 |  |
| Veto HV Monitor |  |
| Veto LLD |  |
| Alpha Counter | 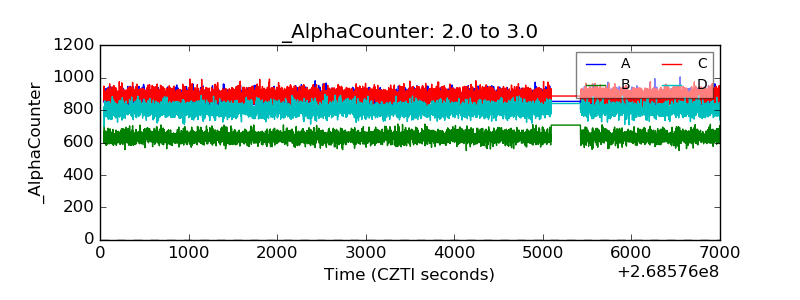 |
| _CPM_Rate | 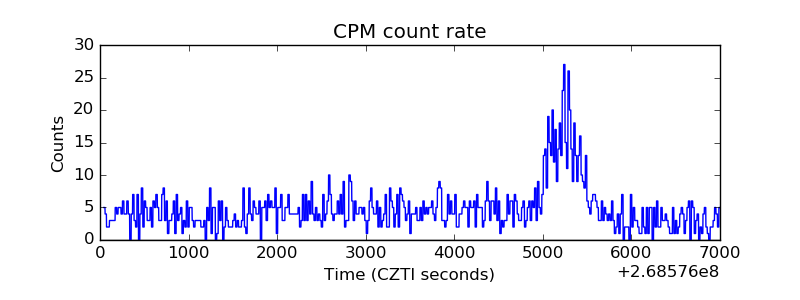 |
| CZT Counter |  |
| +2.5 Volts monitor |  |
| +5 Volts monitor |  |
| _ROLL_ROT |  |
| _Roll_DEC |  |
| _Roll_RA |  |
| Veto Counter |  |