| Param | Original file | Final file |
|---|---|---|
| Filename | modeM0/AS1T02_056T01_9000002210_14986cztM0_level2.evt | modeM0/AS1T02_056T01_9000002210_14986cztM0_level2_quad_clean.evt |
| Size (bytes) | 506,232,000 | 94,550,400 |
| Size | 482.8 MB | 90.2 MB |
| Events in quadrant A | 3,729,938 | 604,892 |
| Events in quadrant B | 4,216,812 | 599,604 |
| Events in quadrant C | 3,400,446 | 594,659 |
| Events in quadrant D | 3,509,113 | 576,633 |
| Mode M0 | |||
|---|---|---|---|
| Quadrant | BADHDUFLAG | Total packets | Discarded packets |
| A | 0 | 15672 | 2 |
| B | 0 | 17003 | 1 |
| C | 0 | 14396 | 1 |
| D | 0 | 15367 | 1 |
| Mode M9 | |||
|---|---|---|---|
| Quadrant | BADHDUFLAG | Total packets | Discarded packets |
| A | 0 | 4 | 0 |
| B | 0 | 4 | 0 |
| C | 0 | 4 | 0 |
| D | 0 | 4 | 0 |
| Mode SS | |||
|---|---|---|---|
| Quadrant | BADHDUFLAG | Total packets | Discarded packets |
| A | 0 | 142 | 0 |
| B | 0 | 142 | 0 |
| C | 0 | 142 | 0 |
| D | 0 | 142 | 0 |
| Quadrant | Total seconds | Saturated seconds | Saturation percentage |
|---|---|---|---|
| A | 6998 | 41 | 0.585882% |
| B | 6998 | 225 | 3.215204% |
| C | 6998 | 20 | 0.285796% |
| D | 6998 | 90 | 1.286082% |
Noise dominated data is calculated using 1-second bins in cleaned event files. If a bin has >2000 counts, and if more than 50% of those come from <1% of pixels, then it is considered to be noise-dominated and hence unusable.
| Quadrant | # 1 sec bins | Bins with >0 counts | Bins with >2000 counts | High rate bins dominated by noise | Noise dominated (total time) | Noise dominated (detector-on time) | Marked lightcurve |
|---|---|---|---|---|---|---|---|
| A | 7399 | 7000 | 0 | 0 | 0.00% | 0.00% | 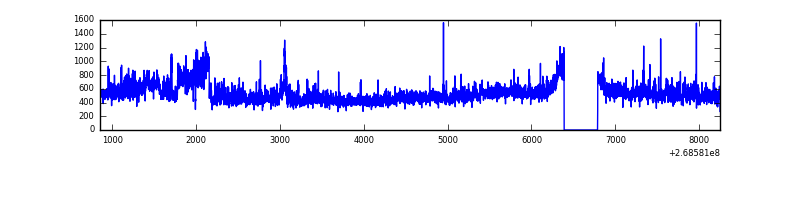 |
| B | 7399 | 7000 | 108 | 108 | 1.46% | 1.54% | 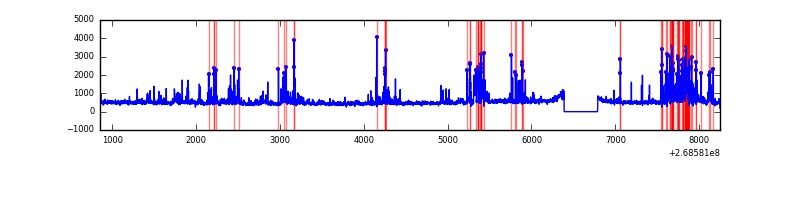 |
| C | 7399 | 7000 | 0 | 0 | 0.00% | 0.00% | 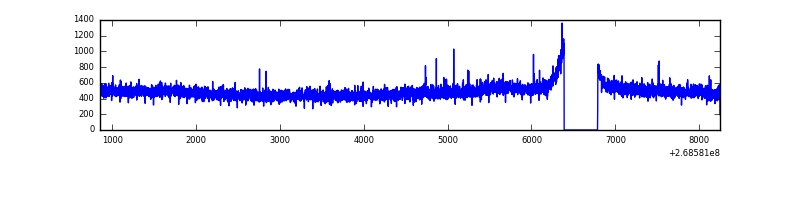 |
| D | 7399 | 7000 | 50 | 50 | 0.68% | 0.71% | 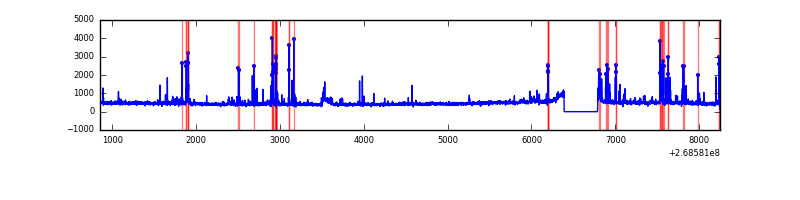 |
Top three noisy pixels from each quadrant. If the there are fewer than three noisy pixels in the level2.evt file, extra rows are filled as -1
| Pixel properties | Quadrant properties | ||||||
|---|---|---|---|---|---|---|---|
| Quadrant | DetID | PixID | Counts | Sigma | Mean | Median | Sigma |
| A | 12 | 189 | 298834 | 1768.2 | 829 | 808 | 168.5 |
| A | 1 | 162 | 109733 | 646.26 | 829 | 808 | 168.5 |
| A | 1 | 178 | 47751 | 278.52 | 829 | 808 | 168.5 |
| B | 0 | 245 | 289156 | 1824.08 | 818 | 795 | 158.1 |
| B | 0 | 229 | 232990 | 1468.8 | 818 | 795 | 158.1 |
| B | 7 | 220 | 201116 | 1267.17 | 818 | 795 | 158.1 |
| C | 3 | 233 | 255851 | 1362.6 | 803 | 806 | 187.2 |
| C | 13 | 61 | 5899 | 27.21 | 803 | 806 | 187.2 |
| C | 0 | 207 | 5512 | 25.14 | 803 | 806 | 187.2 |
| D | 7 | 38 | 149225 | 754.56 | 806 | 781 | 196.7 |
| D | 4 | 239 | 141202 | 713.78 | 806 | 781 | 196.7 |
| D | 7 | 223 | 57656 | 289.1 | 806 | 781 | 196.7 |
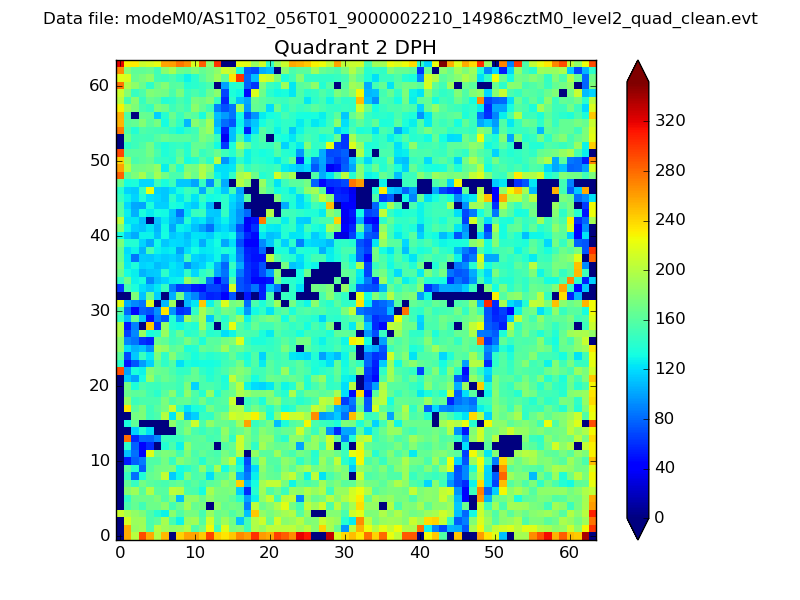
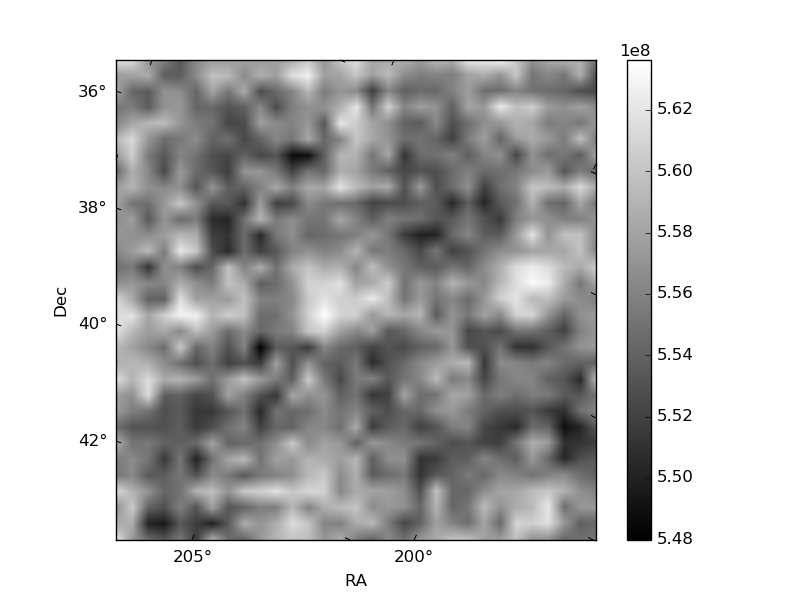
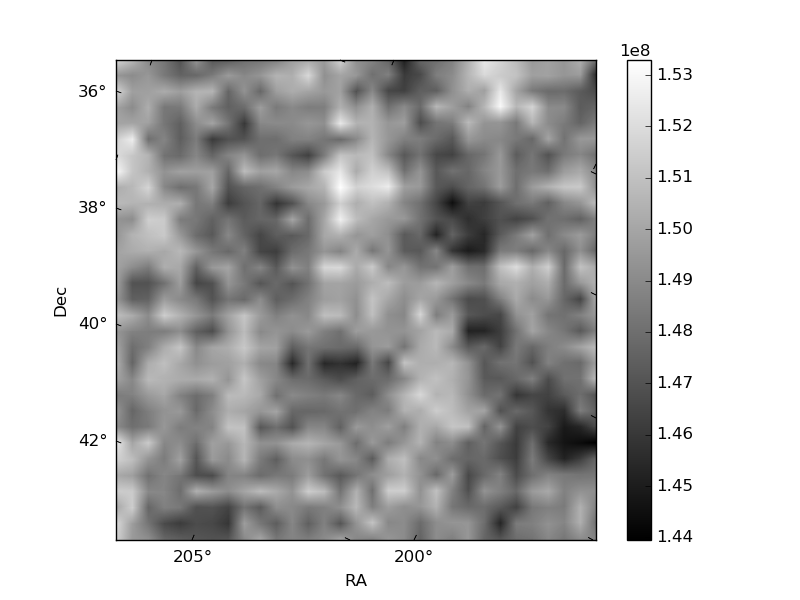
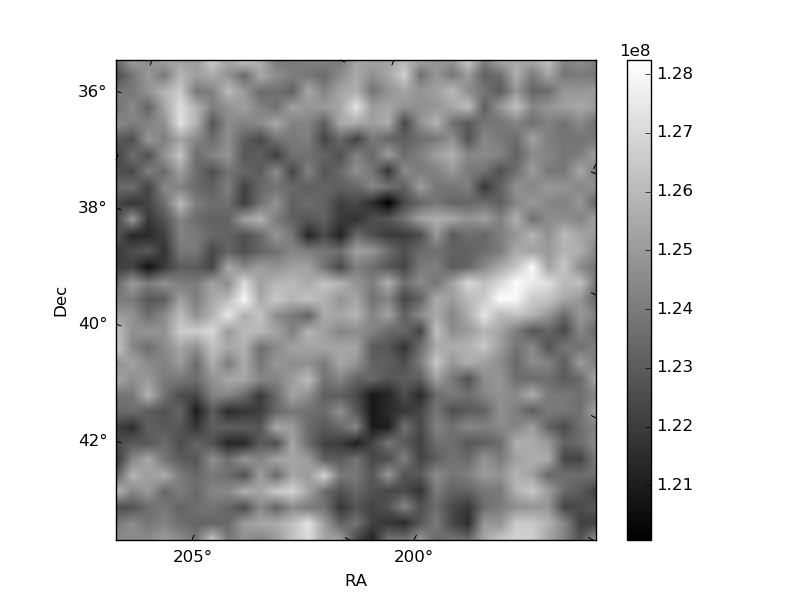
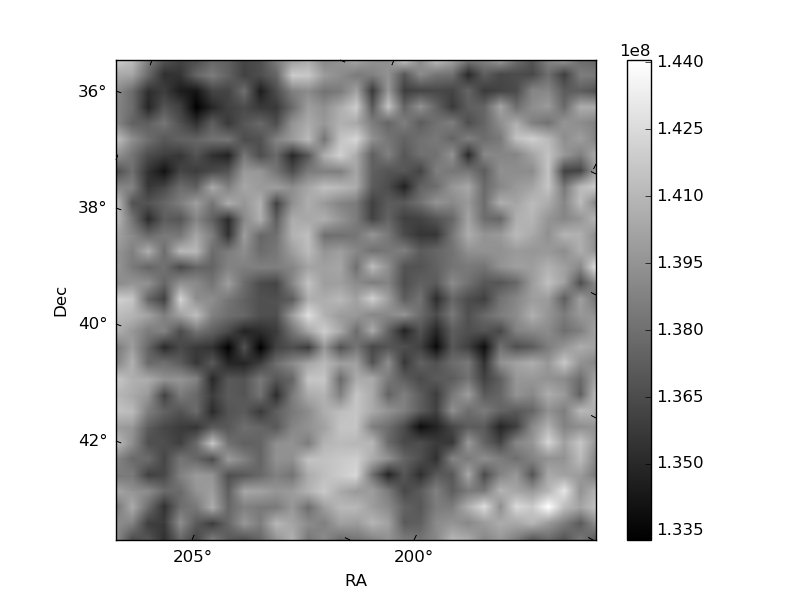
Histogram calculated using DETX and DETY for each event in the final _common_clean file
| Quadrant A | 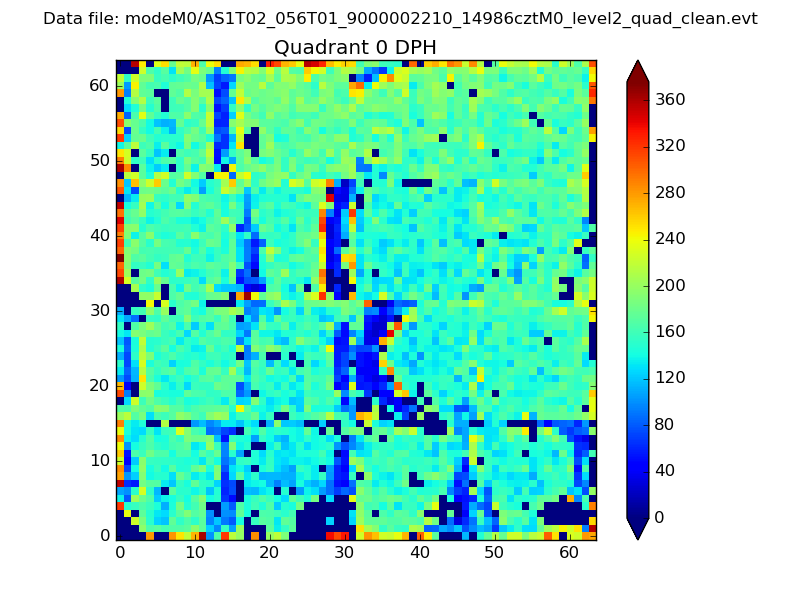 |
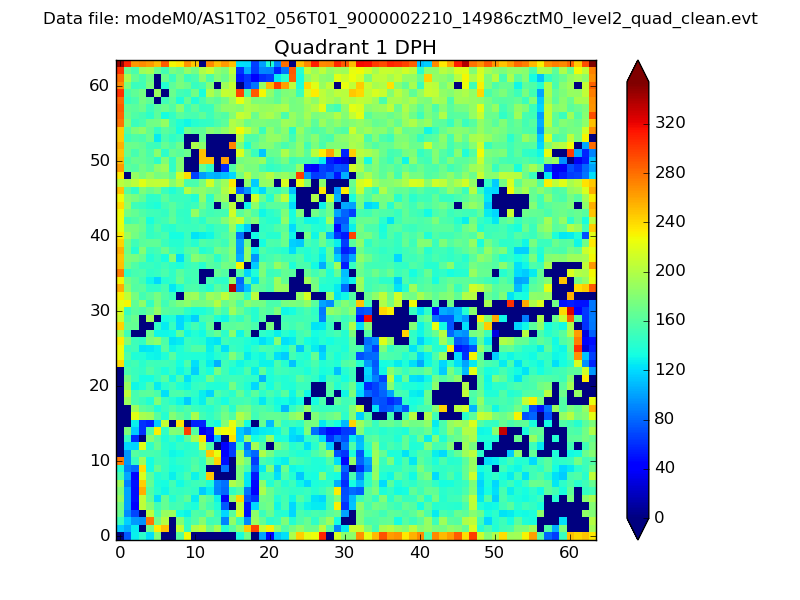 |
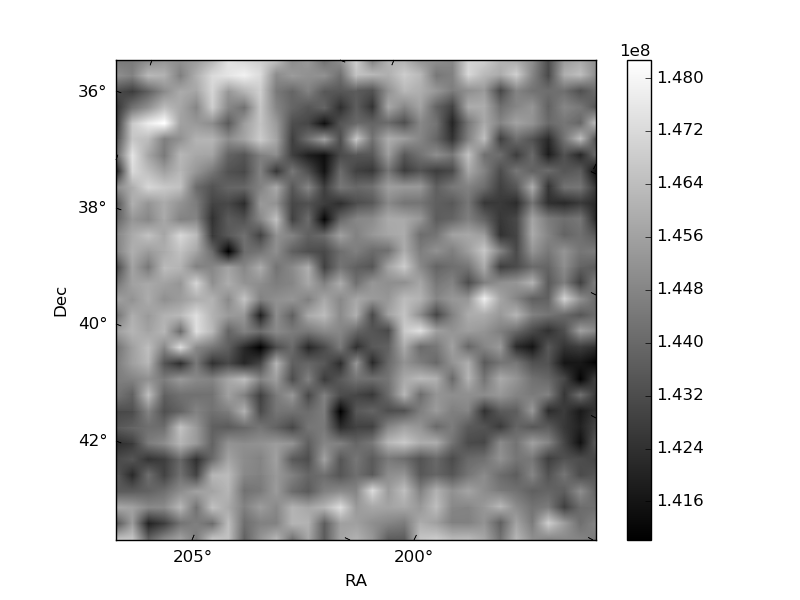
Quadrant B |
|---|---|---|---|
| Quadrant D | 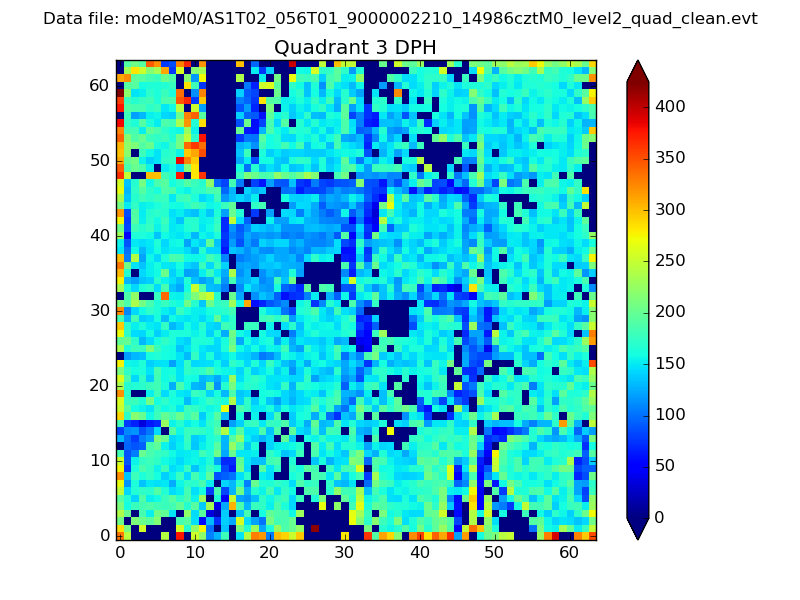 |
 |
Quadrant C |
| Plot type | Count rate plots | Images |
|---|---|---|
| Comparison with Poisson distribution Blue bars denote a histogram of data divided into 1 sec bins. Red curve is a Poisson curve with rate = median count rate of data. |
 |
 |
| Quadrant-wise count rates Data is divided into 100 sec bins |
 |
|
| Module-wise count rates for Quadrant A Data is divided into 100 sec bins |
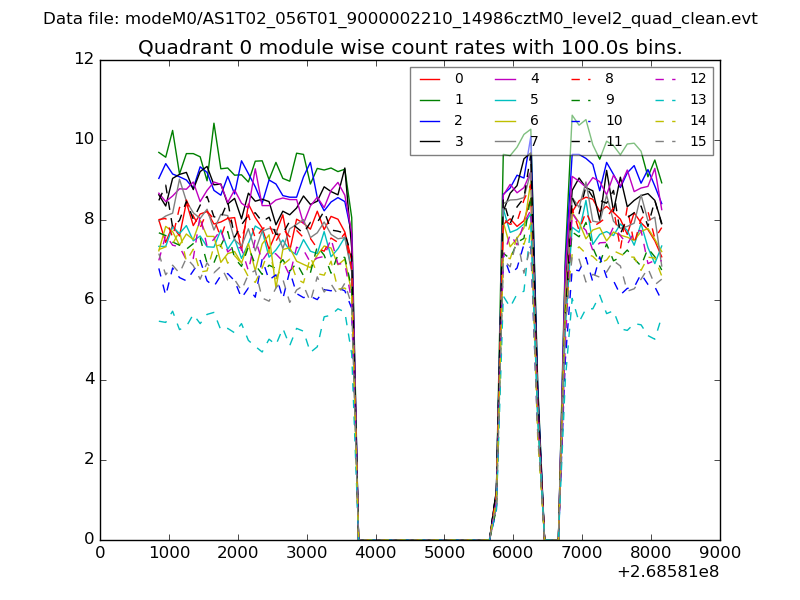 |
 |
| Module-wise count rates for Quadrant B Data is divided into 100 sec bins |
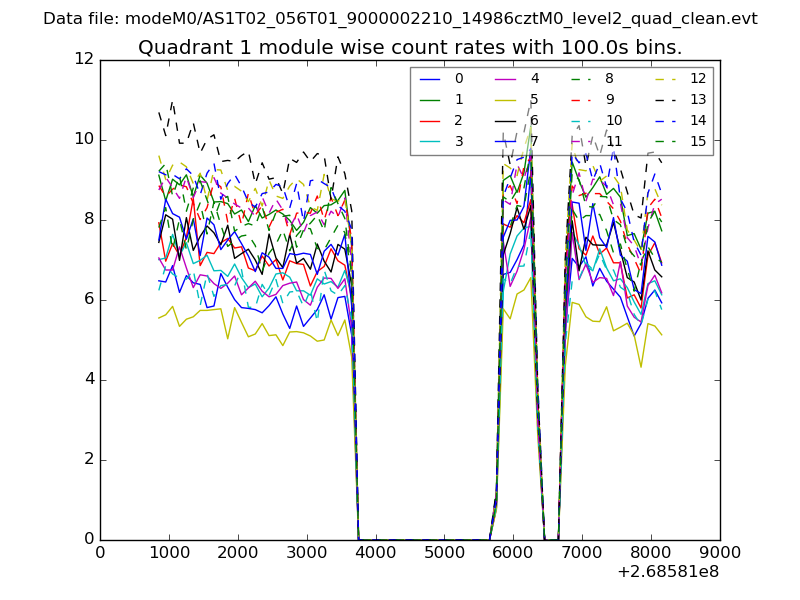 |
 |
| Module-wise count rates for Quadrant C Data is divided into 100 sec bins |
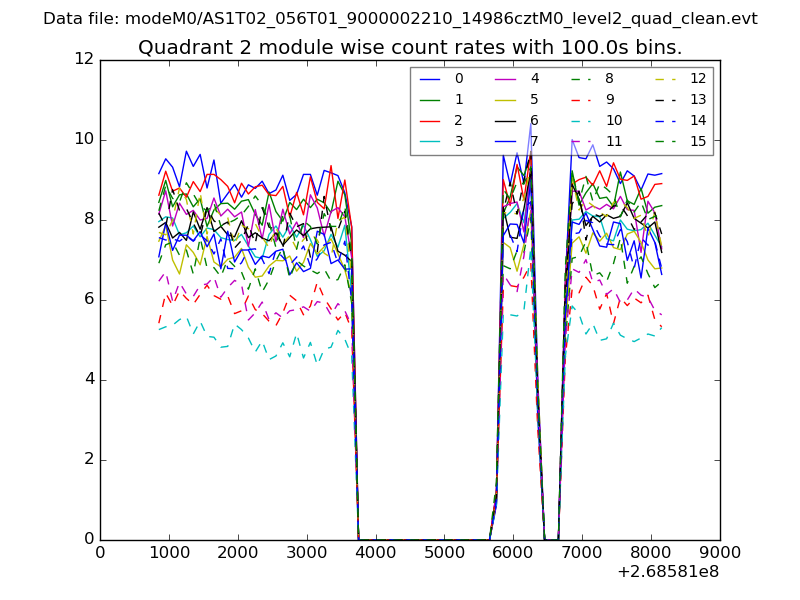 |
 |
| Module-wise count rates for Quadrant D Data is divided into 100 sec bins |
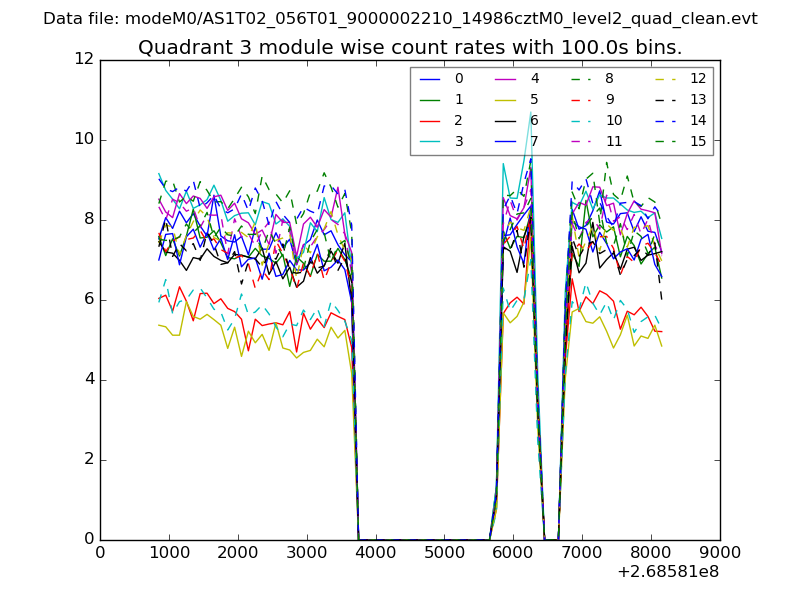 |
 |
| Parameter | Plot |
|---|---|
| CZT HV Monitor | 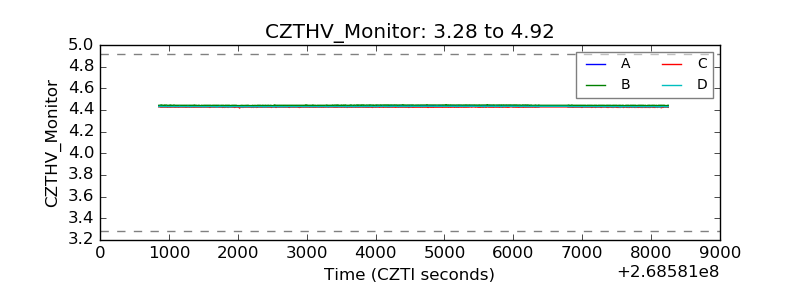 |
| D_VDD | 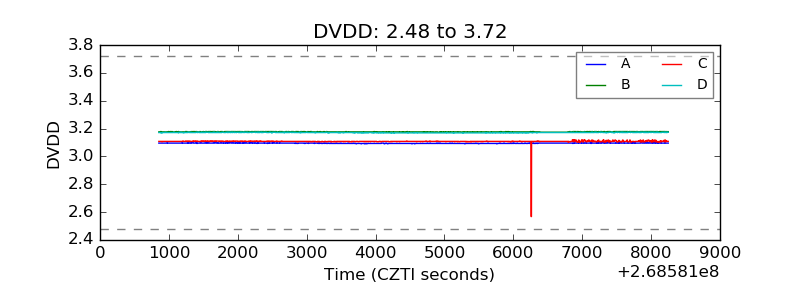 |
| Temperature 1 | 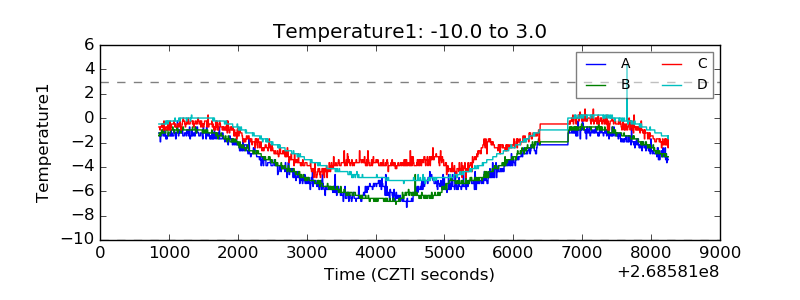 |
| Veto HV Monitor | 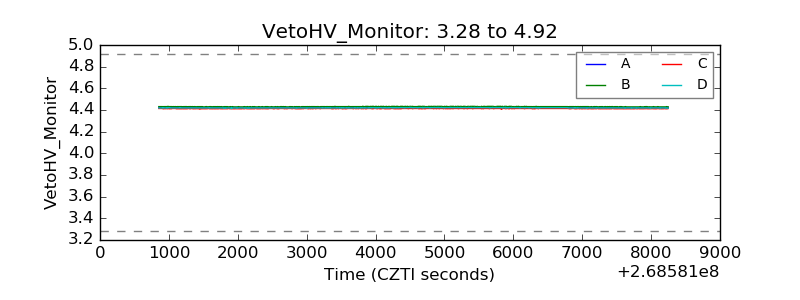 |
| Veto LLD | 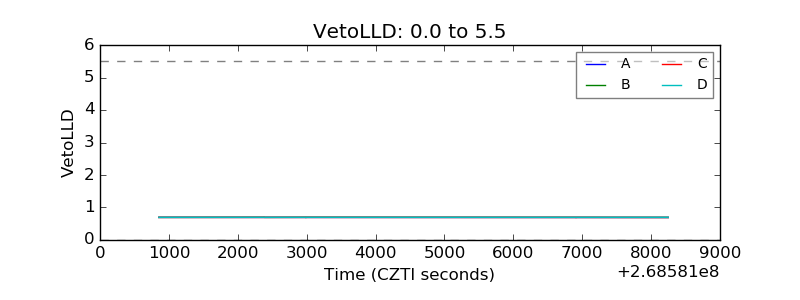 |
| Alpha Counter |  |
| _CPM_Rate | 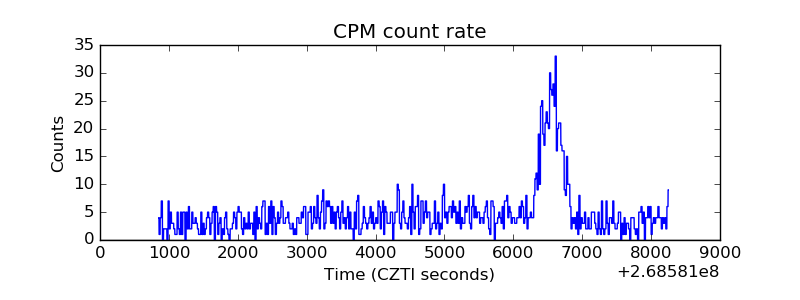 |
| CZT Counter | 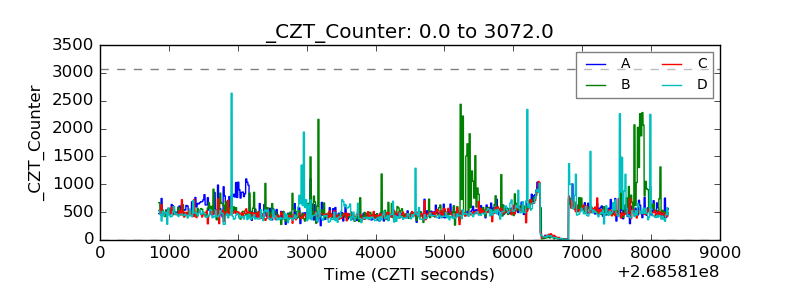 |
| +2.5 Volts monitor |  |
| +5 Volts monitor |  |
| _ROLL_ROT | 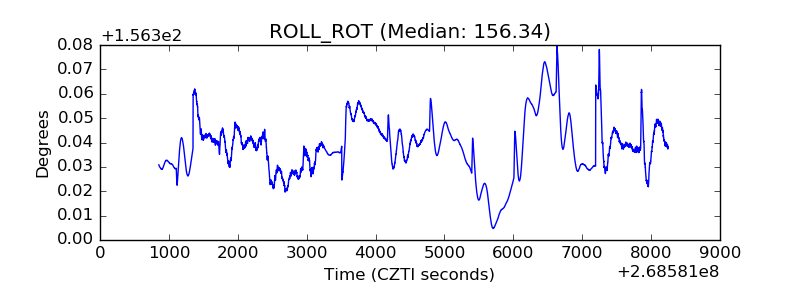 |
| _Roll_DEC | 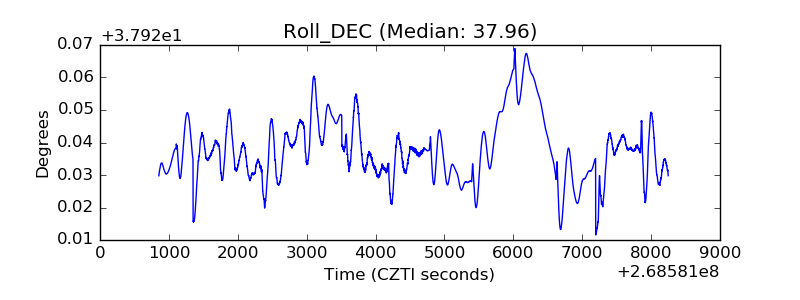 |
| _Roll_RA | 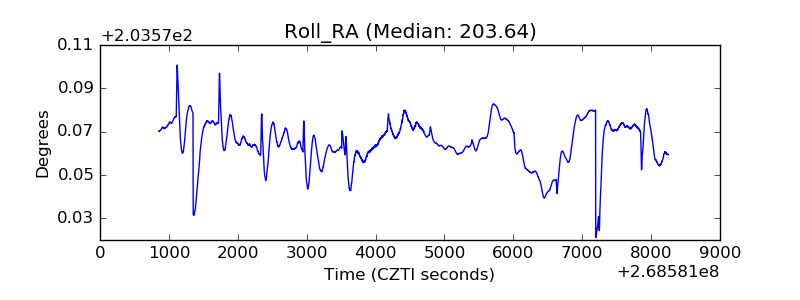 |
| Veto Counter | 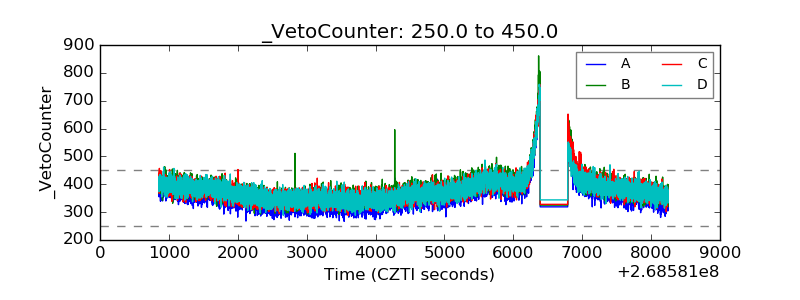 |