| Param | Original file | Final file |
|---|---|---|
| Filename | modeM0/AS1T02_056T01_9000002210_14991cztM0_level2.evt | modeM0/AS1T02_056T01_9000002210_14991cztM0_level2_quad_clean.evt |
| Size (bytes) | 459,642,240 | 83,986,560 |
| Size | 438.3 MB | 80.1 MB |
| Events in quadrant A | 3,574,203 | 524,527 |
| Events in quadrant B | 3,412,751 | 534,155 |
| Events in quadrant C | 3,315,119 | 515,802 |
| Events in quadrant D | 3,164,649 | 503,215 |
| Mode M0 | |||
|---|---|---|---|
| Quadrant | BADHDUFLAG | Total packets | Discarded packets |
| A | 0 | 14936 | 3 |
| B | 0 | 14401 | 2 |
| C | 0 | 13889 | 2 |
| D | 0 | 14036 | 2 |
| Mode M9 | |||
|---|---|---|---|
| Quadrant | BADHDUFLAG | Total packets | Discarded packets |
| A | 0 | 21 | 0 |
| B | 0 | 21 | 0 |
| C | 0 | 21 | 0 |
| D | 0 | 21 | 0 |
| Mode SS | |||
|---|---|---|---|
| Quadrant | BADHDUFLAG | Total packets | Discarded packets |
| A | 0 | 138 | 0 |
| B | 0 | 138 | 0 |
| C | 0 | 138 | 0 |
| D | 0 | 138 | 0 |
| Quadrant | Total seconds | Saturated seconds | Saturation percentage |
|---|---|---|---|
| A | 6675 | 41 | 0.614232% |
| B | 6675 | 46 | 0.689139% |
| C | 6675 | 13 | 0.194757% |
| D | 6675 | 29 | 0.434457% |
Noise dominated data is calculated using 1-second bins in cleaned event files. If a bin has >2000 counts, and if more than 50% of those come from <1% of pixels, then it is considered to be noise-dominated and hence unusable.
| Quadrant | # 1 sec bins | Bins with >0 counts | Bins with >2000 counts | High rate bins dominated by noise | Noise dominated (total time) | Noise dominated (detector-on time) | Marked lightcurve |
|---|---|---|---|---|---|---|---|
| A | 8781 | 6678 | 6 | 6 | 0.07% | 0.09% | 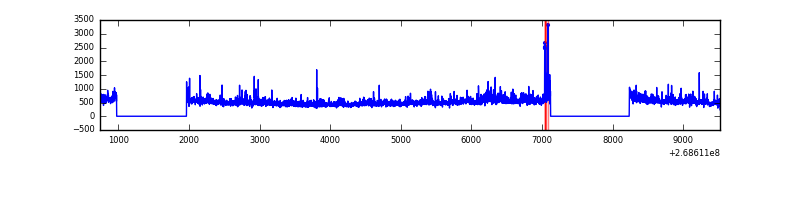 |
| B | 8781 | 6678 | 4 | 4 | 0.05% | 0.06% | 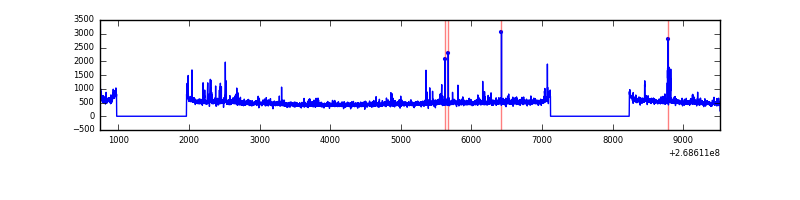 |
| C | 8781 | 6678 | 0 | 0 | 0.00% | 0.00% | 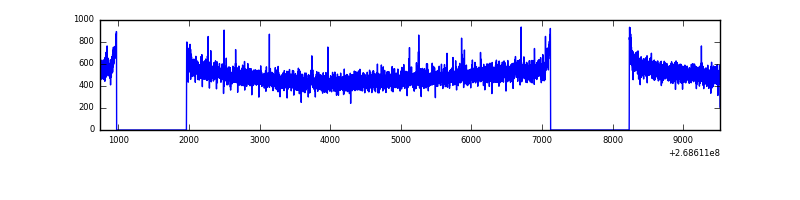 |
| D | 8781 | 6678 | 18 | 18 | 0.20% | 0.27% | 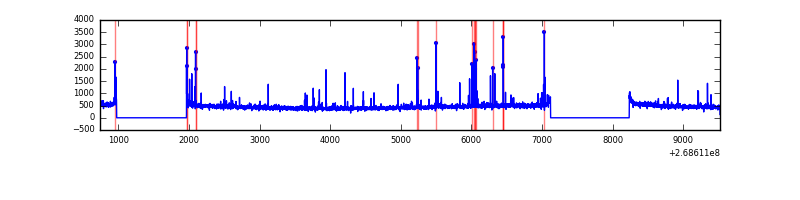 |
Top three noisy pixels from each quadrant. If the there are fewer than three noisy pixels in the level2.evt file, extra rows are filled as -1
| Pixel properties | Quadrant properties | ||||||
|---|---|---|---|---|---|---|---|
| Quadrant | DetID | PixID | Counts | Sigma | Mean | Median | Sigma |
| A | 1 | 162 | 130122 | 784.09 | 812 | 794 | 164.9 |
| A | 12 | 189 | 114364 | 688.55 | 812 | 794 | 164.9 |
| A | 1 | 178 | 61925 | 370.63 | 812 | 794 | 164.9 |
| B | 0 | 229 | 165877 | 1065.08 | 815 | 795 | 155.0 |
| B | 12 | 111 | 17537 | 108.02 | 815 | 795 | 155.0 |
| B | 11 | 111 | 14687 | 89.63 | 815 | 795 | 155.0 |
| C | 3 | 233 | 225971 | 1237.58 | 790 | 794 | 182.0 |
| C | 10 | 22 | 6439 | 31.02 | 790 | 794 | 182.0 |
| C | 13 | 61 | 5654 | 26.71 | 790 | 794 | 182.0 |
| D | 13 | 249 | 59034 | 309.35 | 782 | 762 | 188.4 |
| D | 7 | 38 | 50517 | 264.14 | 782 | 762 | 188.4 |
| D | 2 | 234 | 27690 | 142.95 | 782 | 762 | 188.4 |
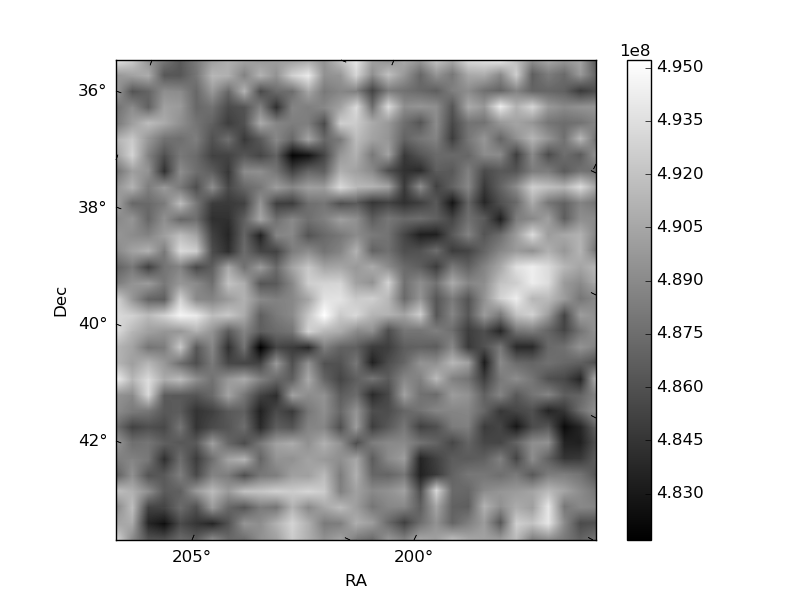
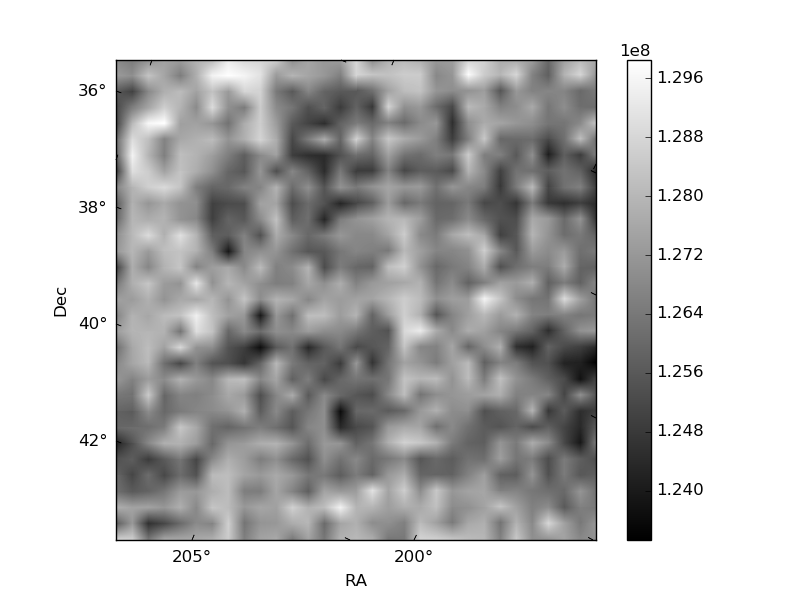
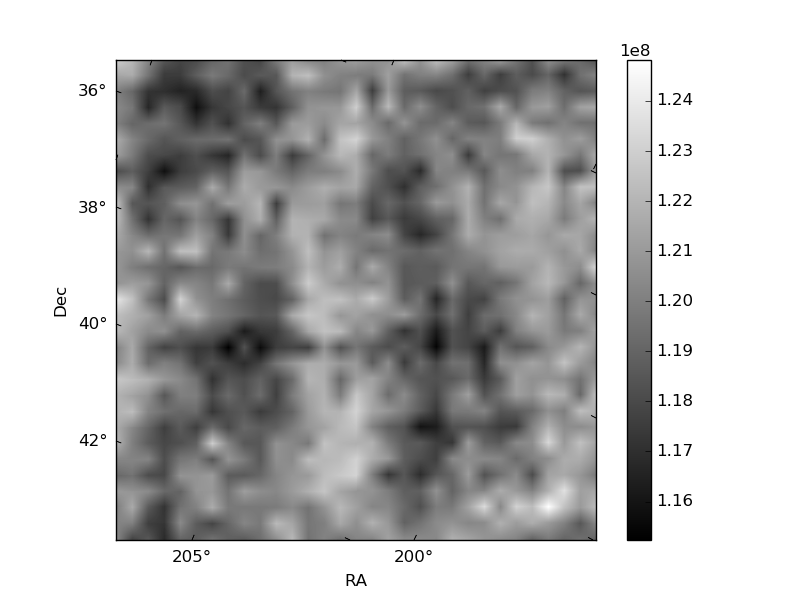
Histogram calculated using DETX and DETY for each event in the final _common_clean file
| Quadrant A | 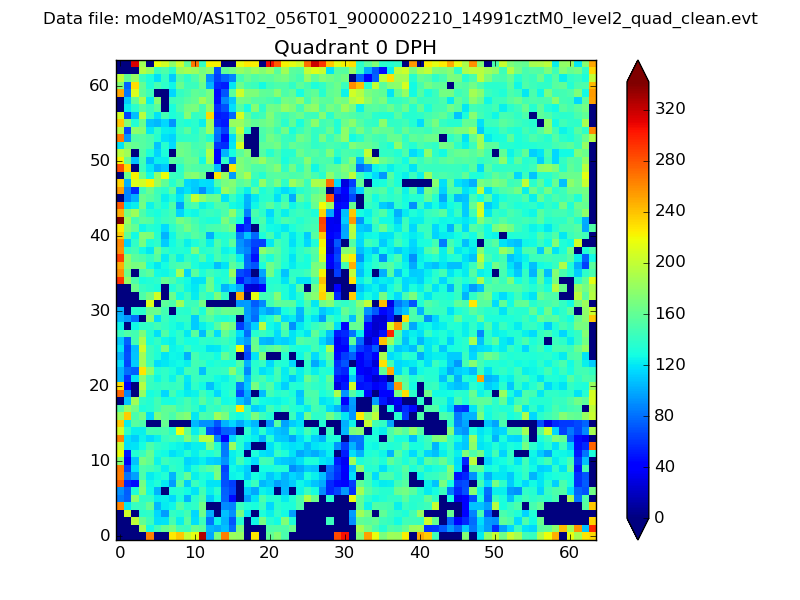 |
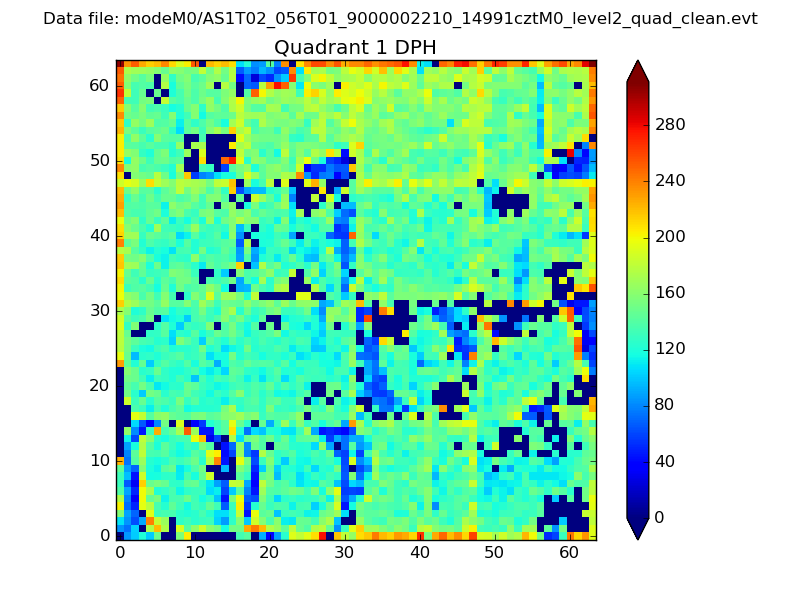 |
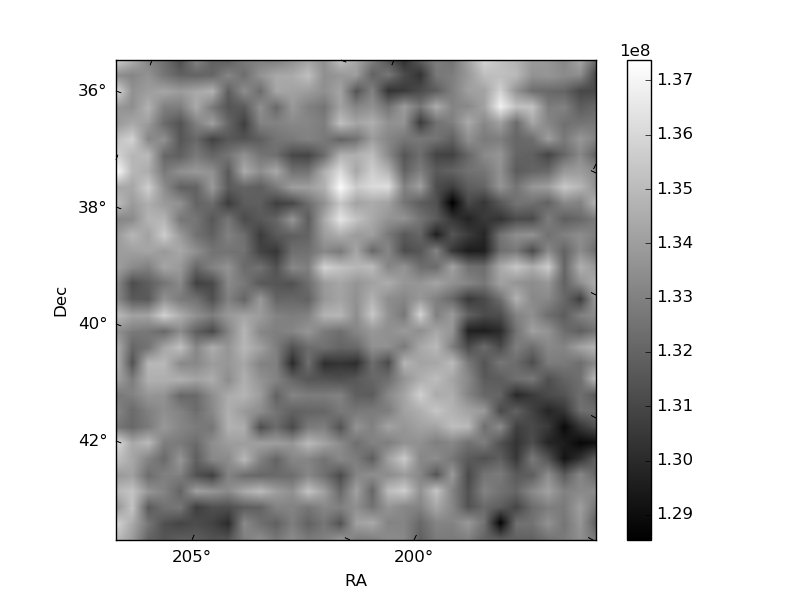
Quadrant B |
|---|---|---|---|
| Quadrant D | 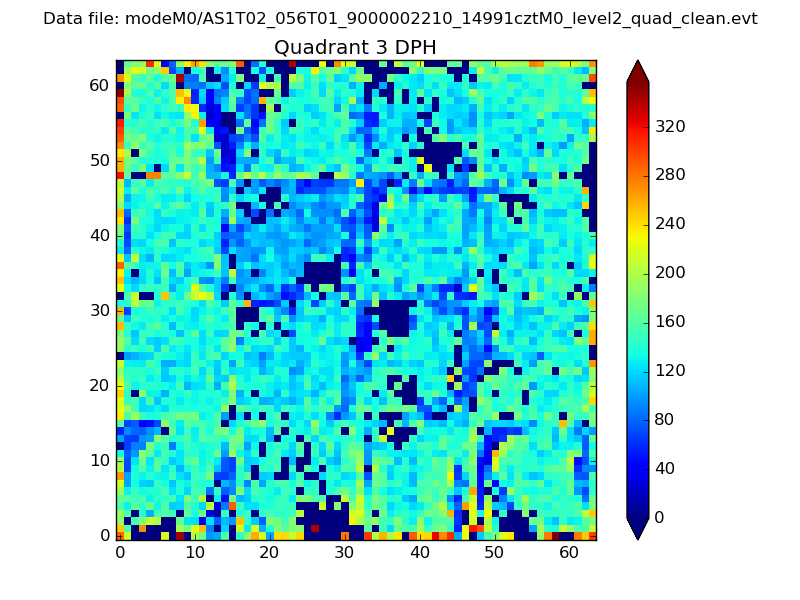 |
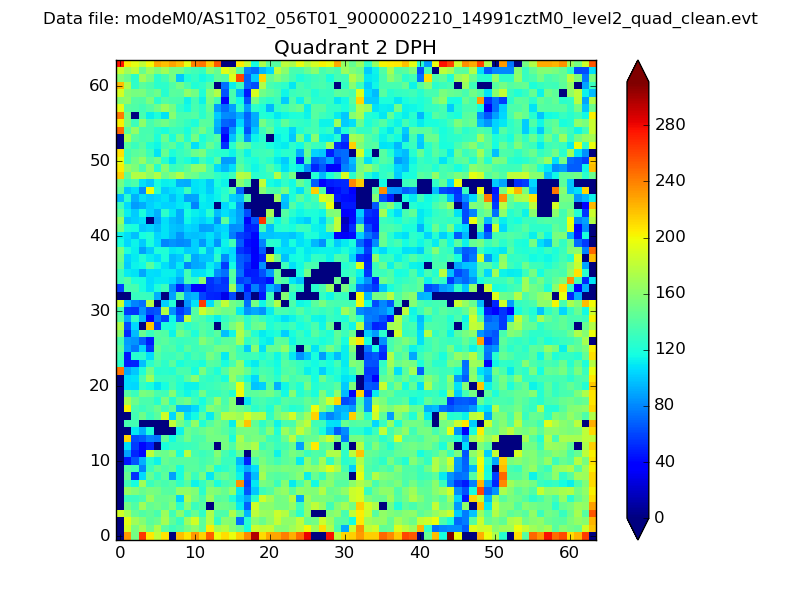 |
Quadrant C |
| Plot type | Count rate plots | Images |
|---|---|---|
| Comparison with Poisson distribution Blue bars denote a histogram of data divided into 1 sec bins. Red curve is a Poisson curve with rate = median count rate of data. |
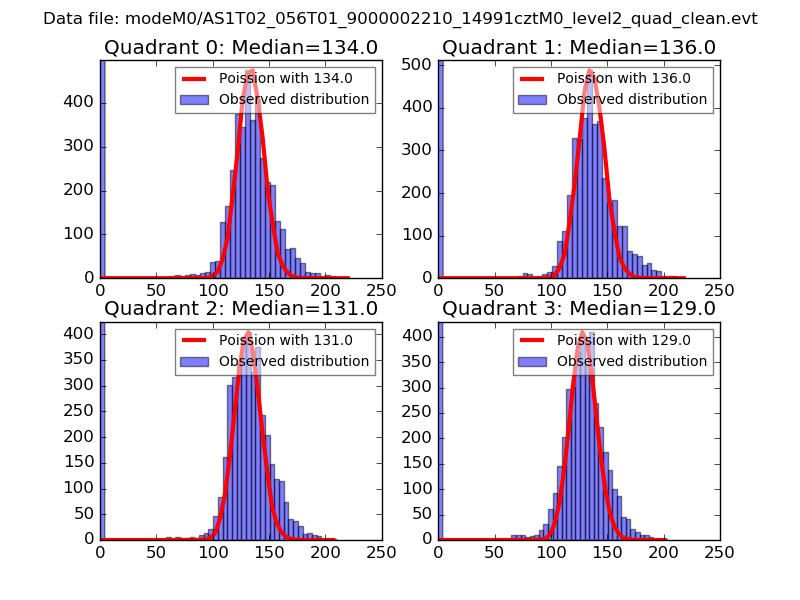 |
 |
| Quadrant-wise count rates Data is divided into 100 sec bins |
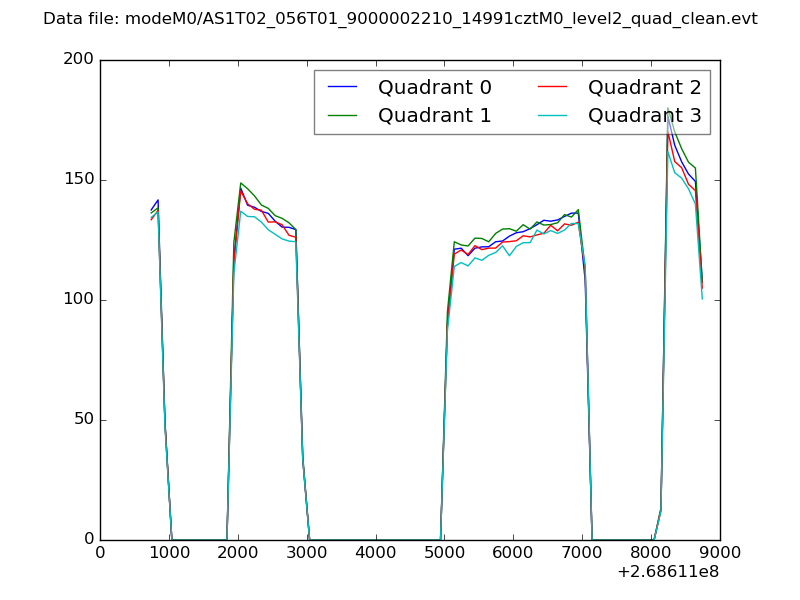 |
|
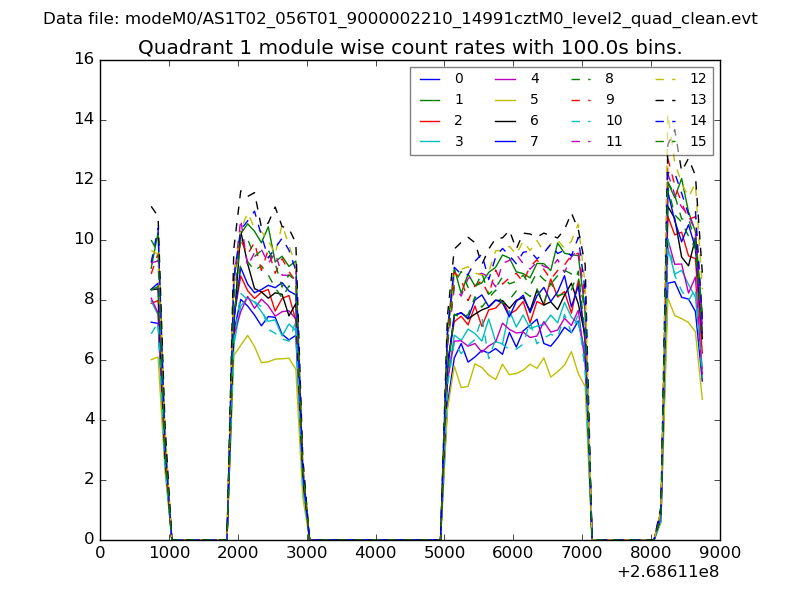
| Module-wise count rates for Quadrant A Data is divided into 100 sec bins |
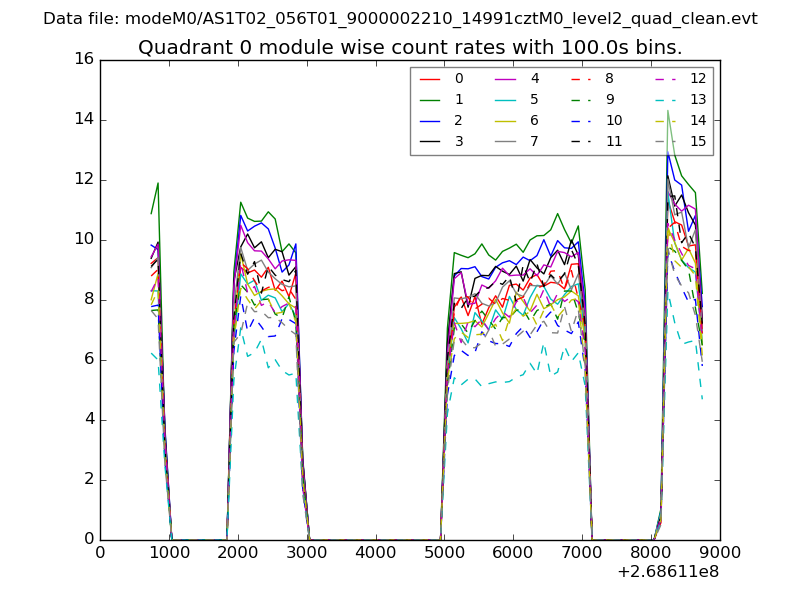 |
 |
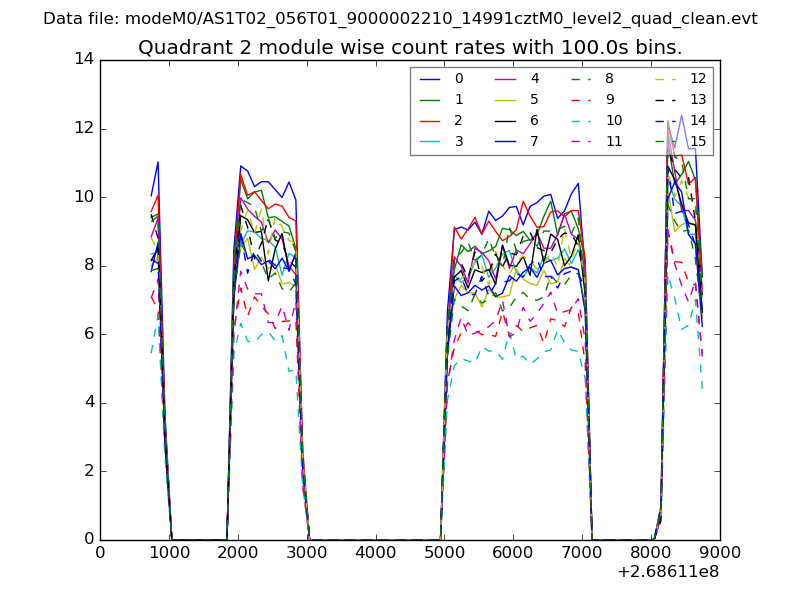
| Module-wise count rates for Quadrant B Data is divided into 100 sec bins |
 |
 |
| Module-wise count rates for Quadrant C Data is divided into 100 sec bins |
 |
 |
| Module-wise count rates for Quadrant D Data is divided into 100 sec bins |
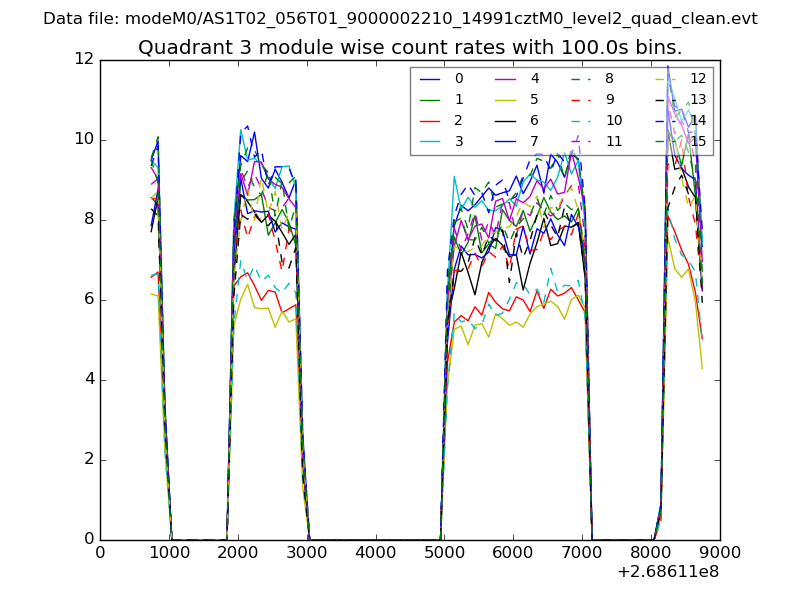 |
 |
| Parameter | Plot |
|---|---|
| CZT HV Monitor | 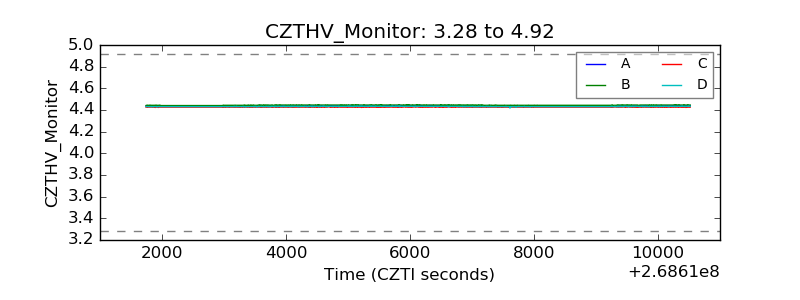 |
| D_VDD | 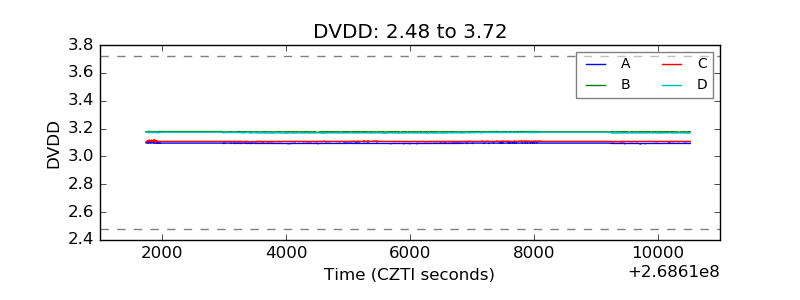 |
| Temperature 1 | 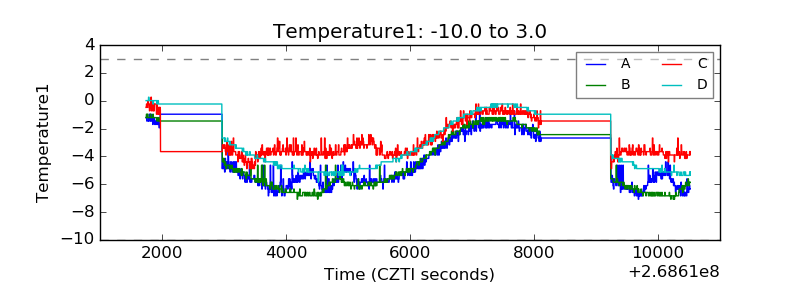 |
| Veto HV Monitor | 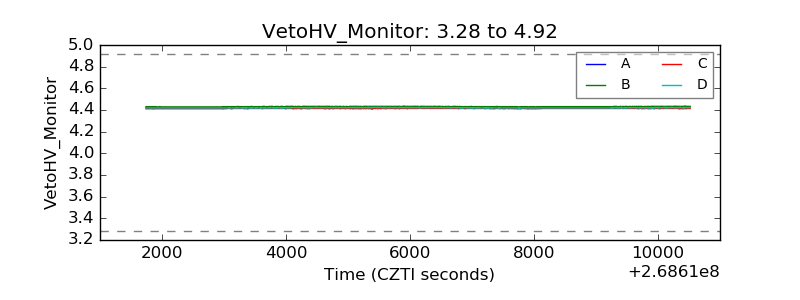 |
| Veto LLD |  |
| Alpha Counter | 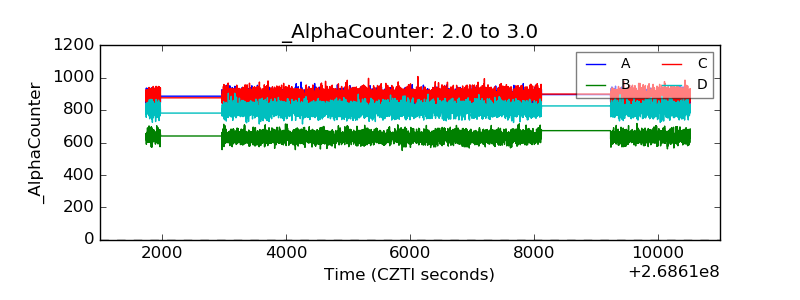 |
| _CPM_Rate | 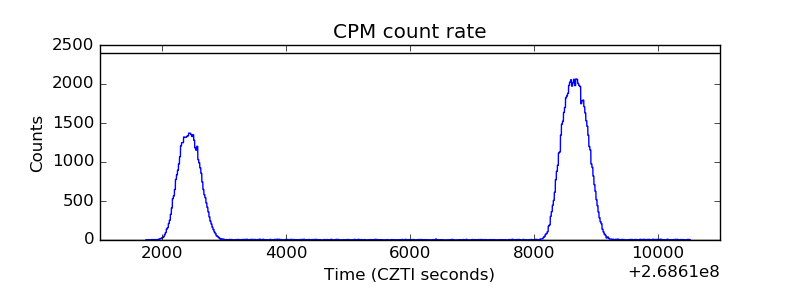 |
| CZT Counter | 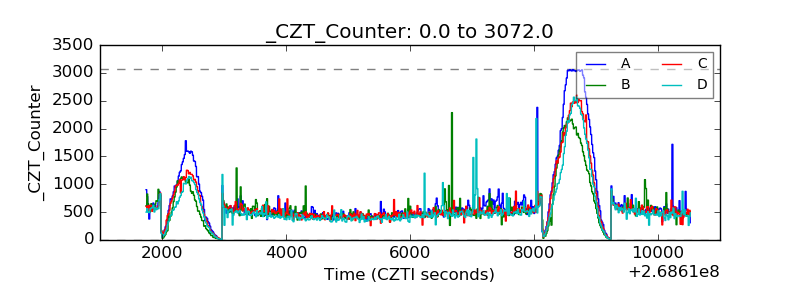 |
| +2.5 Volts monitor |  |
| +5 Volts monitor |  |
| _ROLL_ROT | 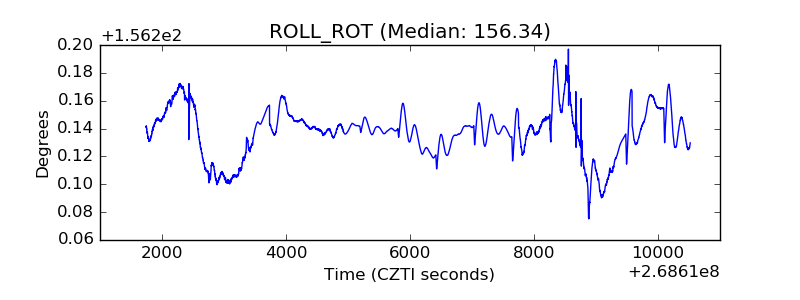 |
| _Roll_DEC | 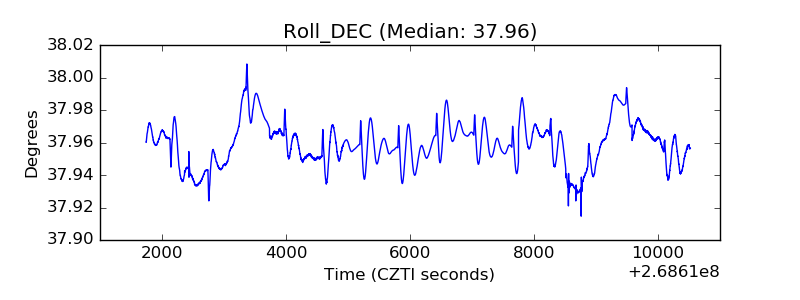 |
| _Roll_RA | 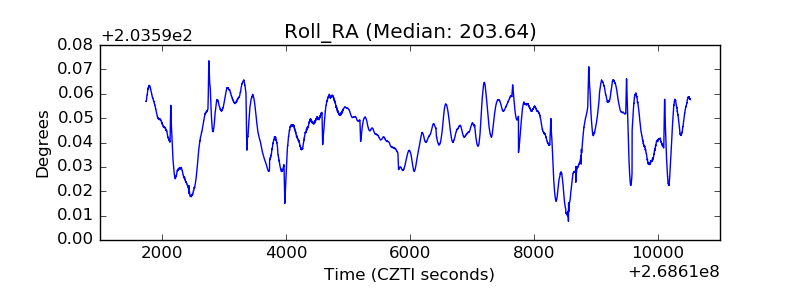 |
| Veto Counter | 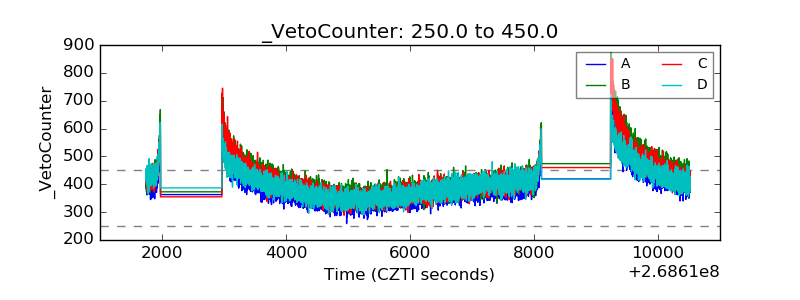 |