| Param | Original file | Final file |
|---|---|---|
| Filename | modeM0/AS1T02_056T01_9000002210_14993cztM0_level2.evt | modeM0/AS1T02_056T01_9000002210_14993cztM0_level2_quad_clean.evt |
| Size (bytes) | 469,166,400 | 72,930,240 |
| Size | 447.4 MB | 69.6 MB |
| Events in quadrant A | 3,654,213 | 441,204 |
| Events in quadrant B | 3,440,802 | 450,970 |
| Events in quadrant C | 3,419,132 | 432,940 |
| Events in quadrant D | 3,241,889 | 418,408 |
| Mode M0 | |||
|---|---|---|---|
| Quadrant | BADHDUFLAG | Total packets | Discarded packets |
| A | 0 | 15014 | 3 |
| B | 0 | 14316 | 2 |
| C | 0 | 14036 | 2 |
| D | 0 | 14074 | 2 |
| Mode M9 | |||
|---|---|---|---|
| Quadrant | BADHDUFLAG | Total packets | Discarded packets |
| A | 0 | 17 | 0 |
| B | 0 | 17 | 0 |
| C | 0 | 17 | 0 |
| D | 0 | 18 | 0 |
| Mode SS | |||
|---|---|---|---|
| Quadrant | BADHDUFLAG | Total packets | Discarded packets |
| A | 0 | 136 | 0 |
| B | 0 | 136 | 0 |
| C | 0 | 136 | 0 |
| D | 0 | 136 | 0 |
| Quadrant | Total seconds | Saturated seconds | Saturation percentage |
|---|---|---|---|
| A | 6663 | 75 | 1.125619% |
| B | 6663 | 80 | 1.200660% |
| C | 6663 | 46 | 0.690380% |
| D | 6663 | 63 | 0.945520% |
Noise dominated data is calculated using 1-second bins in cleaned event files. If a bin has >2000 counts, and if more than 50% of those come from <1% of pixels, then it is considered to be noise-dominated and hence unusable.
| Quadrant | # 1 sec bins | Bins with >0 counts | Bins with >2000 counts | High rate bins dominated by noise | Noise dominated (total time) | Noise dominated (detector-on time) | Marked lightcurve |
|---|---|---|---|---|---|---|---|
| A | 7834 | 6664 | 1 | 1 | 0.01% | 0.02% | 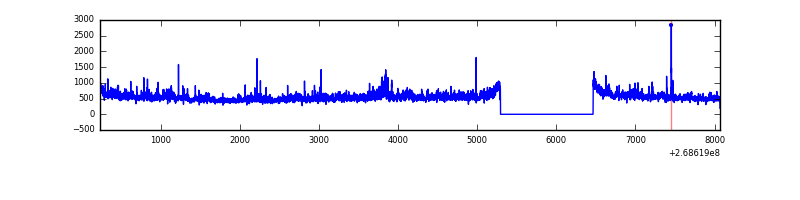 |
| B | 7834 | 6665 | 1 | 1 | 0.01% | 0.02% | 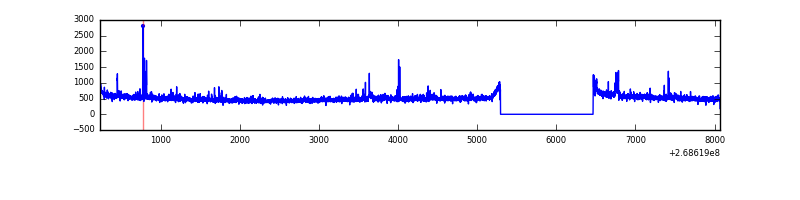 |
| C | 7834 | 6665 | 0 | 0 | 0.00% | 0.00% | 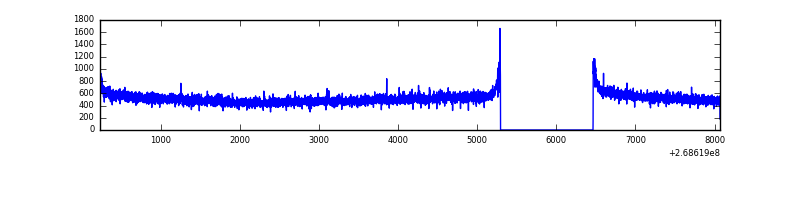 |
| D | 7834 | 6665 | 17 | 17 | 0.22% | 0.26% | 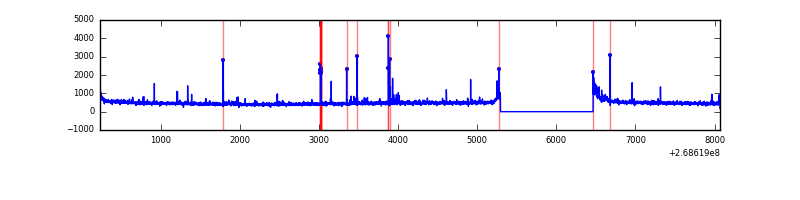 |
Top three noisy pixels from each quadrant. If the there are fewer than three noisy pixels in the level2.evt file, extra rows are filled as -1
| Pixel properties | Quadrant properties | ||||||
|---|---|---|---|---|---|---|---|
| Quadrant | DetID | PixID | Counts | Sigma | Mean | Median | Sigma |
| A | 1 | 162 | 155150 | 902.74 | 847 | 831 | 170.9 |
| A | 1 | 178 | 73151 | 423.06 | 847 | 831 | 170.9 |
| A | 1 | 161 | 64554 | 372.77 | 847 | 831 | 170.9 |
| B | 0 | 229 | 84629 | 527.03 | 849 | 829 | 159.0 |
| B | 12 | 111 | 18094 | 108.58 | 849 | 829 | 159.0 |
| B | 11 | 111 | 15285 | 90.91 | 849 | 829 | 159.0 |
| C | 3 | 233 | 234460 | 1247.88 | 815 | 821 | 187.2 |
| C | 13 | 61 | 5977 | 27.54 | 815 | 821 | 187.2 |
| C | 3 | 232 | 2775 | 10.44 | 815 | 821 | 187.2 |
| D | 13 | 249 | 47642 | 238.37 | 807 | 788 | 196.6 |
| D | 7 | 223 | 40588 | 202.48 | 807 | 788 | 196.6 |
| D | 2 | 234 | 26513 | 130.88 | 807 | 788 | 196.6 |
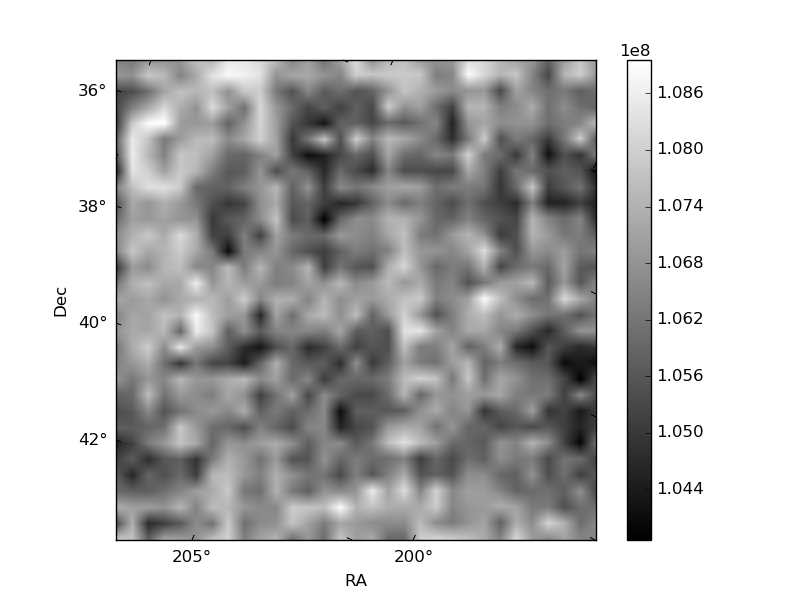
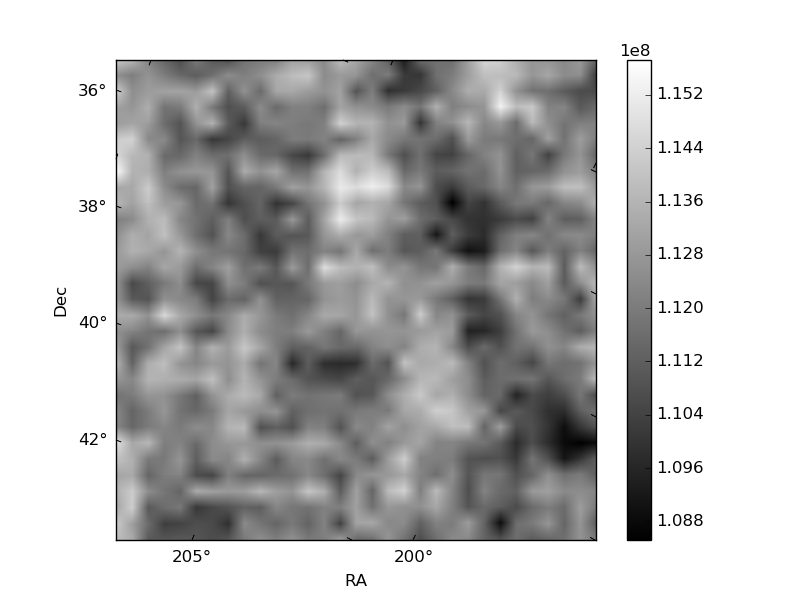
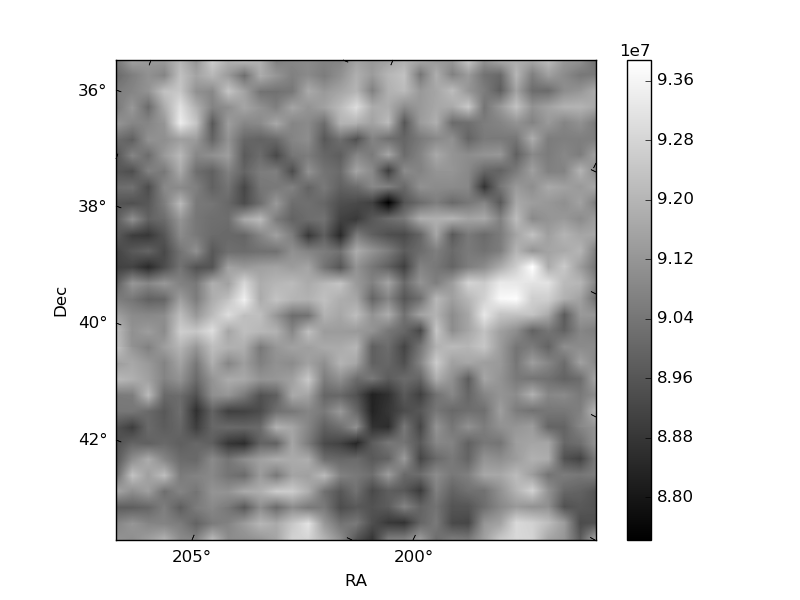
Histogram calculated using DETX and DETY for each event in the final _common_clean file
| Quadrant A | 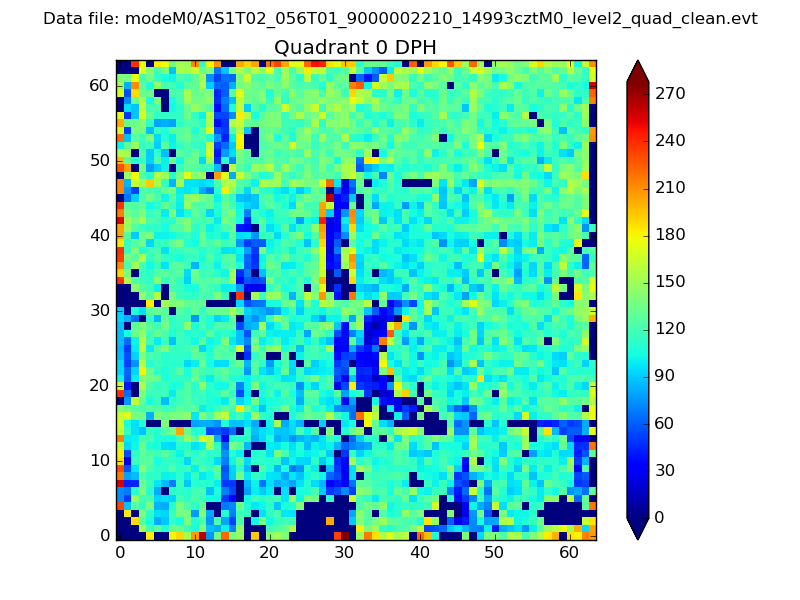 |
 |
Quadrant B |
|---|---|---|---|
| Quadrant D |  |
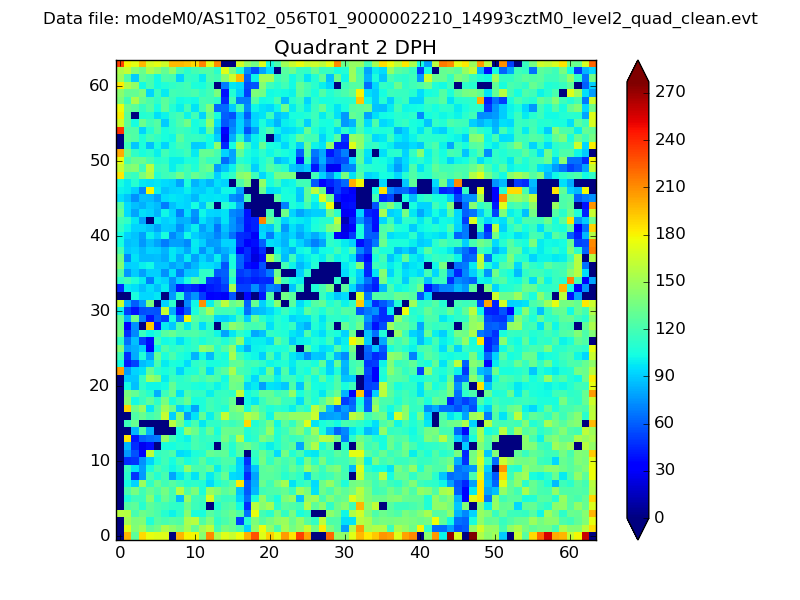 |
Quadrant C |
| Plot type | Count rate plots | Images |
|---|---|---|
| Comparison with Poisson distribution Blue bars denote a histogram of data divided into 1 sec bins. Red curve is a Poisson curve with rate = median count rate of data. |
 |
 |
| Quadrant-wise count rates Data is divided into 100 sec bins |
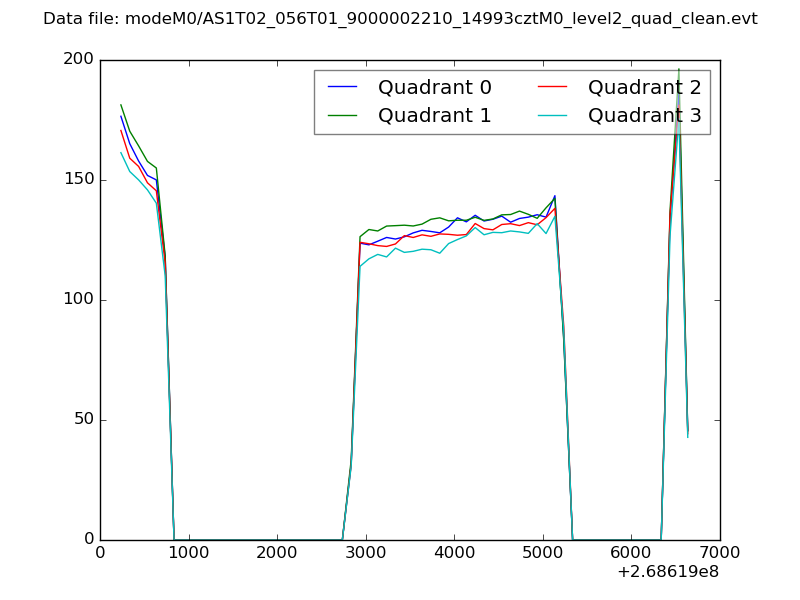 |
|
| Module-wise count rates for Quadrant A Data is divided into 100 sec bins |
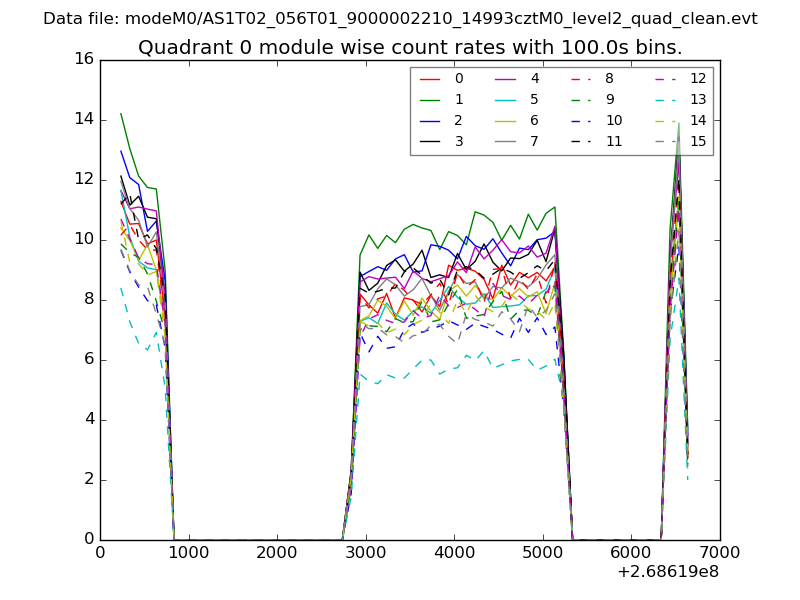 |
 |
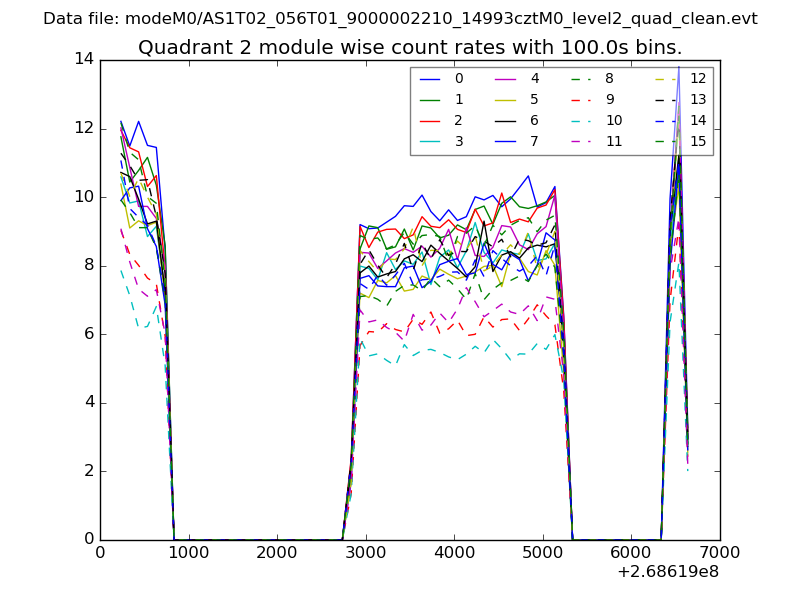
| Module-wise count rates for Quadrant B Data is divided into 100 sec bins |
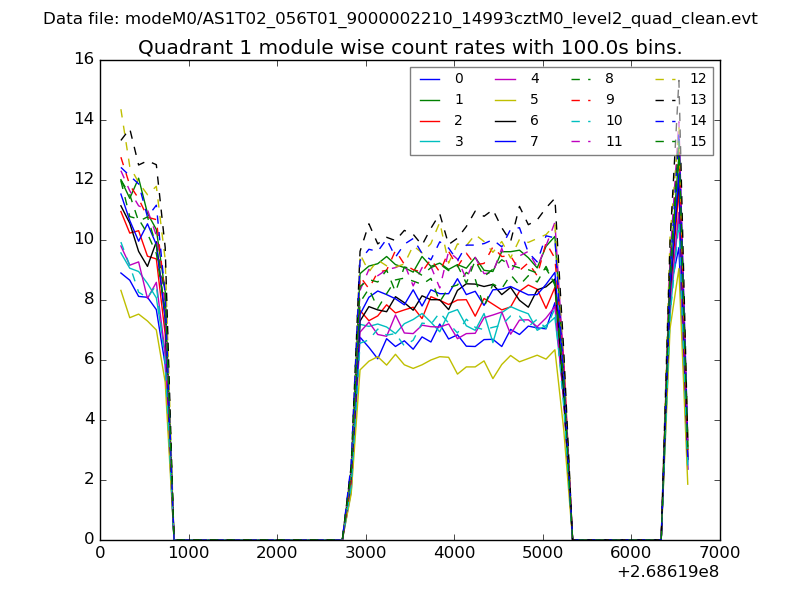 |
 |
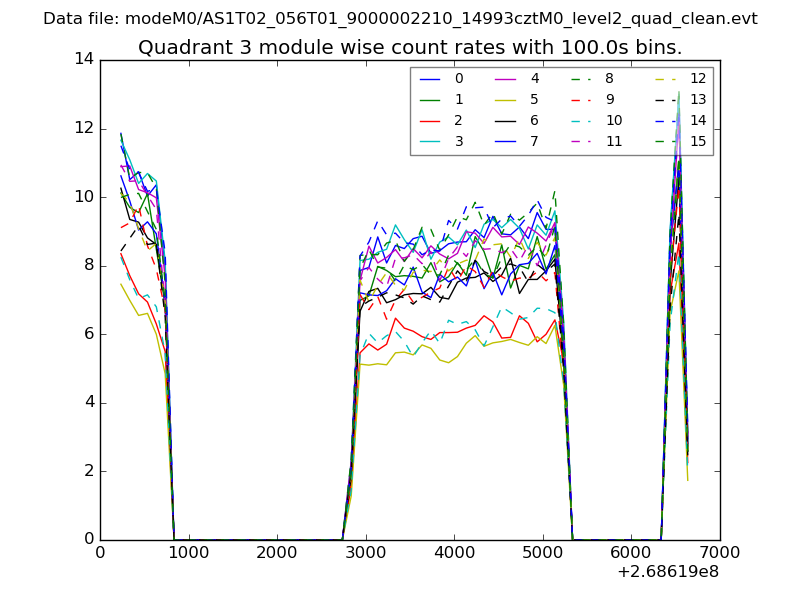
| Module-wise count rates for Quadrant C Data is divided into 100 sec bins |
 |
 |
| Module-wise count rates for Quadrant D Data is divided into 100 sec bins |
 |
 |
| Parameter | Plot |
|---|---|
| CZT HV Monitor | 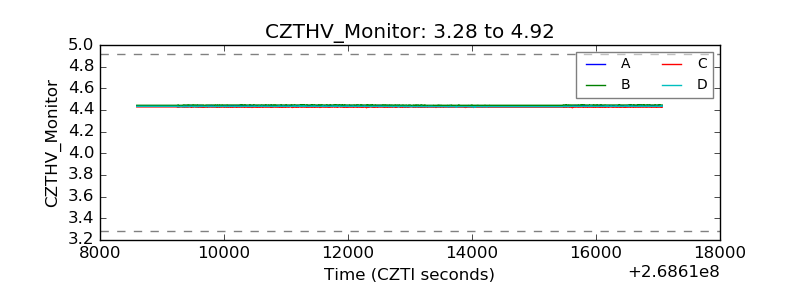 |
| D_VDD | 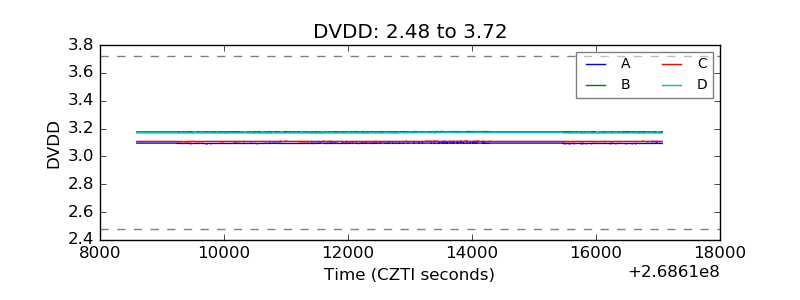 |
| Temperature 1 | 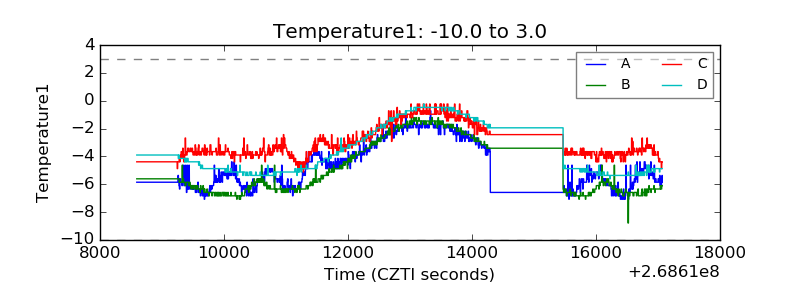 |
| Veto HV Monitor | 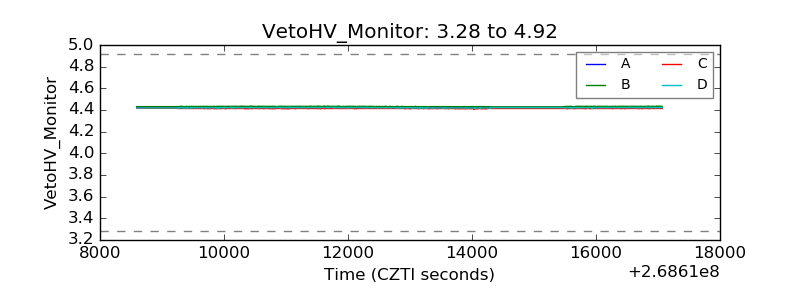 |
| Veto LLD | 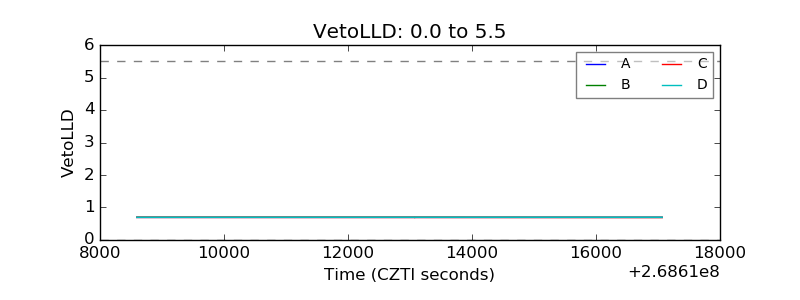 |
| Alpha Counter | 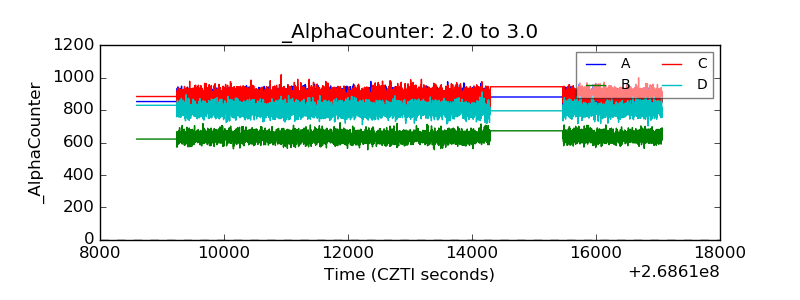 |
| _CPM_Rate | 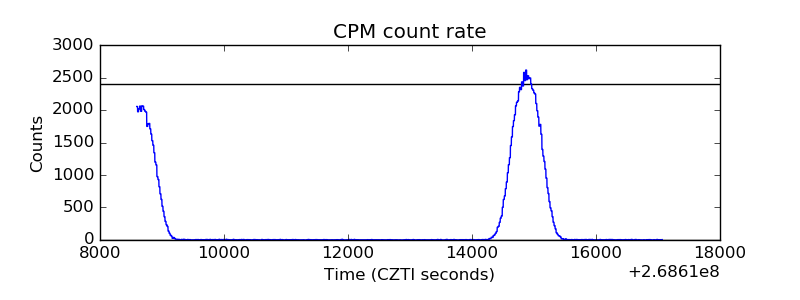 |
| CZT Counter | 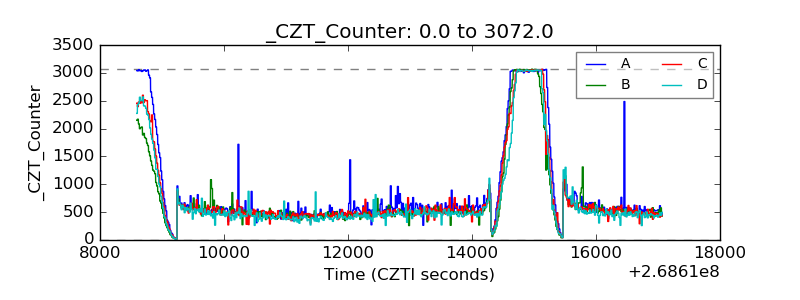 |
| +2.5 Volts monitor |  |
| +5 Volts monitor |  |
| _ROLL_ROT | 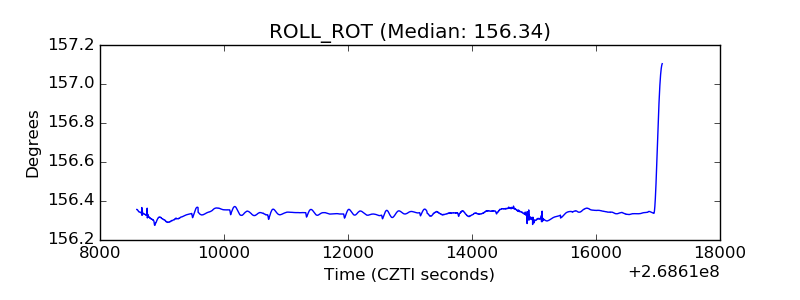 |
| _Roll_DEC | 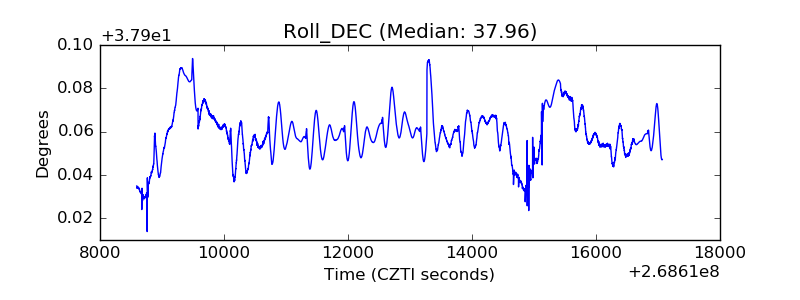 |
| _Roll_RA | 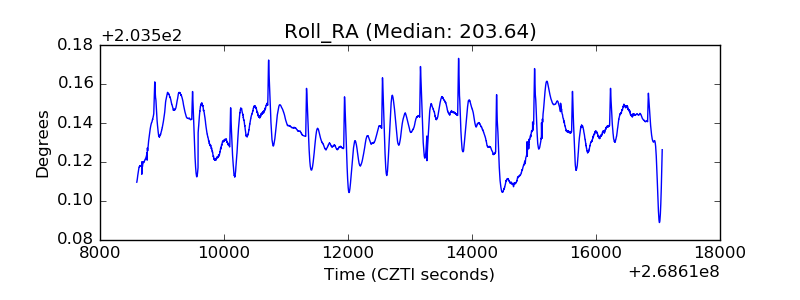 |
| Veto Counter | 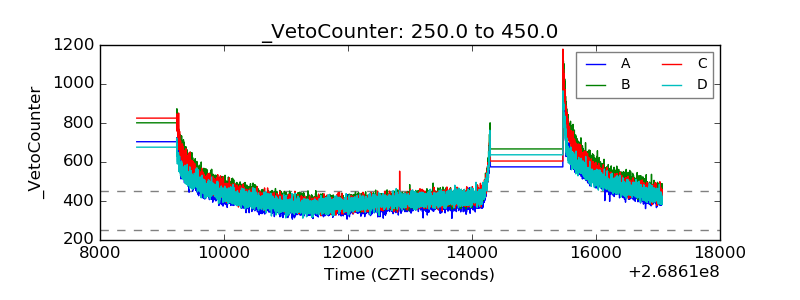 |