| Param | Original file | Final file |
|---|---|---|
| Filename | modeM0/AS1T02_056T01_9000002210_14994cztM0_level2.evt | modeM0/AS1T02_056T01_9000002210_14994cztM0_level2_quad_clean.evt |
| Size (bytes) | 465,065,280 | 61,937,280 |
| Size | 443.5 MB | 59.1 MB |
| Events in quadrant A | 3,304,617 | 368,102 |
| Events in quadrant B | 3,450,509 | 368,536 |
| Events in quadrant C | 3,238,332 | 359,570 |
| Events in quadrant D | 3,670,399 | 346,482 |
| Mode M0 | |||
|---|---|---|---|
| Quadrant | BADHDUFLAG | Total packets | Discarded packets |
| A | 0 | 13479 | 2 |
| B | 0 | 13988 | 1 |
| C | 0 | 13155 | 1 |
| D | 0 | 14756 | 1 |
| Mode M9 | |||
|---|---|---|---|
| Quadrant | BADHDUFLAG | Total packets | Discarded packets |
| A | 0 | 13 | 0 |
| B | 0 | 13 | 0 |
| C | 0 | 13 | 0 |
| D | 0 | 13 | 0 |
| Mode SS | |||
|---|---|---|---|
| Quadrant | BADHDUFLAG | Total packets | Discarded packets |
| A | 0 | 126 | 0 |
| B | 0 | 126 | 0 |
| C | 0 | 126 | 0 |
| D | 0 | 126 | 0 |
| Quadrant | Total seconds | Saturated seconds | Saturation percentage |
|---|---|---|---|
| A | 6195 | 52 | 0.839387% |
| B | 6195 | 115 | 1.856336% |
| C | 6195 | 31 | 0.500404% |
| D | 6195 | 273 | 4.406780% |
Noise dominated data is calculated using 1-second bins in cleaned event files. If a bin has >2000 counts, and if more than 50% of those come from <1% of pixels, then it is considered to be noise-dominated and hence unusable.
| Quadrant | # 1 sec bins | Bins with >0 counts | Bins with >2000 counts | High rate bins dominated by noise | Noise dominated (total time) | Noise dominated (detector-on time) | Marked lightcurve |
|---|---|---|---|---|---|---|---|
| A | 7476 | 6197 | 2 | 2 | 0.03% | 0.03% | 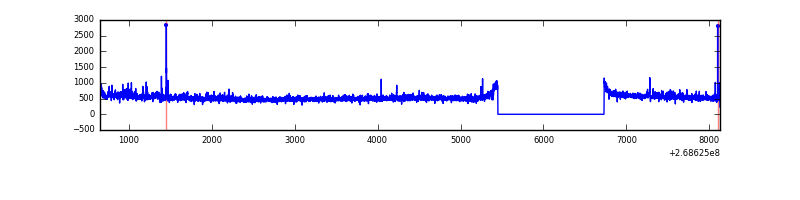 |
| B | 7476 | 6196 | 42 | 42 | 0.56% | 0.68% | 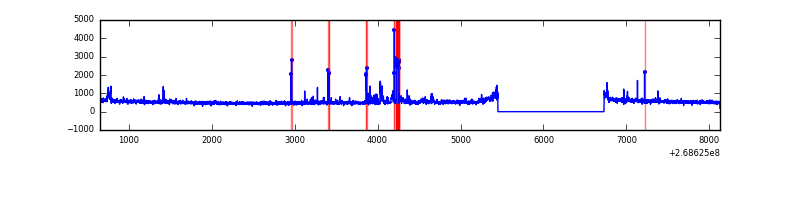 |
| C | 7476 | 6197 | 0 | 0 | 0.00% | 0.00% | 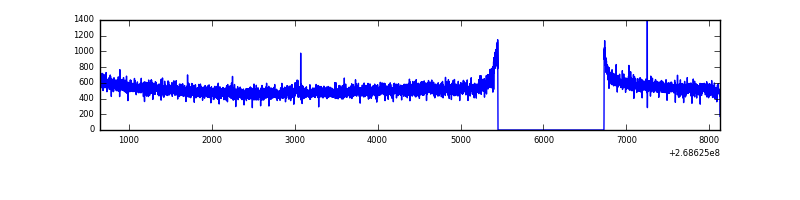 |
| D | 7476 | 6197 | 232 | 232 | 3.10% | 3.74% | 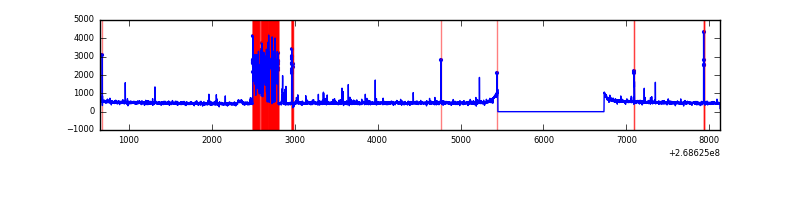 |
Top three noisy pixels from each quadrant. If the there are fewer than three noisy pixels in the level2.evt file, extra rows are filled as -1
| Pixel properties | Quadrant properties | ||||||
|---|---|---|---|---|---|---|---|
| Quadrant | DetID | PixID | Counts | Sigma | Mean | Median | Sigma |
| A | 1 | 162 | 53422 | 322.26 | 815 | 803 | 163.3 |
| A | 12 | 189 | 52205 | 314.81 | 815 | 803 | 163.3 |
| A | 1 | 178 | 21629 | 127.55 | 815 | 803 | 163.3 |
| B | 10 | 16 | 209025 | 1365.82 | 813 | 795 | 152.5 |
| B | 0 | 229 | 36899 | 236.81 | 813 | 795 | 152.5 |
| B | 4 | 80 | 17702 | 110.9 | 813 | 795 | 152.5 |
| C | 3 | 233 | 201619 | 1127.85 | 778 | 784 | 178.1 |
| C | 13 | 61 | 5683 | 27.51 | 778 | 784 | 178.1 |
| C | 3 | 234 | 2330 | 8.68 | 778 | 784 | 178.1 |
| D | 15 | 0 | 651938 | 3573.94 | 763 | 744 | 182.2 |
| D | 10 | 70 | 30923 | 165.63 | 763 | 744 | 182.2 |
| D | 13 | 104 | 25504 | 135.89 | 763 | 744 | 182.2 |
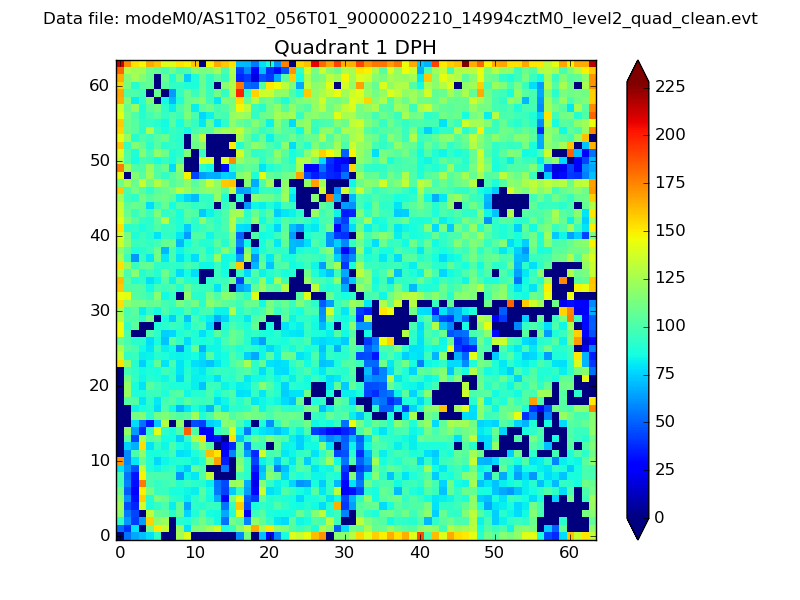
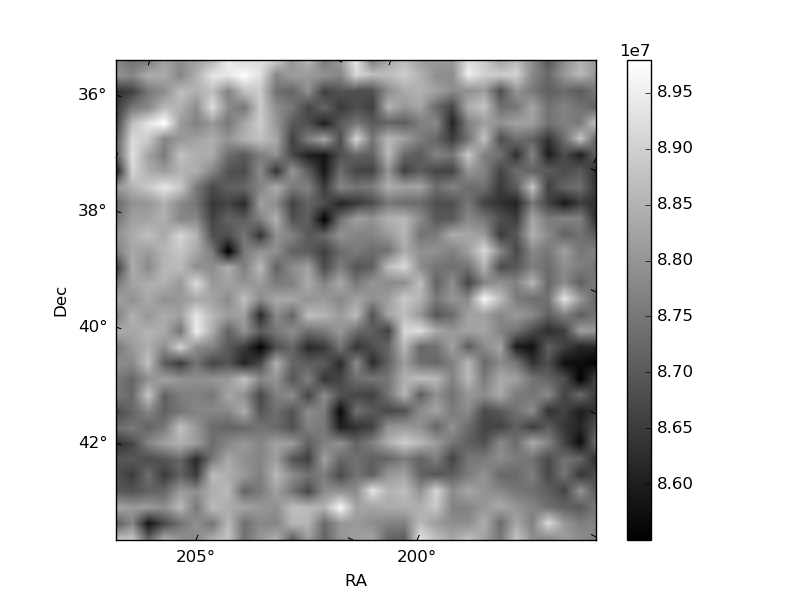
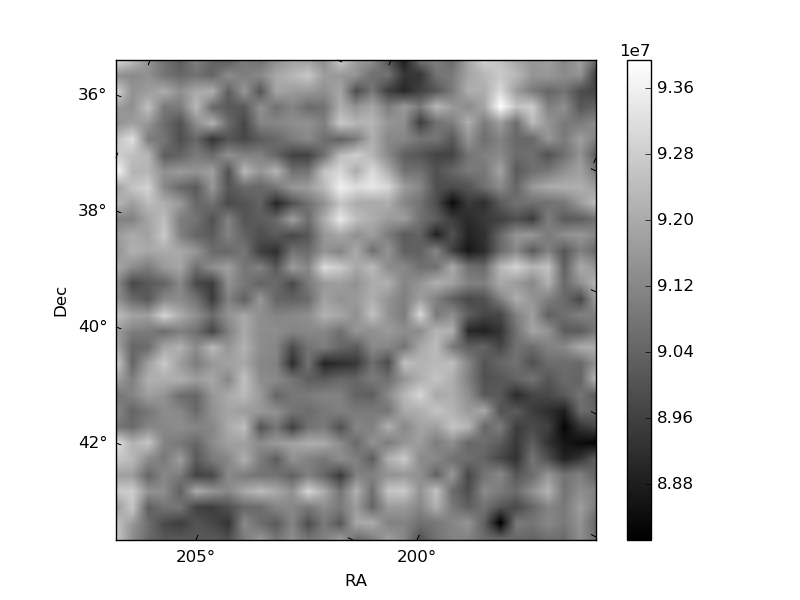
Histogram calculated using DETX and DETY for each event in the final _common_clean file
| Quadrant A |  |
 |
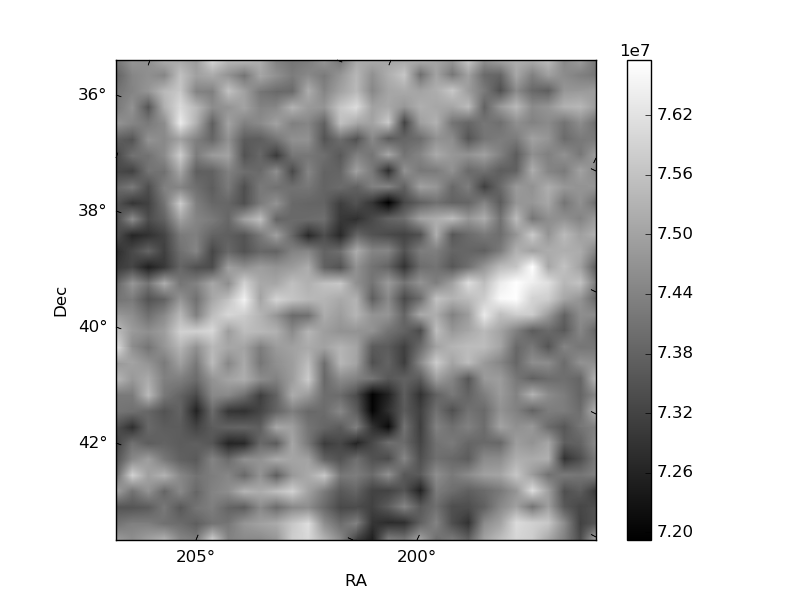
Quadrant B |
|---|---|---|---|
| Quadrant D | 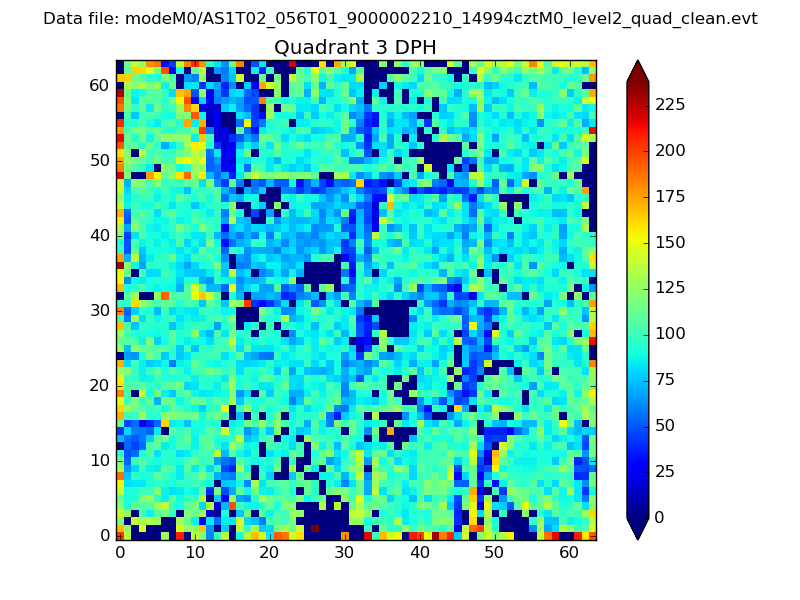 |
 |
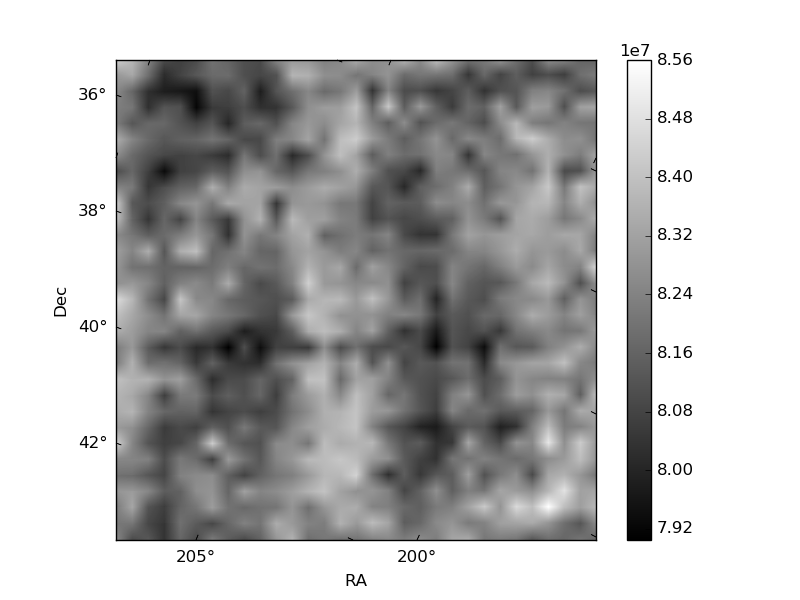
Quadrant C |
| Plot type | Count rate plots | Images |
|---|---|---|
| Comparison with Poisson distribution Blue bars denote a histogram of data divided into 1 sec bins. Red curve is a Poisson curve with rate = median count rate of data. |
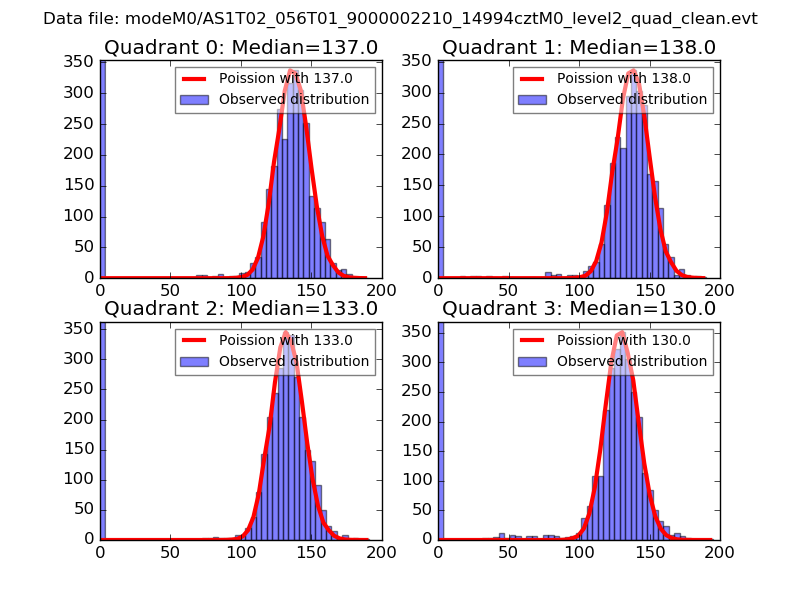 |
 |
| Quadrant-wise count rates Data is divided into 100 sec bins |
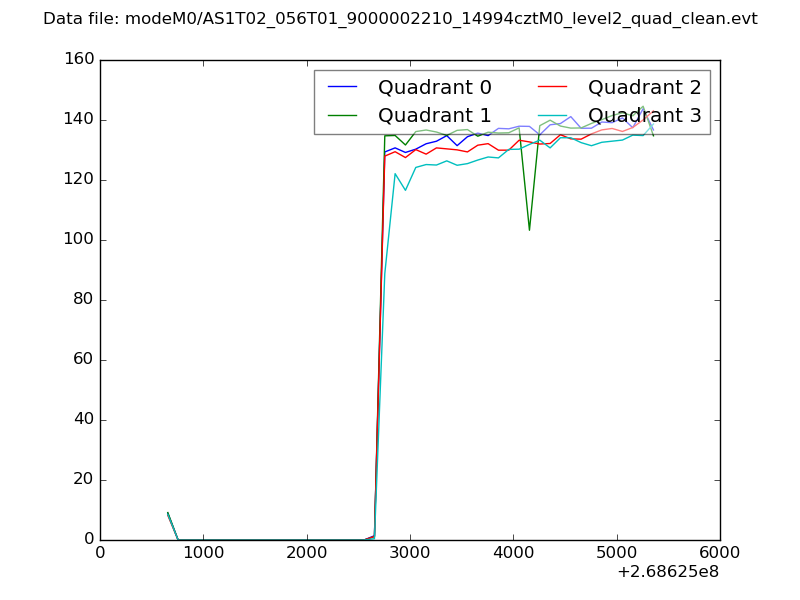 |
|
| Module-wise count rates for Quadrant A Data is divided into 100 sec bins |
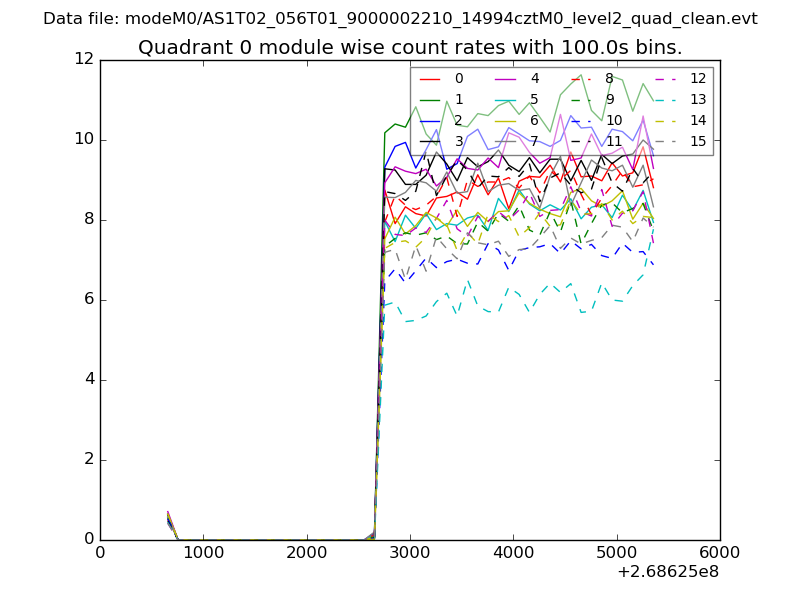 |
 |
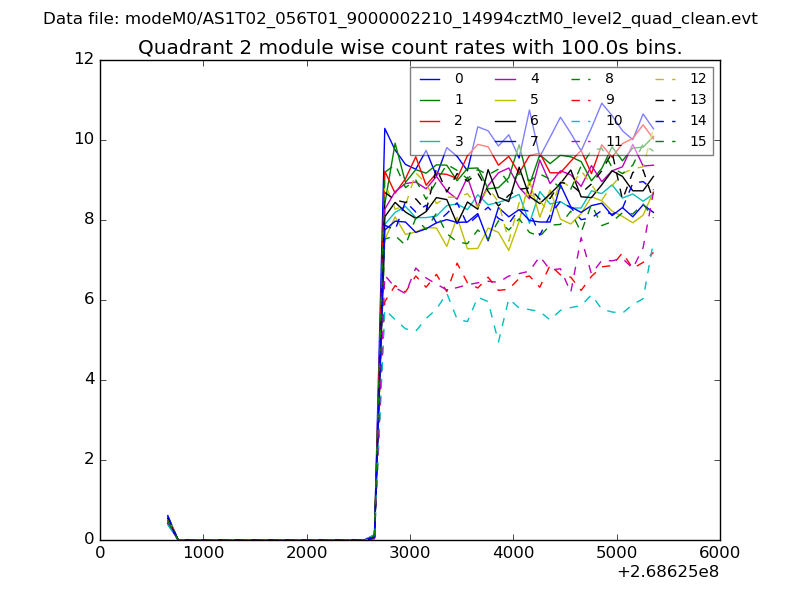
| Module-wise count rates for Quadrant B Data is divided into 100 sec bins |
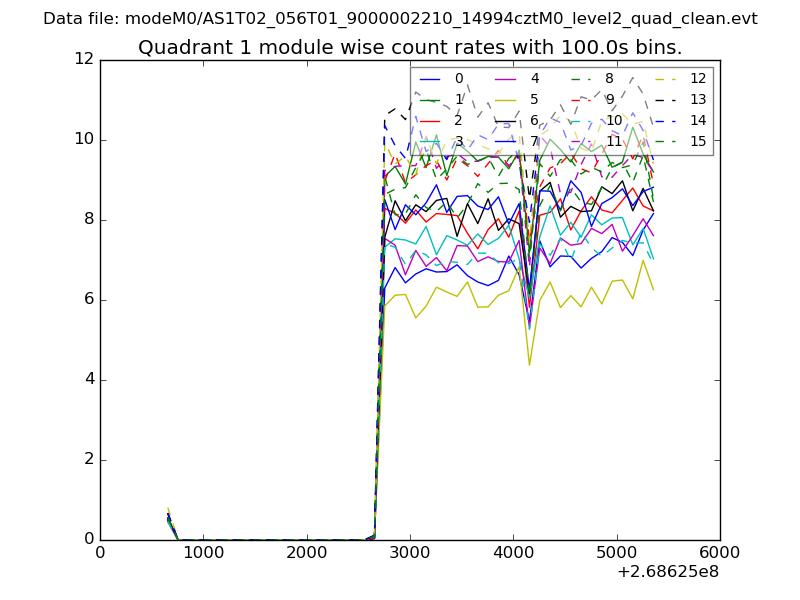 |
 |
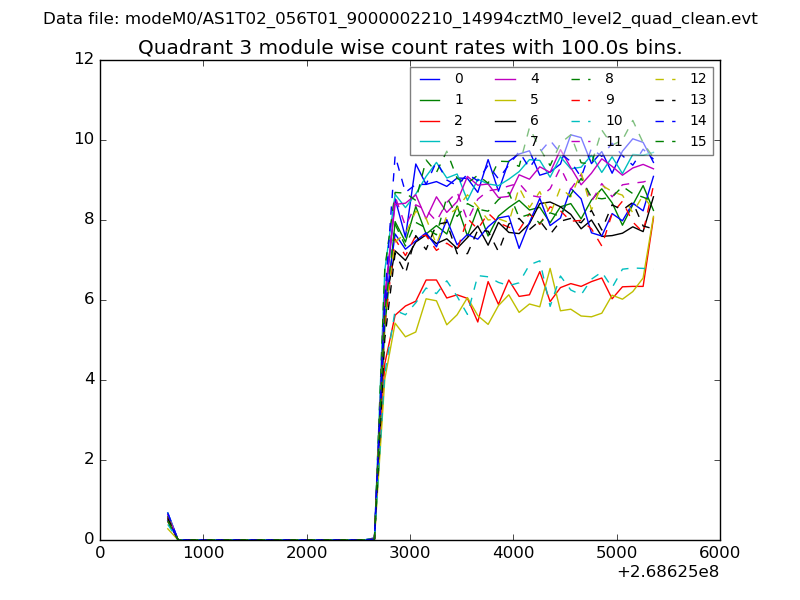
| Module-wise count rates for Quadrant C Data is divided into 100 sec bins |
 |
 |
| Module-wise count rates for Quadrant D Data is divided into 100 sec bins |
 |
 |
| Parameter | Plot |
|---|---|
| CZT HV Monitor | 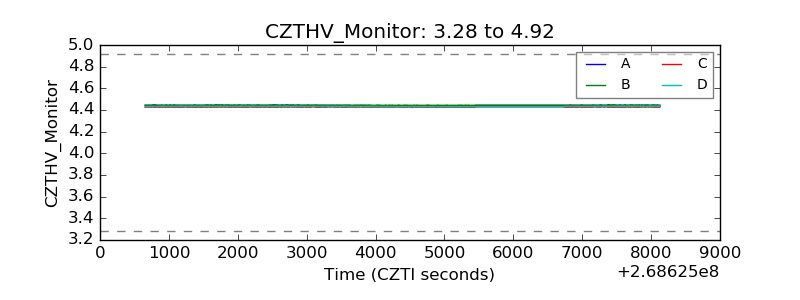 |
| D_VDD | 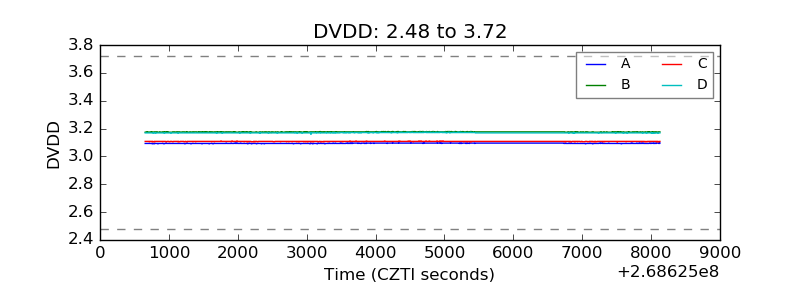 |
| Temperature 1 | 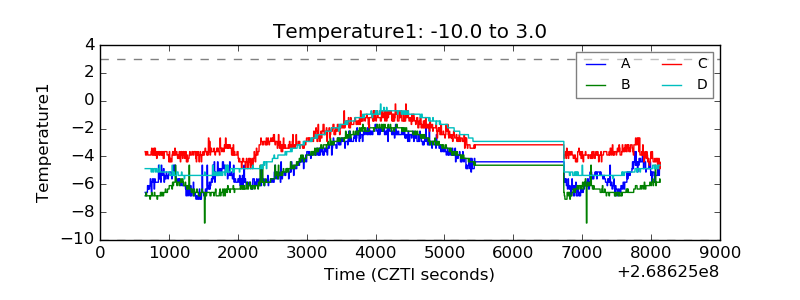 |
| Veto HV Monitor | 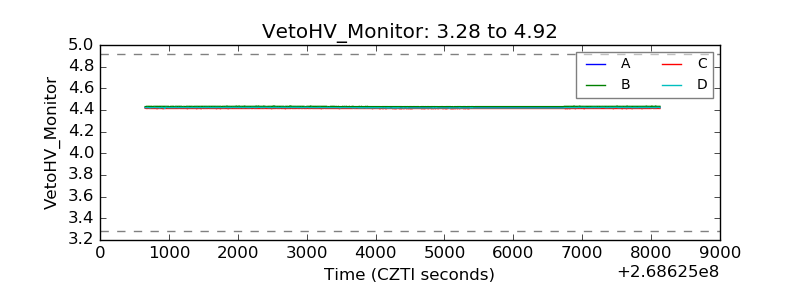 |
| Veto LLD | 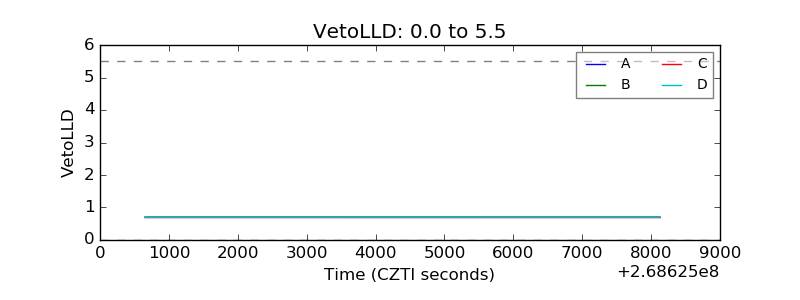 |
| Alpha Counter | 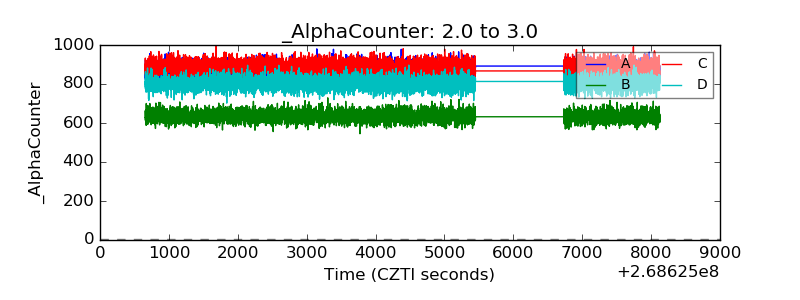 |
| _CPM_Rate | 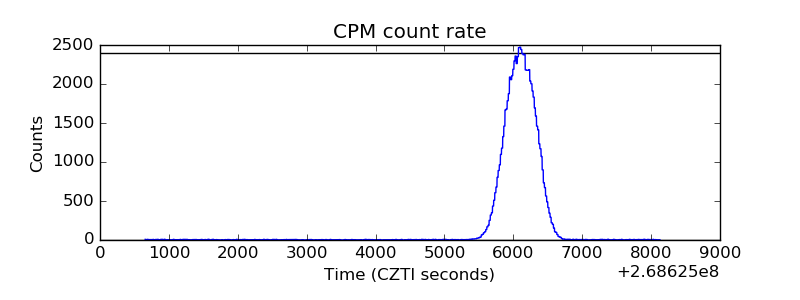 |
| CZT Counter |  |
| +2.5 Volts monitor |  |
| +5 Volts monitor | 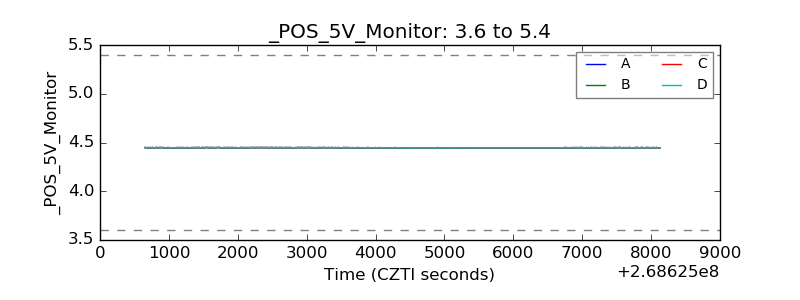 |
| _ROLL_ROT | 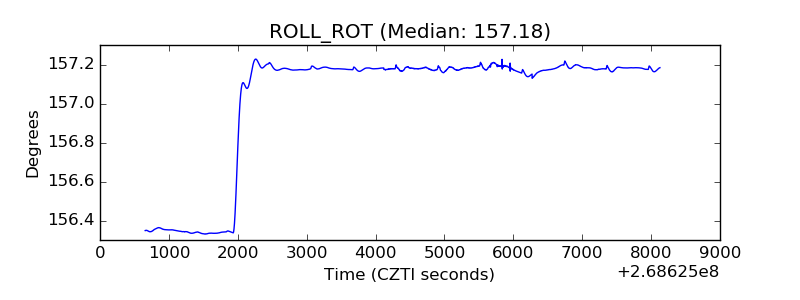 |
| _Roll_DEC | 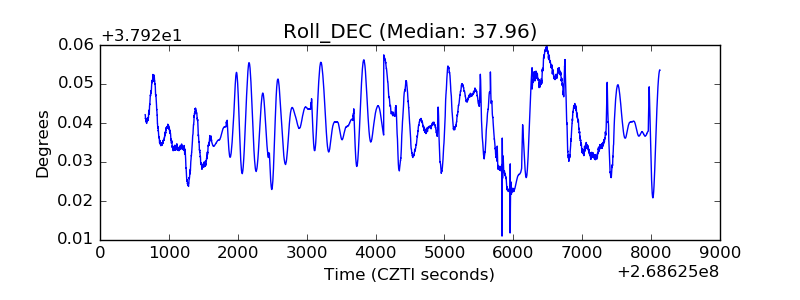 |
| _Roll_RA | 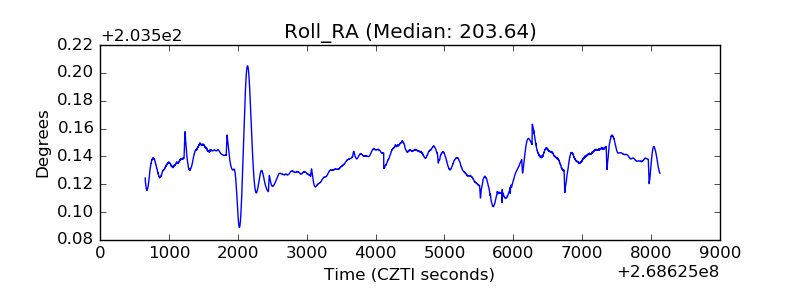 |
| Veto Counter | 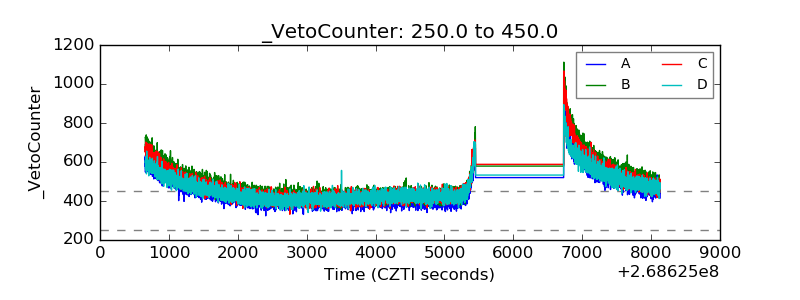 |