| Param | Original file | Final file |
|---|---|---|
| Filename | modeM0/AS1T02_056T01_9000002210_14997cztM0_level2.evt | modeM0/AS1T02_056T01_9000002210_14997cztM0_level2_quad_clean.evt |
| Size (bytes) | 477,694,080 | 93,456,000 |
| Size | 455.6 MB | 89.1 MB |
| Events in quadrant A | 3,588,581 | 603,812 |
| Events in quadrant B | 3,789,945 | 608,273 |
| Events in quadrant C | 3,442,414 | 585,631 |
| Events in quadrant D | 3,198,628 | 573,172 |
| Mode M0 | |||
|---|---|---|---|
| Quadrant | BADHDUFLAG | Total packets | Discarded packets |
| A | 0 | 14649 | 3 |
| B | 0 | 15216 | 2 |
| C | 0 | 13976 | 2 |
| D | 0 | 13801 | 2 |
| Mode M9 | |||
|---|---|---|---|
| Quadrant | BADHDUFLAG | Total packets | Discarded packets |
| A | 0 | 16 | 0 |
| B | 0 | 16 | 0 |
| C | 0 | 16 | 0 |
| D | 0 | 17 | 0 |
| Mode SS | |||
|---|---|---|---|
| Quadrant | BADHDUFLAG | Total packets | Discarded packets |
| A | 0 | 134 | 0 |
| B | 0 | 134 | 0 |
| C | 0 | 134 | 0 |
| D | 0 | 134 | 0 |
| Quadrant | Total seconds | Saturated seconds | Saturation percentage |
|---|---|---|---|
| A | 6587 | 156 | 2.368301% |
| B | 6587 | 211 | 3.203279% |
| C | 6587 | 102 | 1.548505% |
| D | 6587 | 105 | 1.594049% |
Noise dominated data is calculated using 1-second bins in cleaned event files. If a bin has >2000 counts, and if more than 50% of those come from <1% of pixels, then it is considered to be noise-dominated and hence unusable.
| Quadrant | # 1 sec bins | Bins with >0 counts | Bins with >2000 counts | High rate bins dominated by noise | Noise dominated (total time) | Noise dominated (detector-on time) | Marked lightcurve |
|---|---|---|---|---|---|---|---|
| A | 7648 | 6588 | 1 | 1 | 0.01% | 0.02% | 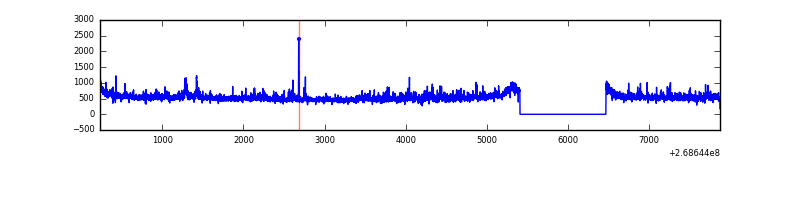 |
| B | 7648 | 6588 | 41 | 41 | 0.54% | 0.62% | 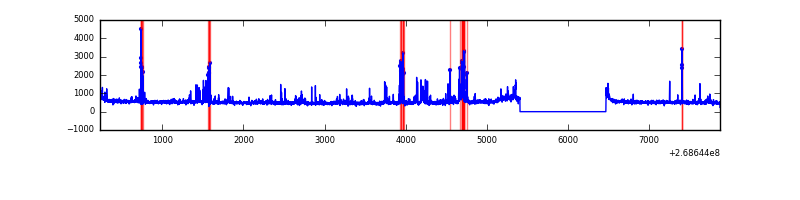 |
| C | 7648 | 6589 | 3 | 3 | 0.04% | 0.05% | 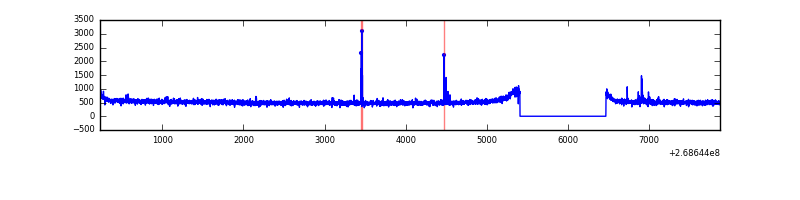 |
| D | 7648 | 6588 | 4 | 4 | 0.05% | 0.06% | 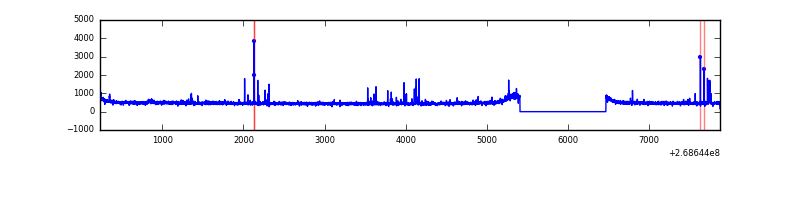 |
Top three noisy pixels from each quadrant. If the there are fewer than three noisy pixels in the level2.evt file, extra rows are filled as -1
| Pixel properties | Quadrant properties | ||||||
|---|---|---|---|---|---|---|---|
| Quadrant | DetID | PixID | Counts | Sigma | Mean | Median | Sigma |
| A | 1 | 162 | 109303 | 632.64 | 848 | 829 | 171.5 |
| A | 12 | 189 | 92379 | 533.93 | 848 | 829 | 171.5 |
| A | 1 | 178 | 47476 | 272.05 | 848 | 829 | 171.5 |
| B | 3 | 64 | 195870 | 1222.94 | 837 | 815 | 159.5 |
| B | 0 | 229 | 122717 | 764.29 | 837 | 815 | 159.5 |
| B | 0 | 197 | 102928 | 640.22 | 837 | 815 | 159.5 |
| C | 3 | 233 | 235182 | 1250.94 | 810 | 815 | 187.4 |
| C | 10 | 22 | 32899 | 171.25 | 810 | 815 | 187.4 |
| C | 14 | 234 | 15202 | 76.79 | 810 | 815 | 187.4 |
| D | 7 | 38 | 30109 | 143.77 | 817 | 795 | 203.9 |
| D | 2 | 234 | 23117 | 109.47 | 817 | 795 | 203.9 |
| D | 13 | 104 | 17657 | 82.7 | 817 | 795 | 203.9 |
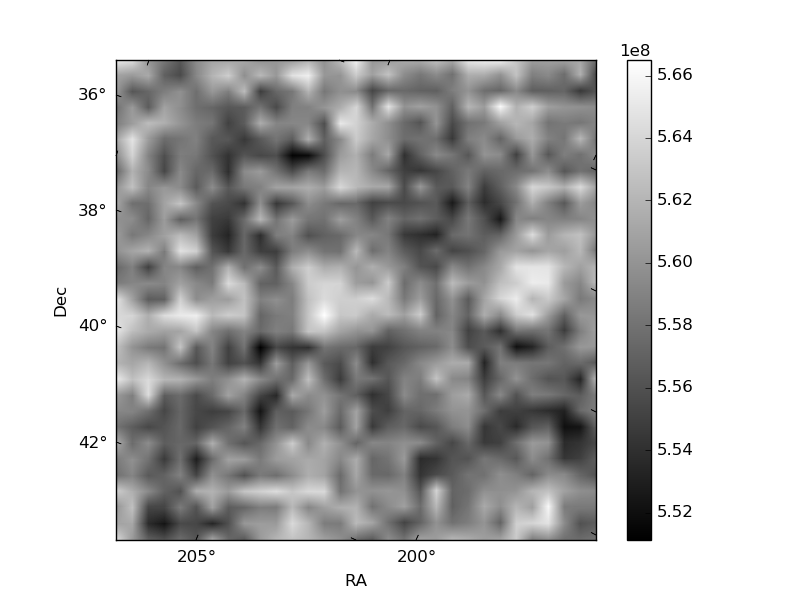
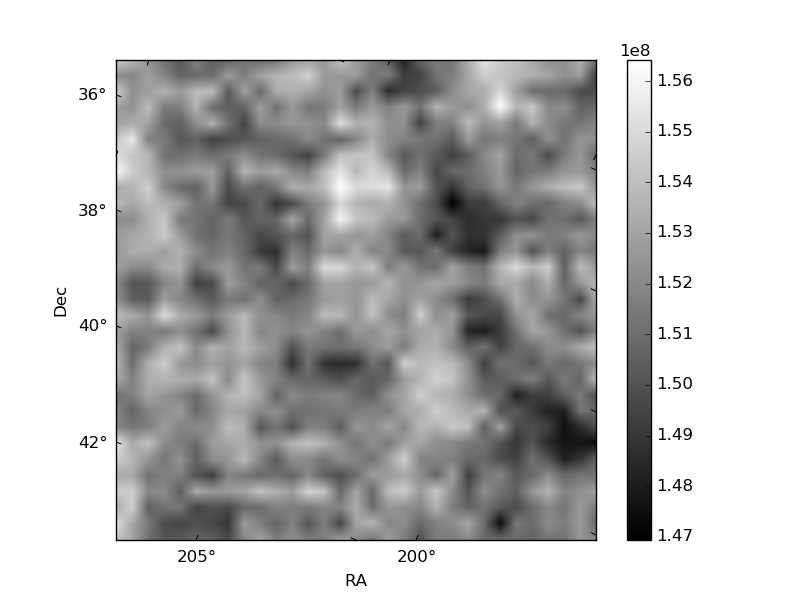
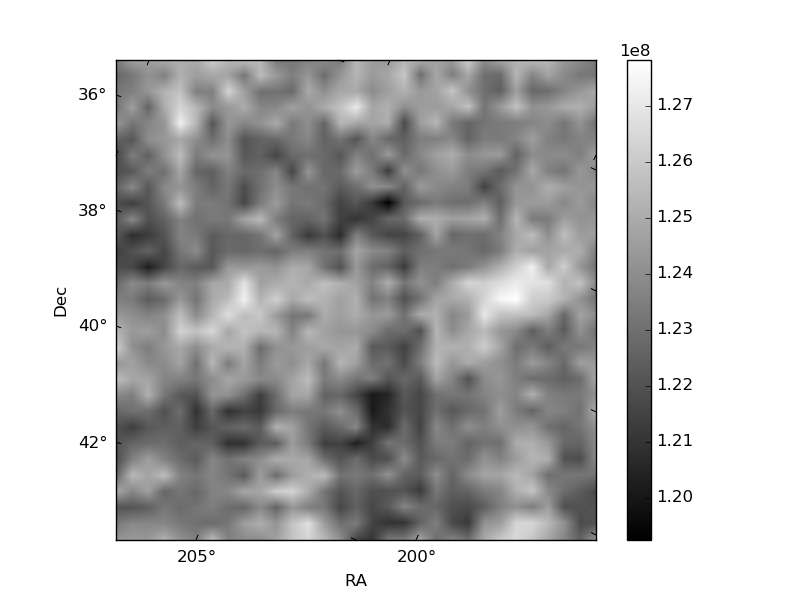
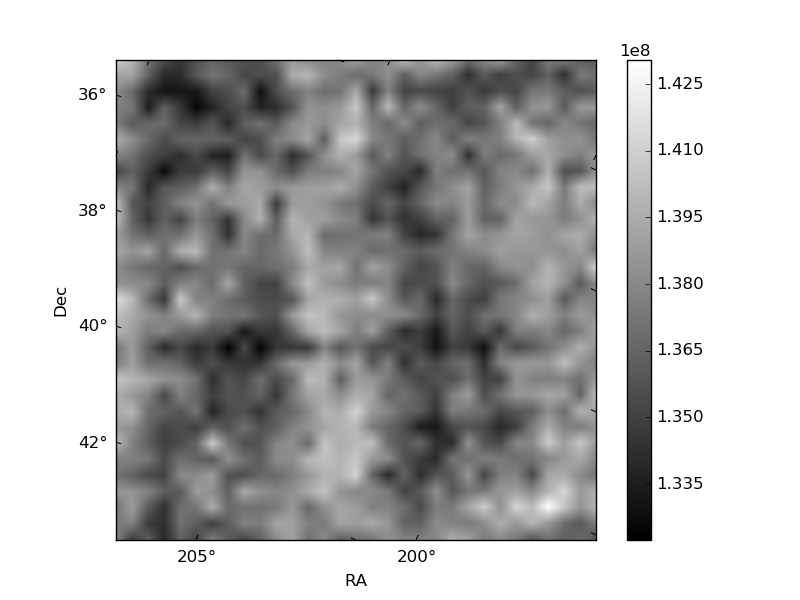
Histogram calculated using DETX and DETY for each event in the final _common_clean file
| Quadrant A | 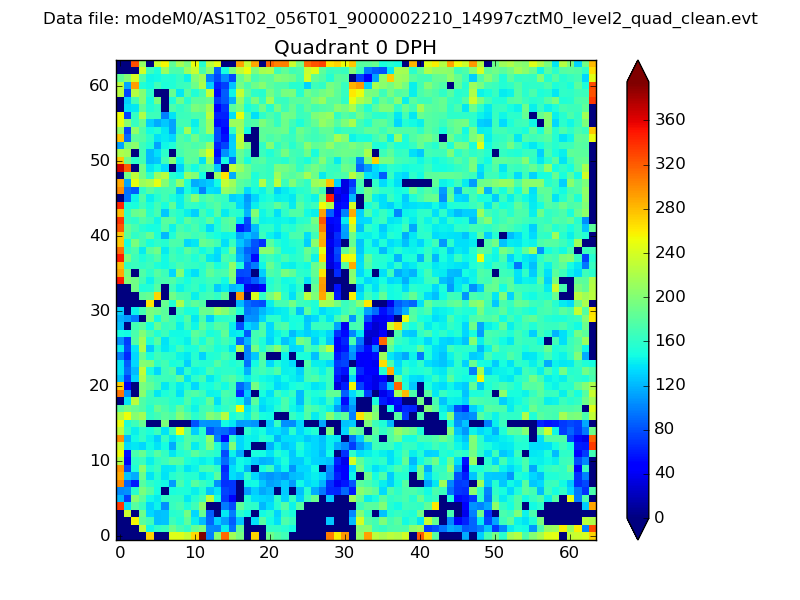 |
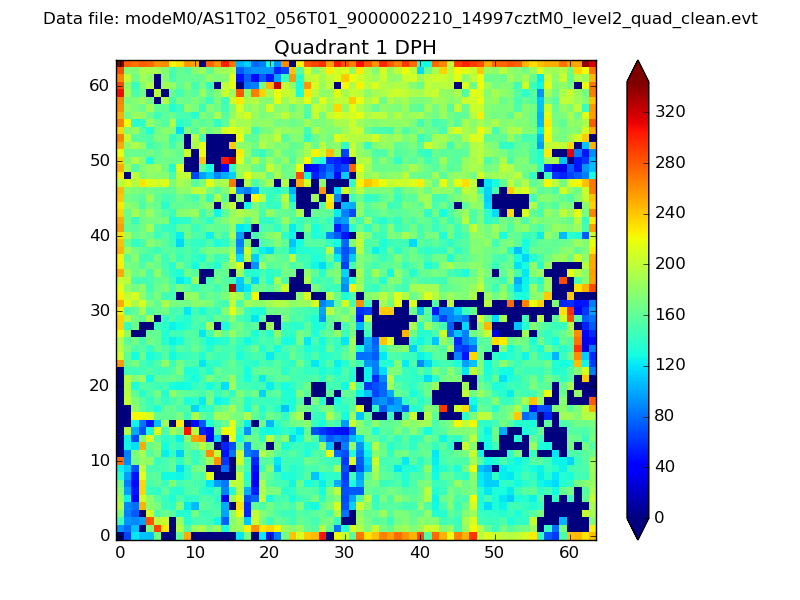 |
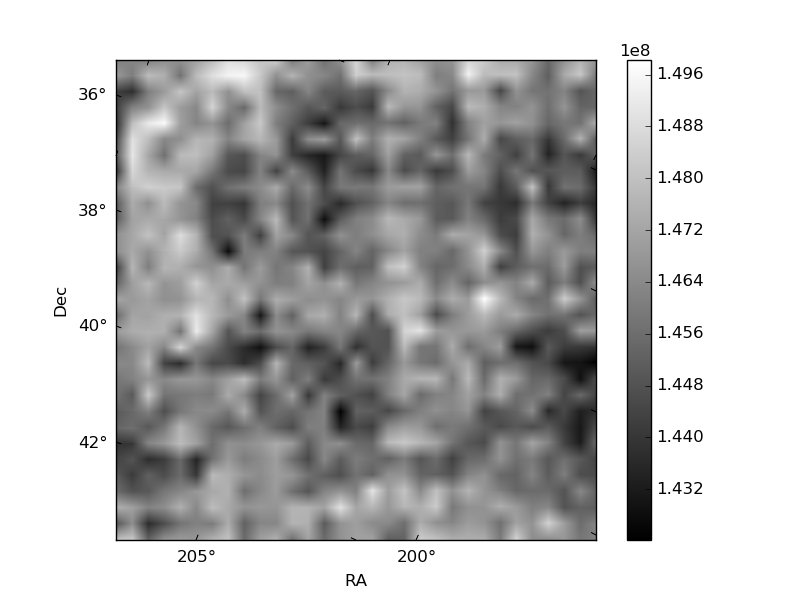
Quadrant B |
|---|---|---|---|
| Quadrant D | 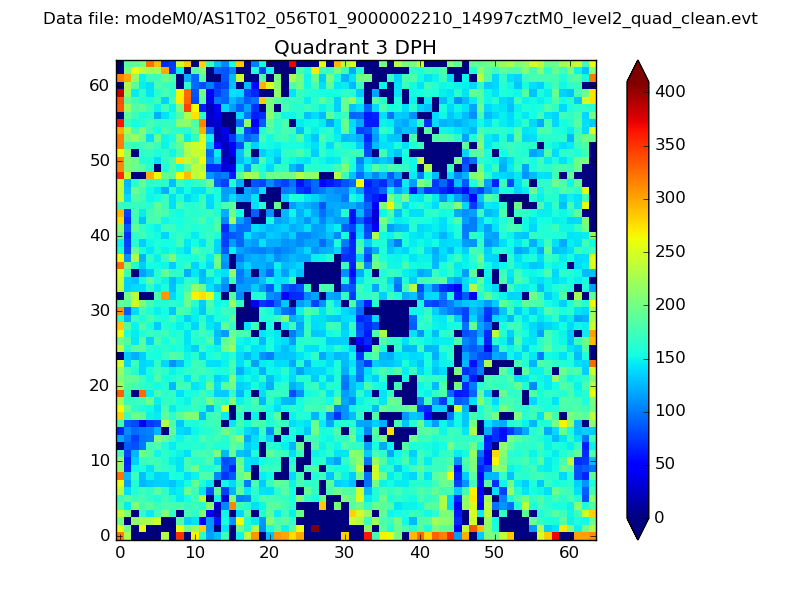 |
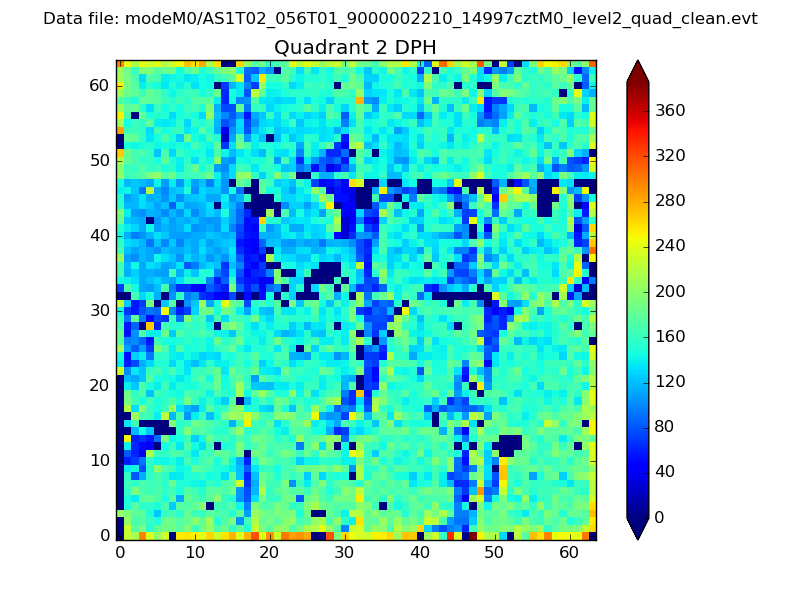 |
Quadrant C |
| Plot type | Count rate plots | Images |
|---|---|---|
| Comparison with Poisson distribution Blue bars denote a histogram of data divided into 1 sec bins. Red curve is a Poisson curve with rate = median count rate of data. |
 |
 |
| Quadrant-wise count rates Data is divided into 100 sec bins |
 |
|
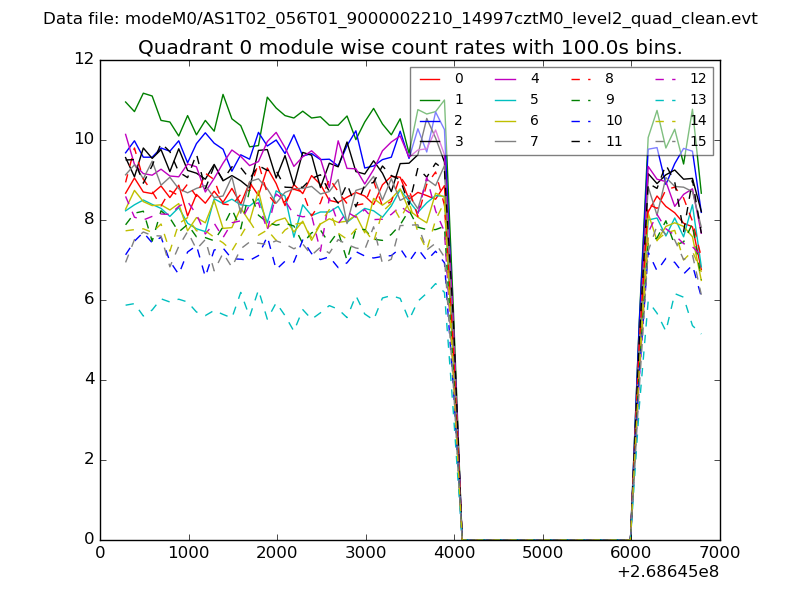
| Module-wise count rates for Quadrant A Data is divided into 100 sec bins |
 |
 |
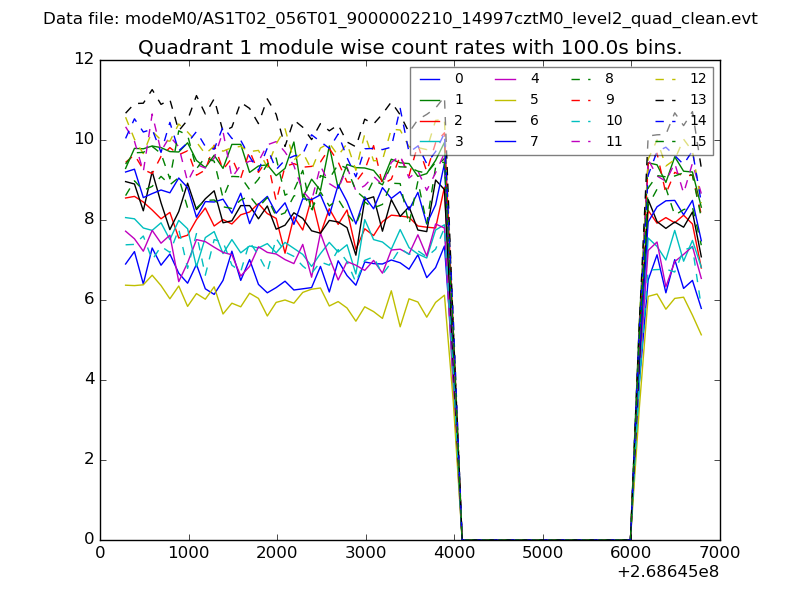
| Module-wise count rates for Quadrant B Data is divided into 100 sec bins |
 |
 |
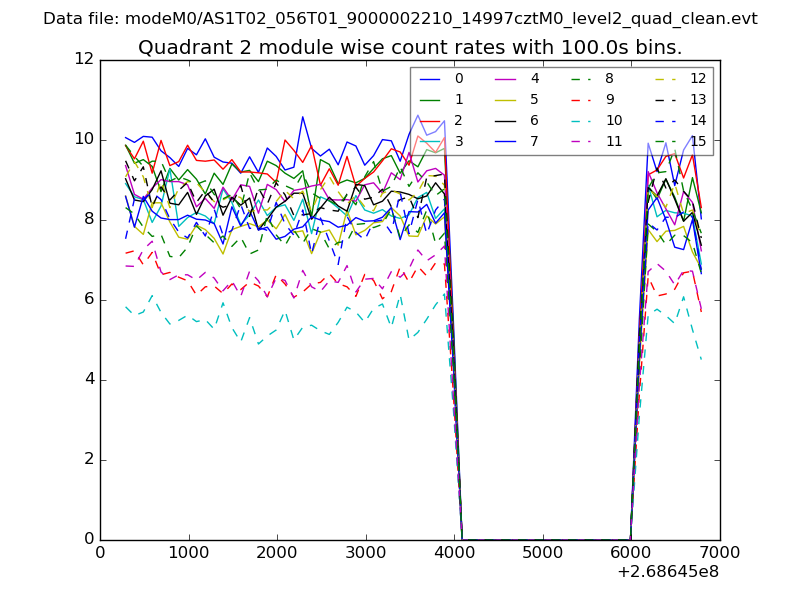
| Module-wise count rates for Quadrant C Data is divided into 100 sec bins |
 |
 |
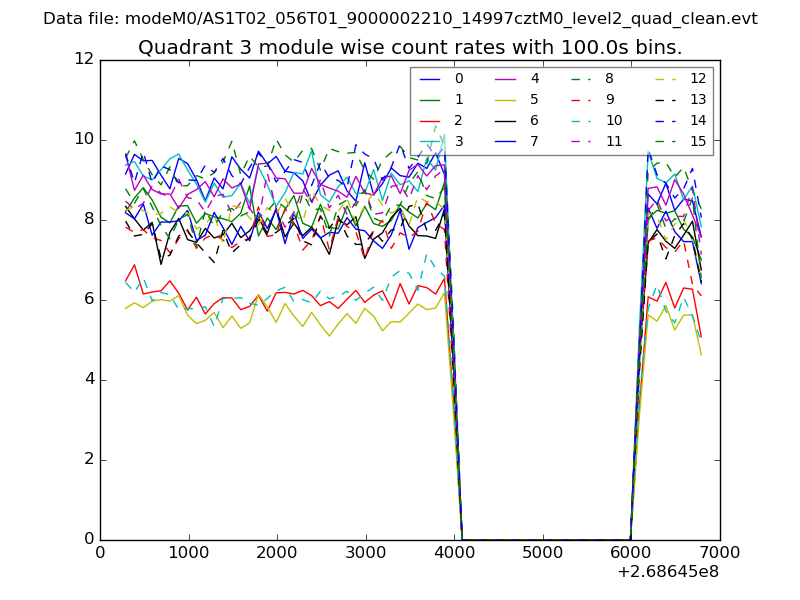
| Module-wise count rates for Quadrant D Data is divided into 100 sec bins |
 |
 |
| Parameter | Plot |
|---|---|
| CZT HV Monitor | 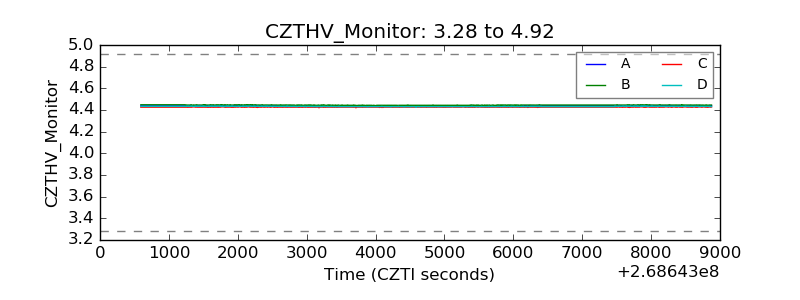 |
| D_VDD | 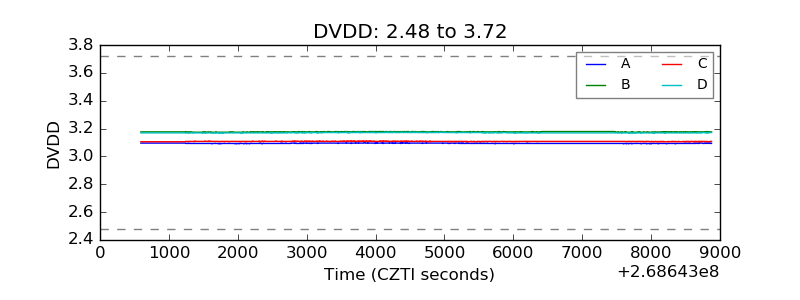 |
| Temperature 1 | 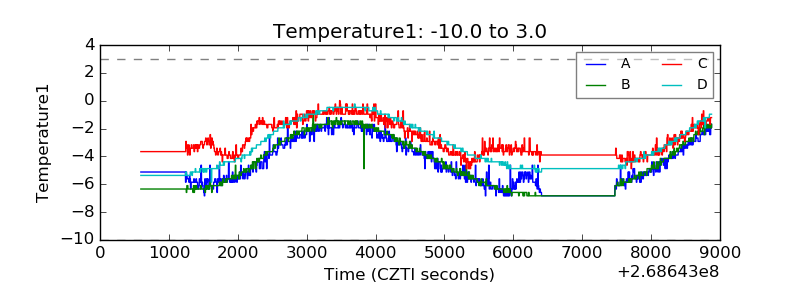 |
| Veto HV Monitor | 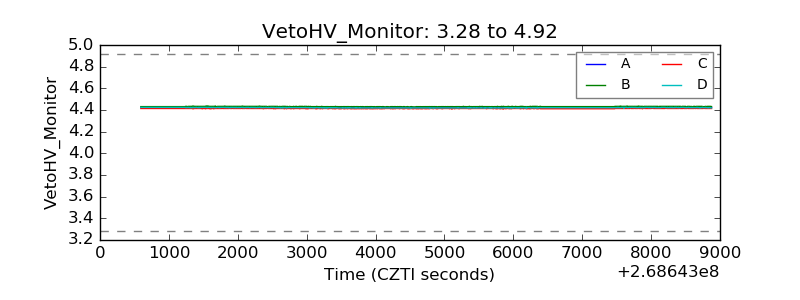 |
| Veto LLD | 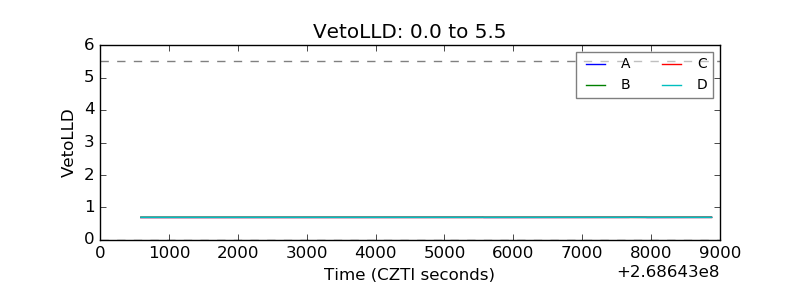 |
| Alpha Counter |  |
| _CPM_Rate |  |
| CZT Counter | 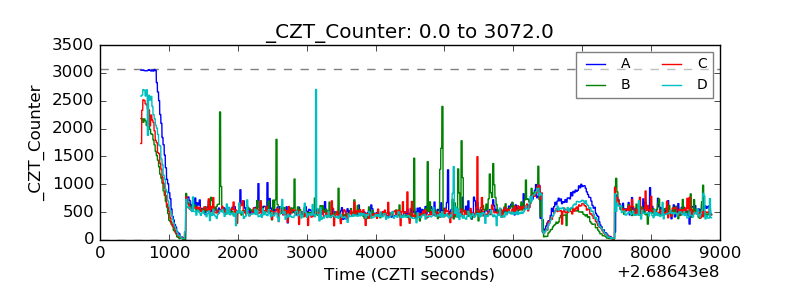 |
| +2.5 Volts monitor |  |
| +5 Volts monitor |  |
| _ROLL_ROT | 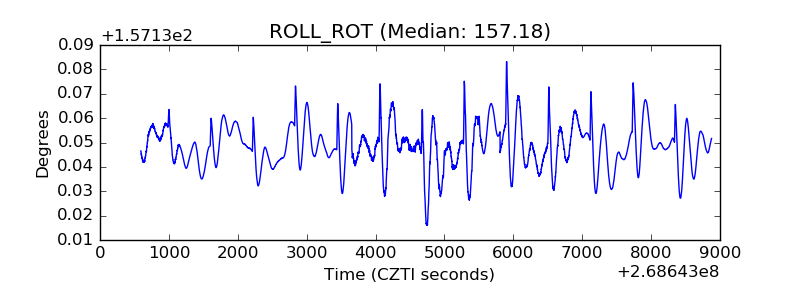 |
| _Roll_DEC | 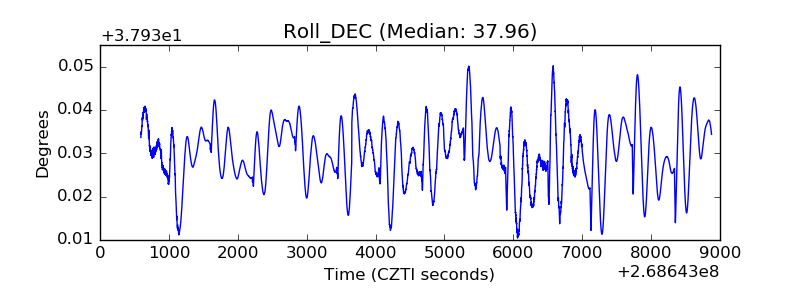 |
| _Roll_RA | 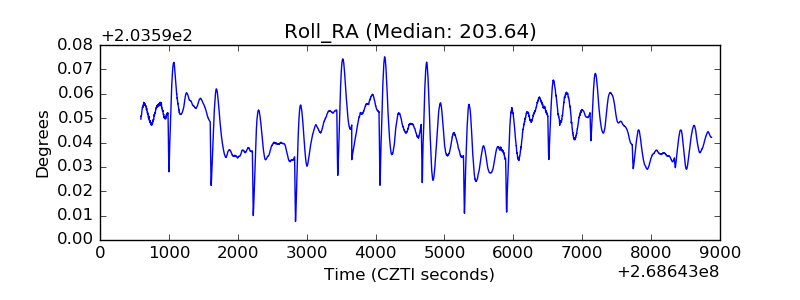 |
| Veto Counter | 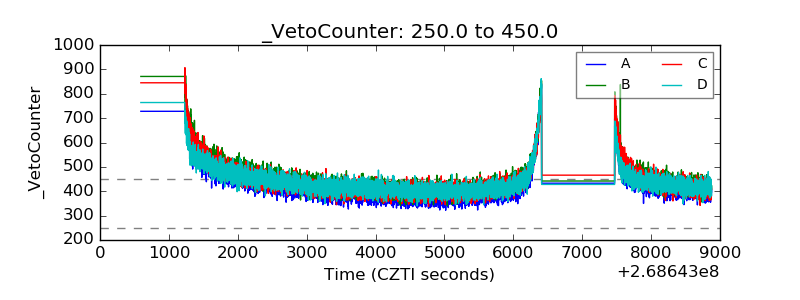 |